Accurate measurements and establishment of a model of the mechanical properties
of dried corn kernels
Jiachang Feng, Zidan Wu, Debo Qi, Yi Jin, and Wenfu Wu* Department of Biological and Agricultural Engineering, Jilin University, Changchun, China
Received June 23, 2018; accepted December 11, 2018
*Corresponding author e-mail: [email protected]
A b s t r a c t. Mechanical drying significantly affects the mechanical properties of corn kernels. Improper drying may result in material losses and in a decline in quality due to pressure, col-lisions, and other factors during subsequent storage and transport operations. A literature survey revealed that at time of writing the characteristics of dried corn kernels have not been systematically and fully studied. In this paper, an orthogonal rotation combina-tion test scheme was designed. Using a multiparameter controllable thin layer drying test bench, corn was dried under different condi-tions (temperature 30-60°C, relative humidity 30-60%, air velocity 0.46-0.94 m s–1, initial moisture content of corn of 20-30% w.b., tempering ratio 0-3). Then, a texture analyser was used to measure the mechanical properties (rupture force, rupture energy, modulus of elasticity and brittleness) of the dried corn kernels. Relationship models were established for the rupture force, rupture energy, modu-lus of elasticity and brittleness and drying conditions of corn kernels. An increase in the drying temperature from 30 to 60°C increased the rupture energy, elastic modulus, and brittleness of the corn kernels by 19.11, 11.76, and 4.02%, respectively; an increase in the drying relative humidity from 30 to 60% increased the rupture force, ener-gy, modulus of elasticity and brittleness by 15.07, 13.74, 20.73, and 3.31%, respectively.
K e y w o r d s: thin layer drying, corn kernel, mechanical prop-erty, model
INTRODUCTION
As an important food and commercial feed crop, corn is widely grown in many countries, including China, and it is an important staple food for humans and animals. At harvest time, the moisture content of corn ranges from 25 to 35% (Marques da Silva and Silva, 2006), which is not a suitable range for storage. Corn must be dried with heated air until it reaches an acceptable moisture content for stor-age and processing.
Thin layer drying in a convective atmosphere is a pro-cess by which corn is fully exposed to the heating medium under different drying conditions; this process is the basis for the study of deep-bed drying (Doymaz and Pala, 2003). The study concerning the mechanical properties of corn kernels aims to determine the mechanical properties, such as rupture force, failure energy, deformation under load and brittleness of corn, and to provide data regarding the com-pression and collision of corn during transportation and storage (Cheng et al., 2016).
Studies concerning the mechanical properties of food grains began in the 1960s. Prasad and Gupta (1973) per-formed a quasistatic compression test to determine the resilience of rice kernels. The effect of moisture content on the mechanical properties of faba bean grains has been investigated (Altuntaş and Yıldız, 2007). The results showed that the specific deformation and rupture energy of faba bean grains increased in magnitude with an increase in moisture content, but rupture force decreased; the maximum rupture force was on the Z axis, which is the shortest axis. According to (Zareiforoush et al., 2010), the compression azimuth and loading and unloading rates substantially impact paddy grain compression characteristics. Kiani et al. (2011) determined Poisson’s ratio and Young’s modulus of elasticity for red bean grains with different moisture contents (5, 7.5, 10, 12.5 and 15% w.b.), and the results may be used to design harvest-ing machines or other mechanical devices.
During the drying process, the moisture gradient increases, the internal structure shrinks, and the internal stress of the cereal grains increase due to the reduction in moisture content. Different drying methods and drying conditions exert different effects on changes to the internal
stress of cereals. Hence, it is necessary to study the changes to the mechanical properties of cereal grains under different drying conditions (Pawlak, 2003).
Woźniak, Niewczas and Kudra (1999) showed that the correlations between the drying conditions and mechani-cal properties of wheat grain were significant, however, the effect of the initial moisture content on the mechanical properties was not significant. Davidson et al. (2000) con-ducted an experiment with a thin layer dryer to investigate the relationship between drying conditions and the physical qualities of corn in terms of kernel stress cracks and break-age susceptibility. The drying conditions were established using four levels of drying air temperature (40, 60, 80, and 100°C) and two levels of drying medium humidity (air sat-uration temperatures of 5 and 25°C). Both stress cracking and breakage susceptibility increased with drying tempera-ture, and the higher level of drying air humidity resulted in a much longer drying time at the lowest air temperature (40°C). Kalantari and Eshtavad (2013) investigated the effect of different tempering periods on rice grain breakage in a thin layer dryer. They established four drying tempera-tures (40, 50, 60, and 70°C) and four levels of tempering ambient pressure (0.4, 0.6, 0.8, and 1.0 atm) and found that after drying at 50 and 60°C at 0.8 atm, the minimum crack rates occurred within 1 and 2 h of tempering time, respectively. However, the authors did not consider the effect of the humidity of the drying medium on the results. Talab et al. (2012) measured the glass transition tempera-ture of rice with different moistempera-ture contents and compared the hardness of the rice grains exposed to different drying temperatures. Rice exposed to a drying temperature rang-ing from 55-60°C was harder than rice dried under other conditions. The authors explained that this phenomenon was caused by the use of a drying temperature that was higher than the glass transition temperature of rice, which caused the grain to change to a glassy state and increased its hardness. Aquerreta et al. (2007) compared the effects of tempering temperatures after high-temperature drying (60°C) on the rice dehydration rate and head rice yield. The tempering temperatures used in the experiment were the ambient temperature (20°C), 40 and 60°C. After high-temperature (60°C) tempering, the number of cracks in the rice decreased, and the drying time was reduced by 38% with the same dehydration rate, which is very important for the processing of dried rice. Nevertheless, the authors did not consider the tempering time, and the experimental results were not sufficiently comprehensive. Lewicki and Jakubczyk (2004) studied the changes in the mechanical properties of apple slices exposed to different drying tem-peratures and moisture content conditions. Changes in the mechanical stress resistance of apples after drying at 50, 60, and 70°C were not significant, but compared with apples dried at 80°C, the loading-unloading curve of the apple slices changed significantly. Minaei (2014) determined the mechanical properties of corn kernels dried at different
dry-ing temperatures. Durdry-ing the test, the drydry-ing temperature was set to 40, 50, 60, or 70°C, and the air flow rate was sta-ble at 1.8 kg min–1. According to his report, when the drying temperature increased from 40 to 70°C, the stress, tough-ness, and elastic modulus of the corn kernels decreased by 26, 36, and 38%, respectively, and the deformation value increased by 12.29%. However, this study lacked an exami-nation of the influences of the initial moisture content of the sample and tempering time on the test results, also, the relative humidity of the drying medium was not controlled.
A review of the literature revealed few studies designed to determine the mechanical properties of cereals after dry-ing. Papers related to the characteristics of dry grain traits are not sufficiently comprehensive, as some parameters could not be controlled with sufficient accuracy, which renders the relevant data and models less applicable and increases the gap between their qualitative conclusions. In the present study, a multiparameter accurately controllable thin layer drying test was conducted based on a thorough consideration of the drying process conditions (medium temperature, relative humidity, initial moisture content, air velocity, and tempering ratio). The rupture force, rupture energy, brittleness, and elastic modulus of the dried corn kernels were accurately determined, and models investi-gating the relationships between the mechanical properties and drying conditions were constructed, providing a data-based foundation for the storage, processing and quality determination of corn.
MATERIALS AND METHODS
Corn kernel samples were stored under vacuum at 4°C for 2 weeks before the experiment. The variety of corn was Xianyu 335 with an initial moisture content of 32% w.b., which was produced in autumn 2017 in Yongji County, Jilin Province, China. The corn samples were removed from their vacuum packaging 2 h before the experiment began. Then, 50 subsamples of the corn kernels were ran-domly selected, and their lengths, widths, and heights were determined using digital callipers. The average size of the corn kernels was a length of 12.137 ± 0.1643 mm, a width of 9.226 ± 0.2232 mm, and a height of 4.135 ± 0.1826 mm.
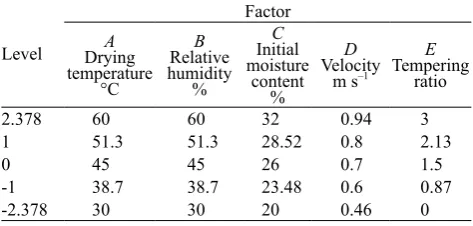
The experimental design was established using the five-factor quadratic rotation combination method. The drying conditions were controlled and included the drying medium temperature, relative humidity (RH), initial mois-ture content of corn (IMC), velocity, and tempering ratio. A five-factor and five-level orthogonal experimental table is shown in Table 1.
vari-ations in this paper ranged between 30 and 60°C. The RH of the drying medium was determined by measuring the RH at the air outletsfrom multiple continuous corn dryers in the previous period. The RH of the tidal outlet ranged from 20 to 60%; therefore, the range of the RH of the dry-ing medium in this paper was 30-60%. Similarly, the drydry-ing air velocity was determined by measuring the wind speed in the hot air ducts of multiple continuous corn dryers. According to the moisture content of the sampled corn, the IMC of the tested corn was set to 20 to 30% w.b. Currently, the tempering ratio of mainstream continuous corn dryers does not exceed 3; therefore, the tempering ratio ranged from 0-3 in the present study.
Table 1. Five-factor and five-level orthogonal experimental table
Level Factor A Drying temperature °C B Relative humidity % C Initial moisture content % D Velocity
m s–1 E Tempering
ratio
2.378 60 60 32 0.94 3
1 51.3 51.3 28.52 0.8 2.13
0 45 45 26 0.7 1.5
-1 38.7 38.7 23.48 0.6 0.87
-2.378 30 30 20 0.46 0
The multiparameter controllable dryer for this experiment could precisely control the drying medium tem-perature, RH and velocity. The dryer’s adjustment range of temperature was room temperature to 100°C (accura-cy ±1°C), the RH was 25-70% (accura(accura-cy ±3%), and the velocity was 0.4-1 m s–1 (accuracy ±0.01 m s–1). The basic working process was to heat the air by means of a heating wire. The axial fan located at the upper part of the machine caused the hot air to flow axially, and the air was divided by the conical surface. Eventually the air returned to the wire for heating. In the process, if the humidity sensor detected that the RH of the air was 2% less than the set value or lower, the program would activate the air humidifier. If the detected humidity was 2% higher than the set value or high-er, the program would activate the exhaust fan. In this way, the stability of the RH of the drying medium was assured. The internal air circulation could recycle the tail gas and maintain constant air humidity in the device.
Before the beginning of the experiment, a certain amount of corn grain was taken out of the refrigerator and restored to room temperature. The moisture content of the sample was determined by a moisture meter, and the moisture con-tent of the corn was adjusted to the required IMC by natural air-drying. The value of each drying parameter was set on a digital controller. After starting the test, the value of the main parameter reached a set value, which was controlled and stabilized on a display. Using the material tray, 1000 g of corn grain was loaded and placed in the warehouse. The thickness of the corn heap in the box was 50 mm. The ware-house door was closed to allow drying to continue. After
15 min of drying, the material bin door was opened, and the corn sample was removed, weighed and placed in a temper-ing box for tempertemper-ing. The tempertemper-ing temperature was the same as the drying temperature, and drying continued after tempering. The PC program included a weighing method to measure the grain water equation and obtain real-time corn moisture content data. The moisture content of every test group was determined using the standard oven method (ASABE, 2012). When the moisture content was reduced to approximately 14.5% w.b., the door was opened every 15 min, and a 70 g corn sample was removed. Three samples were removed, and when the selected oven-measured mois-ture was approximately 14% w.b., the sample was inserted in a sealed bag and placed in a desiccator. Tempering was no longer performed during sampling. Then, 30 corn kernels were removed from each group to determine their size and the average length, width, and height. A total of 59 sets of experiments were conducted.
Uniaxial compression tests were conducted using a CT3 texture analyser (Brookfield) with a load cell of 50 kg con-nected to a PC with specialized software. The cylindrical probe used in the present study was TA10, and the loading rate used for all tests was 0.02 mm s–1, the compression distance was 0.6 mm, and the compression trigger load was 10 g. Every test was performed on just one kernel, and the compression force was measured in the direction along the shortest axis of the corn kernel since this axis is the main direction of force during the cracking process. The rupture force (Fr), rupture energy (Er) and brittleness were directly obtained using software on a PC connected to a texture ana-lyser. The Fr and deformation values represented the force and deformation at the rupture point, respectively, and the Er was the area under the curve for the rupture point. The brittleness value was the time taken to reach the rupture point, and a shorter time represented a more brittle corn kernel (Liu, 2011).
The modulus of elasticity (Em) of the corn kernels was estimated using the following standard equations (ASAE, 2003):
R1=
H
2 , (1)
R′
1=
H2+L2
4
2H , (2)
Em=0.338K1
.5F(1
−µ2)
d1.5
1 R1 + 1 R′ 1 1/3
+ 1 R2 + 1 R′ 2 1/33/2
, (3)
Data were statistically analysed using Design-Expert 8.0 software to investigate the effect of drying conditions on the mechanical properties of dried corn and establish models for the relationships between the drying parameters and mechanical properties. Duncan’s multiple range tests were used to establish the differences between the mean values at a confidence level of 0.05 (p < 0.05).
RESULTS AND DISCUSSION
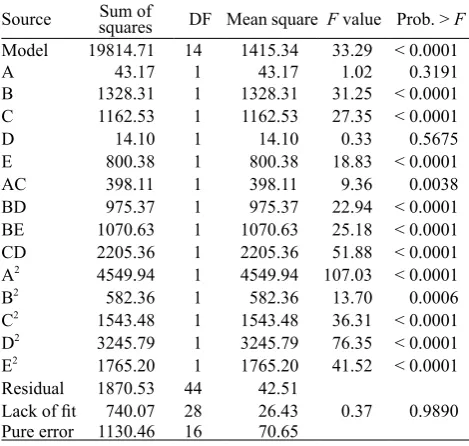
According to Table 2, the effect of the drying medium temperature and velocity on Fr was not significant, whereas the RH, IMC and tempering ratio significantly influenced Fr. The drying medium RH had the most pronounced effect (31.25) on the F value. Similarly, the IMC had a greater influence on Fr than the tempering ratio. This finding con-tradicted a previous report, which stated that IMC had no effect on the mechanical properties of corn after drying (Woźniak, Niewczas and Kudra, 1999). The quadratic mod-el of Fr and its drying parameters are shown in Table 3. A, B, C, D, and E in the models represent the drying tempera-ture, the RH of the drying medium, the IMC, the velocity, and the tempering ratio, respectively.
Table 2. ANOVA of the influence of various drying parameters on the Fr of corn kernels
Source squaresSum of DF Mean square F value Prob. > F Model 19814.71 14 1415.34 33.29 < 0.0001
A 43.17 1 43.17 1.02 0.3191
B 1328.31 1 1328.31 31.25 < 0.0001
C 1162.53 1 1162.53 27.35 < 0.0001
D 14.10 1 14.10 0.33 0.5675
E 800.38 1 800.38 18.83 < 0.0001
AC 398.11 1 398.11 9.36 0.0038
BD 975.37 1 975.37 22.94 < 0.0001
BE 1070.63 1 1070.63 25.18 < 0.0001 CD 2205.36 1 2205.36 51.88 < 0.0001 A2 4549.94 1 4549.94 107.03 < 0.0001
B2 582.36 1 582.36 13.70 0.0006
C2 1543.48 1 1543.48 36.31 < 0.0001 D2 3245.79 1 3245.79 76.35 < 0.0001 E2 1765.20 1 1765.20 41.52 < 0.0001 Residual 1870.53 44 42.51
Lack of fit 740.07 28 26.43 0.37 0.9890 Pure error 1130.46 16 70.65
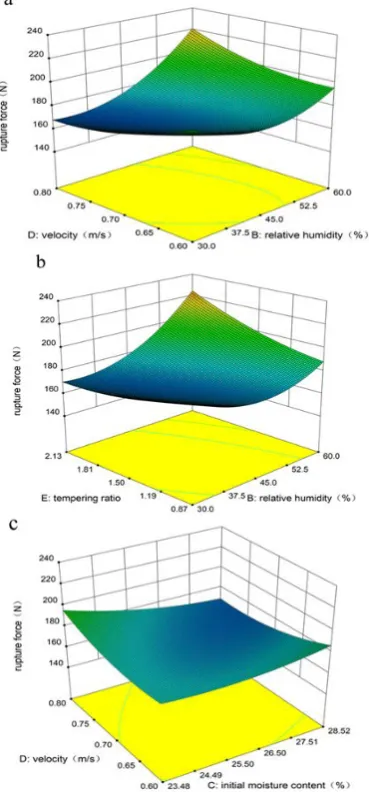
The simultaneous effects of the RH and velocity of the drying medium on the rupture force are shown in Fig. 1a. The greater the velocity, the more significant the effect of RH on the rupture force. This finding may be related to the effect of the RH of the drying medium on the distribu-tion of moisture during drying. When the velocity was 0.6 m s–1, a significant change in Fr was not observed; however, when the velocity increased to 0.8 m s–1, the Fr increased by 14.19% as the RH increased from 30 to 60%. As shown in Fig. 1b, the highest Fr value was obtained at the
highest drying RH and highest tempering ratio. As the RH Table 3.
Model coefficients
and statistical indices of the ef
fects of drying parameters on the mechanical properties of corn kernels
Variable Model R 2 Pred-R 2 SD
Rupture force
Y1
= 1
169.01
122 – 13.12040A
–
14.27086B – 9.15878C –
538.99304D – 98.39162E –
0.22193AC + 8.76335BD +
1.45735BE – 32.94307CD
+
0.21
166A
2 + 0.075883B 2 +
0.77212C
2 + 71
1.03975D
2 +
13.21 145E 2 0.91 0.86 6.52
Rupture ener
gy
Y2
= – 1
12.0874 + 1.38985A
–
1.1369B + 12.0472C +
14.31478D – 35.761E –
0.055268AC + 0.16649AE +
2.40528BD + 0.68061BE
–
4.94728CD + 7.5944DE –
0.015929B
2 – 0.12239C 2 –
2.34345E
2
0.90
0.85
1.27
Modulus of elasticity
Y4
= – 128.43548 + 13.81
168A
–
0.058581B – 18.88826C +
733.2681
1D – 213.89626E –
0.090299AB – 0.062862AC –
6.43508AD + 0.5772AE
–
8.91522BD + 2.01569BE +
5.10754CD + 2.23549CE +
39.79657DE – 0.047148A
2 +
0.088016B
2 + 0.31487C 2 –
161.37939D
2 + 3.49249E
2 0.97 0.94 2.46 Brittleness Y5
= 35.42413 + 0.49234A
–
0.63406
+ 0.47595C +
10.58582D – 8.10005E –
3.42293 · 10
–3 AB +
0.06051
1AE + 0.020187BC +
0.23992BD
+
0.090478BE +
1.8821
1DE – 4.23167 · 10
–3 A 2 – 0.027833C 2 –
16.79121D
2
0.85
0.78
increased, the tempering ratio exerted a more significant effect on Fr. When the RH was 30%, the Fr changed by 9.99% as the tempering ratio changed from 0.87 to 2.13. For the RH value of 60%, a 19.18% variation in this index was observed.
Fig. 1. Simultaneous effect of (a) drying medium RH-velocity (b) RH-tempering ratio and (c) IMC-velocity on rupture force.
In agreement with the description presented in Fig. 1a, velocity and initial moisture content exerted significant effects on Fr (Fig. 1c). The highest Fr value was observed at the lowest IMC and highest velocity. Similar trends were observed by (Chayjan and Kaveh, 2014), which indicat-ed that the rupture force of terebinth seindicat-ed increasindicat-ed with increasing drying medium velocity. A higher velocity and a lower IMC results in faster drying rates (Li and Moray, 1984), which creates moisture gradients between the inter-nal and exterinter-nal layers of the corn kernel. This change results in internal stresses and even cracks (Pawlak, 2003) and may be the reason for the reduced Fr of the corn ker-nels. The significance of the effect of the IMC on the index gradually increased as the velocity increased. The IMC-induced change in Fr ranged from 23.48 to 28.52% and
increased by 3.46 to 13.77% as the air velocity increased from 0.6 to 0.8 m s–1. The rupture force of barnyard millet kernel (17.87-25.20 N), soybean (191.09-270.66 N), paddy grain (88.33-167.70 N in horizontal orientation), and ter-ebinth seed (44.69-135.62 N) were reported by Singh et al. (2010), Tavakoli (2009), Zareiforoush et al. (2012), and Chayjan and Kaveh (2014), respectively. And Minaei 2014) indicated that the rupture force of corn decreased from 345.405 to 271.198 N with an increase in drying tem-perature form 40 to 70°C. The rupture force of corn kernel in the present study ranged from 158 to 223.61 N.
Er is an indicator of the toughness of a material because a higher Er represents the increased difficulty of breaking the material (Zhang et al., 2005).
Table 4. ANOVA of the influence of various drying parameters on the Er of corn kernels
Source squaresSum of DF squareMean F value Prob. > F Model 664.17 14 47.44 29.43 < 0.0001
A 70.73 1 70.73 43.88 < 0.0001
B 30.94 1 30.94 19.19 < 0.0001
C 19.66 1 19.66 12.20 0.0011
D 12.23 1 12.23 7.59 0.0085
E 7.14 1 7.14 4.43 0.0411
AC 24.69 1 24.69 15.31 0.0003
AE 14.00 1 14.00 8.69 0.0051
BD 73.48 1 73.48 45.58 < 0.0001
BE 233.51 1 233.51 144.85 < 0.0001
CD 49.74 1 49.74 30.85 < 0.0001
DE 7.33 1 7.33 4.54 0.0387
B2 25.66 1 25.66 15.92 0.0002
C2 38.78 1 38.78 24.06 < 0.0001
E2 55.54 1 55.54 34.45 < 0.0001
Residual 70.93 44 1.61
Lack of fit 31.15 28 1.11 0.45 0.9698
Pure error 39.79 16 2.49
struc-ture of the kernel. Higher temperastruc-tures induced a greater internal shrinkage of the corn kernels, resulting in a strong-er structure with limited intstrong-ernal flexibility and thstrong-erefore a greater Er. Based on the slope of the graph presented in Fig. 2b, a greater tempering ratio results in a more signifi-cant effect of temperature on the Er.
Fig. 2. Simultaneous effect of (a) drying medium temperature-IMC (b) temperature-tempering ratio (c) RH-velocity and (d) velocity-tempering ratio on rupture energy.
The RH of the drying medium and velocity had simultane-ous effects on Er (Fig. 2c). The highest Er value was associated with drying parameters with the highest RH and the highest air
velocity. The higher the velocity of the drying medium, the greater the significance of the effect of RH on Er. For exam-ple, when the velocity was 0.6 m s–1, the Er was reduced by 1.34 mJ as the RH increased from 38.7 to 51.3%, and when the air velocity increased to 0.8 m s–1, the index increased by 4.72 mJ within the same range of RH values.
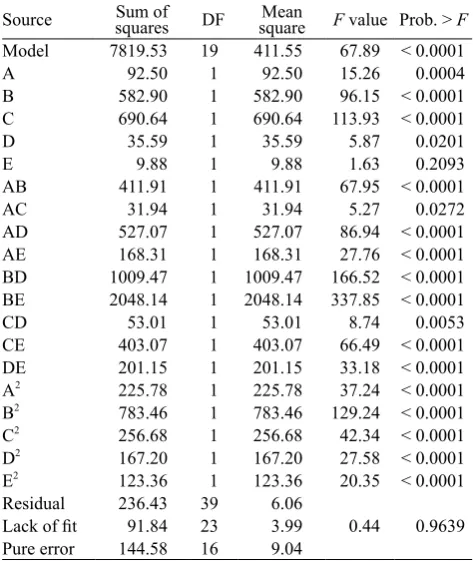
Table 5. ANOVA of the influence of various drying parameters on the Em of corn kernels
Source squaresSum of DF squareMean F value Prob. > F Model 7819.53 19 411.55 67.89 < 0.0001
A 92.50 1 92.50 15.26 0.0004
B 582.90 1 582.90 96.15 < 0.0001
C 690.64 1 690.64 113.93 < 0.0001
D 35.59 1 35.59 5.87 0.0201
E 9.88 1 9.88 1.63 0.2093
AB 411.91 1 411.91 67.95 < 0.0001
AC 31.94 1 31.94 5.27 0.0272
AD 527.07 1 527.07 86.94 < 0.0001
AE 168.31 1 168.31 27.76 < 0.0001
BD 1009.47 1 1009.47 166.52 < 0.0001 BE 2048.14 1 2048.14 337.85 < 0.0001
CD 53.01 1 53.01 8.74 0.0053
CE 403.07 1 403.07 66.49 < 0.0001
DE 201.15 1 201.15 33.18 < 0.0001
A2 225.78 1 225.78 37.24 < 0.0001
B2 783.46 1 783.46 129.24 < 0.0001
C2 256.68 1 256.68 42.34 < 0.0001
D2 167.20 1 167.20 27.58 < 0.0001
E2 123.36 1 123.36 20.35 < 0.0001
Residual 236.43 39 6.06
Lack of fit 91.84 23 3.99 0.44 0.9639
Pure error 144.58 16 9.04
The simultaneous effects of air velocity and the temper-ing ratio on the Er are depicted in Fig. 2d. The lowest Er value was observed at the lowest air velocity and the lowest tempering ratio. A larger tempering ratio resulted in a larger Er and the greater significance of the effect of air velocity on Er. For instance, when the tempering ratio was 0.87, increasing the air velocity from 0.6 to 0.8 m s–1 increased Er by only 0.032%, whereas when the tempering ratio was 2.13, the same process increased Er by 6.06%.
to a moisture content of 30 to 10% ranged from 64.50 to 85.40 mJ (AbdEl Maksoud, 2009). The values in our cur-rent study ranged from 24.75 to 42.30 mJ.
The Em reflects the ability of a material to resist defor-mation. Low elastic modulus values under compressive loading demonstrate the ductile behaviour of a material (Pawlak, 2003).
The ANOVA results for changes in the Em of the ker-nels treated under different drying parameters are presented in Table 5. With the exception of E (tempering ratio) all five factors exerted significant effects on this index. Based on the F values, the IMC and RH exerted much greater effects than the drying temperature and air velocity. A quadratic model was the most appropriate model for predicting Em, and the results are shown in Table 3.
Fig. 3. Simultaneous effect of (a) drying medium temperature-RH (b) RH-velocity and (c) IMC-velocity on modulus of elasticity.
Em varied under different drying parameters (Fig. 3). The simultaneous effects of the drying temperature and RH are presented in Fig. 3a. A larger Em was obtained at a higher RH and lower temperature. Fig. 3b also confirms that a higher RH produces a larger Em at air velocities between 0.6 and 0.65 m s–1. As depicted in Fig. 3c, the slope
of the graph confirms the results obtained from the F val-ues, showing that the IMC had a much greater effect than air velocity on this index, and greater air velocity resulted in a more significant influence of the IMC on the Em. When the velocity was 0.6 m s–1, the Em increased by 7.74% (69.98-75.39 MPa), while the IMC increased from 23.48 to 28.52%, and when the air velocity increased to 0.8 m s–1, the index increased by 15.26% (69.22-79.78 MPa).
Shelef and Mohsenin (1969) studied the mechani-cal properties of corn kernels under various loading conditions and with various moisture contents, and the values of Em in their experiments ranged from 82.74 to 1813.32 MPa. The modulus of elasticity of African nutmeg (201.5-41.30 N mm–2), safflower seed (106.13-90.35 MPa), and red bean grain (253.26-93.06 MPa), were reported by Etekpe (2008), Etekpe (2008), Kiani et al. (2011), and Khodabakhshian and Shakeri (2012), respectively. Minaei (2014) showed that the modulus of elasticity of corn ker-nels ranged from 294.188 to 188.783 MPa after drying at 40-70°C. In comparison, the elastic modulus values ranged from 37.74 to 101.56 MPa in the present study.
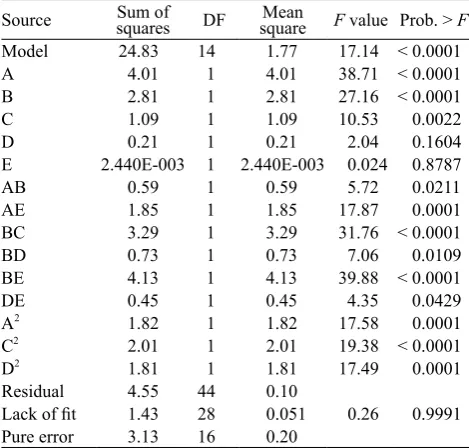
Based on the data shown in Table 6, the effects of the air velocity and tempering ratio on brittleness were not significant, whereas the drying temperature, RH and IMC significantly influenced brittleness. In terms of F values, temperature exerted the greatest effect, followed by the RH and IMC. The quadratic model presented in Table 3 was the most appropriate model for estimating this index.
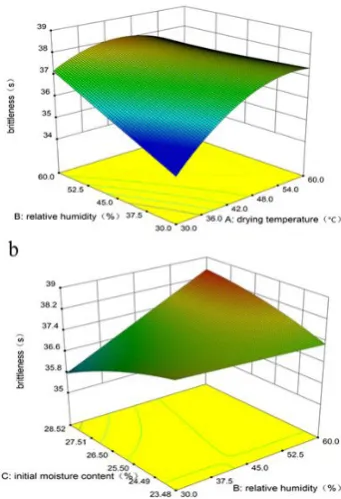
Fig. 4. Simultaneous effect of (a) drying medium temperature-RH and (b) RH-IMC on brittleness.
tem-perature and RH on brittleness are illustrated in Fig. 4a. Generally, brittleness gradually increased as the drying temperature increased. The lowest value of brittleness was obtained at the lowest temperature and lowest RH. Additionally, the effect of temperature on brittleness was more pronounced at a lower RH. As reported by Li Li-juan (2013) the structural properties (porosity, shrinkage, etc.) of dried products are the main factors affecting the brit-tleness of the goods. This finding could explain why the higher drying temperature exacerbated brittleness. Higher temperatures caused corn kernel shrinkage and poor poros-ity, thereby increasing the brittleness value.
Table 6. ANOVA of the influence of various drying parameters on the brittleness of corn kernels
Source squaresSum of DF squareMean F value Prob. > F
Model 24.83 14 1.77 17.14 < 0.0001
A 4.01 1 4.01 38.71 < 0.0001
B 2.81 1 2.81 27.16 < 0.0001
C 1.09 1 1.09 10.53 0.0022
D 0.21 1 0.21 2.04 0.1604
E 2.440E-003 1 2.440E-003 0.024 0.8787
AB 0.59 1 0.59 5.72 0.0211
AE 1.85 1 1.85 17.87 0.0001
BC 3.29 1 3.29 31.76 < 0.0001
BD 0.73 1 0.73 7.06 0.0109
BE 4.13 1 4.13 39.88 < 0.0001
DE 0.45 1 0.45 4.35 0.0429
A2 1.82 1 1.82 17.58 0.0001
C2 2.01 1 2.01 19.38 < 0.0001
D2 1.81 1 1.81 17.49 0.0001
Residual 4.55 44 0.10
Lack of fit 1.43 28 0.051 0.26 0.9991
Pure error 3.13 16 0.20
As shown in Fig. 4b, a lower RH value potentially reduced brittleness, and the lowest brittleness was observed in the samples with the highest initial moisture content. The slope of the graph shows that RH exerted a more significant effect on the brittleness of the samples with a higher IMC. When the IMC was 23.48%, a significant change in brittle-ness was not observed when RH ranged from 30 to 60%; however, as IMC increased to 28.52%, brittleness changed by 3.09% within the same range of RH values.
CONCLUSIONS
1. In this paper, the mechanical properties of dried corn kernels were accurately measured by controlling the differ-ent drying conditions, including the temperature, relative humidity, velocity of the drying medium, tempering ratio and initial moisture content of corn.
2. The quadratic model successfully adapted to the changes in mechanical properties observed after drying under different drying conditions.
3. The drying temperature, relative humidity and initial moisture content generally exerted more significant effects than the air velocity and tempering time on the mechanical
properties of the corn kernels. When other drying factors were set to zero, the rupture energy (31.81-37.89 mJ), modulus of elasticity (59.12-66.07 MPa), and brittleness (35.81-37.25 s) increased as the drying temperature increased from 30 to 60 °C. The rupture force (174.84-201.19 N), rupture energy (29.26-33.28 mJ), modulus of elasticity (84.27-101.74 MPa), and brittleness (36.87-38.09 s) increased as the relative humidity increased from 30 to 60%.
4. Among the indices studied as indicators of the mechanical properties of corn kernels, rupture energy and brittleness were identified as the best ones since they reflect the energy requirements and cracking sensitivity of corn (the time it takes to break) during milling. Based on our results, we recommend a lower drying temperature and lower rela-tive humidity for processing and milling to consume less energy and produce corn kernels that are easier to grind.
AKNOWLEDGEMENTS
The authors wish to express their gratitude for the fund-ing support received under the project “The key technology and equipment research and development of the paddy tem-perature-varying intelligent drying system”, grant number 2016YFD0401001.
Conflict of interest: The authors declare that they have no conflict of interest.
Compliance with ethical requirements: This study
does not contain any experiment involving human or ani-mal subjects.
REFERENCES
AbdEl Maksoud M.A., 2009. Mechanical properties of corn ker-nels. J. Agric. Eng. Res., 26(4), 1901-1922.
Altuntaş E., Yıldız M., 2007. Effect of moisture content on some physical and mechanical properties of faba bean (Vicia faba L.) grains. J. Food Eng., 78(1), 174-183. https://doi. org/10.1016/j.jfoodeng.2005.09.013
Aquerreta J., Iguaz A., Arroqui C., Vírseda P., 2007. Effect of high temperature intermittent drying and tempering on rough rice quality. J. Food Eng., 80(2), 611-618. https://doi. org/10.1016/j.jfoodeng.2006.06.012
ASABE, 2012. Moisture measurement d unground grain and seeds. ASABE S352.2 APR1988 (R2012). St Joseph, Michigan. ASAE, 2003. Compression test of food materials of convex shape.
American Society of Agricultural Engineers Standard #S368.4; ASAE: St. Joseph, MI,, 593-603.
Chayjan R.A., Kaveh M., 2014. Physical parameters and kinetic modeling of fix and fluid bed drying of terebinth seeds: tere -binth seed drying in fluidized bed. J. Food Proc.Preserv., 38(3), 1307-1320. https://doi.org/10.1111/jfpp.12092
Davidson V.J., Noble S.D., Brown R.B., 2000. Effects of drying air temperature and humidity on stress cracks and breakage of maize kernels. J. Agric. Eng. Res., 77(3), 303-308. htt-ps://doi.org/10.1006/jaer.2000.0607
Dong R., Lu Z., Liu Z., Koide S., Wei C., 2010. Effect of drying and tempering on rice fissuring analysed by integrating intra-kernel moisture distribution. J. Food Eng., 97(2), 161-167. https://doi.org/10.1016/j.jfoodeng.2009.10.005
Doymaz I., Pala M., 2003. The thin-layer drying characteristics of corn. J. Food Eng., 60(2), 125-130. https://doi.org/10. 1016/S0260-8774(03)00025-6
Etekpe W.B.E.A.R.M.D.G.W.W., 2008. Determination of pois-son’s ratio and elastic modulus of african nutmeg (monodora Myristica). Int. Agrophys., 22.
GB/T, (21017-2007). Technical specification for drying corn in Chinese.
Kalantari D., Eshtavad R., 2013. Influence of different temper -ing period and vacuum conditions on the rice grain breakage in a thin layer dryer. Cercetari Agronomice in Moldova, 46(4), 5-12. https://doi.org/10.2478/v10298-012-0098-2
Khodabakhshian R., Shakeri M., 2012. Investigation on some mechanical aspects of safflower seed to the design of pro -cessing equipment. Int. J. Agric. Tech.
Kiani M.K.D., Maghsoudi H., Minaei S., 2011. Determination of poisson’s ratio and young’s modulus of red bean grains. J. Food Proc. Eng., 34(5), 1573-1583. https://doi.org/10. 1111/j.1745-4530.2009.00391.x
Lewicki P.P., Jakubczyk E., 2004. Effect of hot air temperature on mechanical properties of dried apples. J. Food Eng., 64(3), 307-314. https://doi.org/10.1016/j.jfoodeng.2003.10.014
Li H., Moray R.V., 1984. Thin-layer drying of yellow dent corn. T. ASAE, 27(2), 581-585. https://doi.org/10.13031/2013.32832 Li Li-juan L.C.-q., 2013. Effect of different drying methods on
quality of nelumbo nucifera gaertn products. J. Nuclear Agric. Sci., 27(11), 1697-1703.
Liu X., Jiang. N., Liu, CH.Q., Li D.J., 2011. Effects of drying methods on the quality of black edmame. Food Sci., 32(18), 59-62.
Marques da Silva J.R., Silva L.L., 2006. Relationship between distance to flow accumulation lines and spatial variability of irrigated maize grain yield and moisture content at har-vest. Bios. Eng., 94(4), 525-533. https://doi.org/10.1016/j. biosystemseng.2006.04.011
Minaei S., 2014. Effect of drying temperature on mechanical properties of dried corn. Dry. Technol., 32(7), 774-780. https://doi.org/10.1080/07373937.2013.845203
Pawlak G., 2003. Effect of drying on microstructure of plant tis-sue. Dry. Technol., 21(4), 657-683. https://doi.org/10. 1081/ DRT-120019057
Prasad S., Gupta C.P., 1973. Behavior of paddy grains under quasi-static compressive loading. T. ASAE 16(2), 328-330. https://doi.org/10.13031/2013.37513
Shelef L., Mohsenin N.N., 1969. Effect of moisture content on mechanical properties of shelled corn. Cereal Chem., 46(3), 242-253.
Singh K.P., Mishra H.N., Saha S., 2010. Moisture-dependent prop-erties of barnyard millet grain and kernel. J. Food Eng., 96(4), 598-606. https://doi.org/10.1016/j.jfoodeng.2009.09.007
Talab K.T., Ibrahim M.N., Spotar S., Talib R.A., Muhammad K.,
2012. Glass transition temperature, mechanical properties of rice and their relationships with milling quality. Int. J. Food Eng., 8(3). https://doi.org/10.1515/1556-3758.2197
Tavakoli H., Rajabipour A., and Mohtasebi S.S., 2009. Moisture-dependent some engineering properties of soybean grains. Agricultural Engineering International: CIGR Journal.
Woźniak W., Niewczas J., Kudra T., 1999. Internal damage vs. mechanical properties of microwave-dried wheat grain. Int. Agrophys., 13(2), 343-347.
Zareiforoush H., Komarizadeh M.H., Alizadeh M.R., 2010.
Mechanical properties of paddy grains under quasi-static compressive loading. New York Science Journal, 3(7), 40-46.
Zareiforoush H., Komarizadeh M.H., Alizadeh M.R., Tavakoli H., Masoumi M., 2012. Effects of moisture con-tent, loading rate, and grain orientation on fracture resistance of paddy (Oryza Sativa L.) grain. Int. J. Food Propert., 15(1), 89-98. https://doi.org/10.1080/10942911003754643