Vol.5 (2015) No. 6
ISSN: 2088-5334
Harmonics Impact a Rising Due to Loading and Solution ETAP Using
the Distribution Substation Transformer 160 kVA
at Education and Training Unit PT PLN
Nasrul
#1and Firmansyah
#2 #Department of Electrical Engineering, Polytechnic State of Padang, West Sumatera, Indonesia E-mail: 1 [email protected], 2 [email protected]
Abstract— Harmonics is a result of the progress of the use of non-linear loads are used in homes and offices. On the other hand, the
energy crisis triggered the increased use of Energy Saving Lamps (LHE), Computer, electronic power equipment that is the cause of harmonics that can interfere with the electrical distribution system including Distribution Transformer (TGD). By performing measurements in the TGD, it is known the existence of harmonic currents which can increase the losses on the TGD. In the measurements made on the TGD Education and Training Unit Lubuk Alung capacity of 160 kVA obtained that influence THDi (Total Harmonic Distortion) currents in the TGD (6.57%) while according to the standard (4%). Shrinkage of 1.22 years of age transformer (4.067%). By using ETAP simulation active capacitor installation of 60 KVAR and 1500 mH obtained THD decline to 8% by neutral currents down to 12 A. From the simulation results ETAP effective current of each phase down 6% while the neutral current down 64%. Transformer derating of these conditions can be avoided and the use of the load can be increased. The impact of harmonics on transformer resulting in transformer losses increased from 3,755 kW to 3.775 kW. The increase in transformer losses (0.16 %) led to decreased work efficiency transformer. This resulted in a decrease in the capacity of the transformer.
Keywords— Harmonics; Neutral currents; transformer; ETAP (Electrical Transient Analysis Program)
I. INTRODUCTION
Harmonics is a sinusoidal component of a period of a wave having one frequency which is a multiple of the original number of the fundamental wave as shown below. The waves distorted periodically occurring on the wave of voltage, current, or power. The phenomenon of harmonics on power system was first investigated by Steinmetz in 1916 (Grady 2002). This harmonic phenomenon often appears on a three-phase system, because the current balance of each phase will affect the value of neutral current. This raises the iron core saturation in the transformer and electrical machinery, especially in the third harmonics. This saturation is caused by the non-linear load characteristics that burdens non-resistive, causing current and voltage Harmonic Distortion (THDi) and (THDv). THDi occur as a result of the use of non-linear loads (non-linear) on users of electricity. While the total demand distortion TDD is, which is the normal maximum current THD depending on the load current IL. In Table 2 the value of h is harmonic h. For voltage harmonics standard is determined by the voltage of the system used.
TABLE I
IEEE-519VOLTAGE DISTORTION LIMITS
Bus Voltage at Pcc IHDv (%) THDv (%)
69 kV and below 3.0 5.0
60.001 through 161 kV 1.5 2.5
161 kV and above 1.0 1.5
Source: IEEE 519-1992 where :
IHDv = Individual Harmonic voltage Distortion THDv = Total Harmonic Distortion
ISC = Maximum short circuit current at the bus
IL = Maximum demand load current of the Fundamental frequency at the bus
n = harmonic multiples n_th
The more harmonics appear in system, then the curve closer to a square shape.
Fig. 1 Wave distortion, wave fundamentals, third harmonic
Fig. 2 Characteristics of the effects of harmonics propagation
II. METHODS
Two methods can be utilised to address this problem; first is by reducing the maximum load on the transformer, and second is to use a transformer with higher rating to allow the same load. Both of the aforementioned methods are known as de-rating. A higher rated transformer can supply a higher load current, and the selection of a transformer for a specific load is an important process. For instance, if the demand is less than the load, the system will not be cost effective. Alternatively, if the load is too high, the system will be overloaded. Therefore, in the present study, a method for selecting a transformer’s rating based on the amount of THD was developed by assuming that the THD is linearly related to the temperature and rating of the transformer.
In the three-phase system is balanced, the currents of the three-phase balanced harmonic sources can be grouped according to the direction of the rotation phase. Flow distorted on each the phase will have the same waveform, and considered that the current in each phase is an odd function, so that a simple analysis.
( )
t I wt I wt I wtIn = 1sin + 3sin3 + 5sin5 (1)
Flows in S phase lagging by 1/3 period to the current phase R and phase T lagging 2/3 period of phase R.
( )
−
=
3
T
t
I
t
I
s R (2)( )
− = 3 2T t I tIT R (3)
In summation harmonic equation:
( )
~ sin(
0)
1
−
= ∑
= In w t
t I n n R (4)
( )
− = ∑ = 3 2 sin ~ 1 n t w In t I n ns π (5)
With: = = − = = K L K , 15 , 12 , 9 , 6 , 3 , 0 , 14 , 11 , 8 , 5 , 2 , 3 2 , 13 , 10 , 7 , 4 , 1 , 3 2 3 2 n n n n
π
π
π
(6)If each harmonic component transformed into components of zero sequence, positive and negative
( ) ( ) (abc)
n
n
A
I
I
0,1,2=
−1 ,, (7)With: = − a a a a A 2 2 ) 1 ( 1 1 1 1 1 3 1 (8)
(a,b,c)
n
I = component nth harmonic currents in phase a, b, c
TABLE II
ORDER HARMONICS BASES ON SEQUENCE
Harmonics Sequence
1,4,7,10,13, ... 3k-2 Positive 2,5,8,11,14, ... 3k-1 Negative 3,6,9,12,15, ... 3k Zero
This does not eliminate the harmonic neutral current, but can generate higher neutral current of the phase currents. The first harmonic sequence is positive polarity, the second harmonic sequence of polarity is negative polarity and the third harmonic sequence is zero, the fourth harmonic is positive (repeatedly sequentially onwards) as shown in Table 1 above. Harmonic frequency higher than the operating frequency will result in decreased efficiency or power loss occurred.
A. Technical Effects Harmonics in Transformers
Transformer is designed to deliver the required power to the load with minimum losses at the fundamental frequency. Harmonic currents and voltages significantly would cause more heat. There are three effects cause more heat to the transformer when the load current contains harmonic components: [2]
1) Flow rms. If the transformer kVA capacity is only
required for the load, harmonic currents can result rms current transformer becomes greater than its capacity. Increased rms currents cause losses in the conductor also increases.
2) Eddy-current loss. Induced current in the transformer
caused by the magnetic flux. This induced current flowing in the winding, at the core, and in other conductive are overwhelmed by the magnetic field of the transformer and
a) b)
d)
c)
causing more heat. Components of this transformer losses increase with the square of the frequency eddy current flow causes. Therefore, it becomes a very important component of loss - loss transformers that cause warming by harmonics.
3) Loss Core. Increase in core loss caused by harmonics
depends on the influence of harmonics on the voltage applied and the design of the transformer core. The larger the voltage distortion, the higher the eddy currents in the core laminations. Increase in core loss due to harmonics is not as critical as the two losses on top.
B. Harmonic Impact on Transformer
Current harmonic distortion (THDi) and voltage harmonic distortion (THDv) flowing in the transformer may cause an impact, as follows: Shrinkage (losses) increased load; Power is able to decrease and Reducing the economic life
C. Losses Increase in Transformer
The increase in transformer losses due to harmonics can be formulated as follows:
PTot-R = PNL + PDC-R + PEC-R + POSL-R
PTot-H = PNL + PDC + PEC + POSL Losses ∆ = PTot-H - PTot-R
Where :
Losses ∆ = Increase transformer losses due to harmonics (kW)
PTot-H = total transformer losses due to harmonics (kW)
PTot-R = Loss total transformer fundamentals (kW)
D. Impact Decreased Ability Power Transformer
Under the influence of current harmonics on the transformer causes an increase transformer losses. Due to the increase in loss causes a decrease in the power transformer capable transformer, where:
PLL-R (pu)
1 + [FHL . PEC-R (pu)] + [ FHL-OSL . POSL-R (pu) ] =
Imax (pu)
√
Where :
Imax (pu) = Maximum Transformer Loading Capability PLL-R (pu) = Loss of load (pu)
FHL = Harmonic loss factor PEC-R (pu) = Loss Eddy Current (pu)
FHL-OSL = Harmonic loss factor for other wandering loss POSL-R (pu) = Loss other wandering (pu)
E. Impact of Economic Decline Transformer Age
Under the influence of current harmonics on transformer cause additional temperature rise of the real in the transformer. Due to the additional rise in the temperature of the transformer is actually probable cause conductor transformer winding hot spot temperature exceeds technical. Conductor temperature of hot spots which go beyond technical temperatures will damage the insulation, so that it will impact on the economic life of the transformer. Age determination is based on a reference temperature of 110˚ C with normal age (normal life) of 20.6 years. Factor Accelerated Ageing (FAA) for the hot spot temperature over ambient (ΘH) above 110˚ C, is
+ Θ −
=
27315000 383
15000
H
e
F
AA (9)Note: ΘH = Hot Spot Temperature Over 0˚C.
So the expected life of the transformer, is
)
(
6
,
20
year
F
Life
Expected
AA
=
(10)F. Identification Harmonics
To identify the presence of harmonics in the distribution system, it can be seen through the following steps: (1) Type the load supplied, for example, what equipment is used by consumers. When the amount of equipment that has a main component made of semiconductor materials such as computers and supporting equipment, variable speed motors, or other devices that use direct current harmonic problems, it can be estimated that there are installed by consumers. (2) Transformer serving non-linear loads in unbalanced load conditions. If the neutral current is greater, then it can be estimated for trilen harmonics and possible decline in the performance of the transformer. (3) Examination of Neutral Voltage Land. If there is a voltage difference Neutral-to-Ground at 2 volts at load state, then there are indications that the problem of harmonics in the load.
G. Harmonic Distortion
Distortion is a change in the form of waves that occur, if the response transfer system output electrical signal or mechanical stimulus input cannot produce perfectly. Distortions diverse as amplitude distortion, frequency distortion and inter-modulation distortion.
In the electric power system harmonic distortion caused by non linear loads. Current wave containing harmonic components called distorted flow. The content of the current and voltage harmonic wave can be expressed in a measure that is commonly used is THD (Total Harmonic Distortion). THD values obtained from comparison of the rms value of all components other than the fundamental harmonics of the fundamental component rms value.
Large THD (Total Harmonic Distortion) is expressed by the following formula:
THD =
M
M
n
n n
1 2
2
∑
=∞= x 100% (11)
Where :
THD = Total Harmonic Distortion (%)
Mn = RMS value of current or voltage harmonics to the n-th
M1 = the RMS value of current or voltage at the fundamental frequency (fundamental).
Total Harmonic Distortion (THD) is defined as the ratio of the rms value of the harmonic components of the basic components (fundamental) and is usually expressed in%. This index is used to measure the deviation of the waveform of the period containing harmonics on the fundamental sinusoidal wave. For one wave of fundamental current, THD is zero.
THDv =
V
V
n
n n
1 2
2
∑
=∞THDi =
I
I
n
n n
1 2
2
∑
=∞= x 100% (13)
Similarly, harmonic distortion measurements to Individual Harmonic Distortion (IHD), which is the ratio between the RMS value of the individual harmonics and the RMS value of the fundamental. And can be expressed as follows:
IHDv =
V
V
n1
x 100% (14)
IHDi =
I
I
n1
x 100% (15)
The relationship between THD with IHD can be seen from the following equation:
THD=
) ...
(
IHD
22+IHD
32+IHD
42+IHD
n2 (16)While Total Demand Distortion (TDD) is the total current harmonic distortion, which can be expressed as follows:
TDD =
I
I
L n n
n
∑
=∞=2 2
x 100% (17)
IL is the maximum load current is needed in the fundamental frequency (fundamental) at the point of connection together.
Large harmonic voltage rms value is:
(18)
Large harmonic current rms value is:
(19)
H. Load Loss (PLL) Trafo
To calculate the transformer load loss in per unit, can be searched by the following formula: [5]:
PLL = Σ Ih2 + ( Σ Ih2 x h2 ) PEC-R (p.u) (20)
P
EC-R = factor eddy current loss
h =number of harmonics
I
h = harmonic currents
Σ I
h 2
is a component of loss I
2
R
In p,u. While (Σ I
h 2
x h
2
) P
EC-R is a component of eddy
current losses in p,u.
I. Measurement
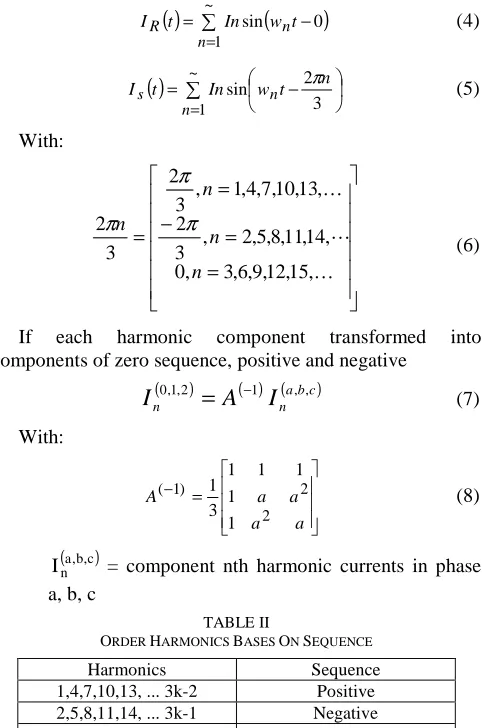
Measurement of harmonics influence on TGD 160 kVA distribution transformers made on Education and Training Unit in PT PLN using a measuring instrument Fluke 43B Harmonics Aanalizer type.
TABLE III
TECHNICAL DATA TRANSFORMERS 160 kVA
No. Commentary Symbol Unit Data
1 No-Load Losses PNL kW 0,355
2 Loss I2R PDC-R kW 2,85
3 Basic loss PSL kW 0,55
4 Eddy current Loss PEC-R kW 0,3025 5 Other basic loss POSL-R kW 0,2475
6 PDC-R+PSL PCU kW 3,4
7
PNL+PDC-R+PEC-R+POSL-R PTOT-R kW 3,755
8 Impedance X % 4
Temperature:
Top oil temperature rise over ambient = 50,7˚C Hot spot conductor rise over ambient = 75,0˚C Ambient temperature (ΘAmb) = 30˚C
Measurement of Harmonics in TGD 160 kVA transformer
Education and Training Unit in PT PLN.
160 kVA
20 kV 380/220 Volt
mm2
80 A 250 A
80 A 80 A
Fig. 3 Single-line TGD 160 kVA Education and Training Unit in PT PLN III.RESULTS AND DISCUSSION
Measurements were performed using harmonics analyzer Fluke 43B. The measurement results obtained as Table 4.
TABLE IV
MEASUREMENT OF HARMONICS CONTENT DISTRIBUTION TRANSFORMER
160 KVASUBSTATION AT EDUCATION AND TRAINING UNIT IN PT PLN
Measurement
1 2 3 4 5
0,05114 0,06168 0,05257 0,06234 0,05144
0,0132 0,01621 0,01431 0,01688 0,01492
0,00409 0,00655 0,00426 0,0064 0,00433
0,00669 0,009 0,00633 0,00834 0,00704
0,00391 0,0043 0,00355 0,00446 0,00323
0,00279 0,00358 0,00279 0,00364 0,0027
0,00019 0,00023 0,00019 0,00021 0,00018
0,00037 0,00066 0,00038 0,00107 0,00037
0,00037 0,00066 0,00017 0,00019 0,00016
0,00037 0,0002 0,00017 0,00044 0,00053
0,00019 0,0002 0,00017 0,00019 0,00016
0,00019 0,0002 0,00017 0,00019 0,00016
Fundamental measurement current = 83,8 A
TABLE V
THE REDUCTION IN TRANSFORMER CAPACITY BASED ON CALCULATION
h Ih/If (Ih/If)2 h2
(Ih/IL)2
h2 h0,8
(Ih/If)2
h0,8
IHDi(pu) IHDi2
1 1,0000000 1 1 1 1 1
3 0,0501603 0,00252 9 0,02264 2,40822 0,00606
5 0,0153213 0,00023 25 0,00587 3,62390 0,00085
7 0,0048696 0,00002 49 0,00116 4,74328 0,00011
9 0,0064531 0,00004 81 0,00337 5,79955 0,00024
11 0,0033255 0,00001 121 0,00134 6,80948 0,00008
13 0,0020983 0,00000 169 0,00074 7,78314 0,00003
15 0,0001742 0,00000 225 0,00001 8,72716 0,00000
17 0,0003563 0,00000 289 0,00004 9,64626 0,00000
19 0,0005147 0,00000 361 0,00010 10,54394 0,00000
21 0,0003563 0,00000 441 0,00006 11,42288 0,00000
23 0,0003563 0,00000 529 0,00007 12,28520 0,00000
25 0,0001584 0,00000 625 0,00002 13,13264 0,00000
Total 1,00283 1,03541 1,00738
Temperature:
Top oil temperature rise over ambient = 50,7˚C Hot spot conductor rise over ambient = 75,0˚C Ambient temperature (ΘAmb) = 30˚C
From the table above calculation, obtained:
%
84
,
99
9984
,
0
)
.
(
p
u
or
I
Max=
There was a decrease of 0.16 % transformer capacity. The Losses Total is : (PTot-R) .
PTot-R = PNL-R + PDC-R + PEC-R + POSL-R
PTot-R = 0,355+ 2,85 + 0,3025 + 0,2475
PTot-R = 3,755 kW
Total Losses total harmonic effect, (PTot-H)
PTot-H = 0,355+ 2,86+ 0,31+ 0,25
PTot-H = 3,775 kW
∆ Losses = PTot-H - PTot-R = 0,02 kW
TABLE VI
CALCULATION RESULTS OF THE EFFECTS OF HARMONICS ON THE
DISTRIBUTION TRANSFORMER TGD 160 KVA AT EDUCATION AND TRAINING UNIT IN PT.PLN
Parameter Day
1st 2nd 3rd 4th 5th
THDi 5,36 6,50 5,52 6,57 5,44
Tansformer
Losses 0,16 0,25 0,17 0,25 0,17
Cost Losses
(IDR) 231.767 346.720 242.984 352.442 239.394
Decreased age of transformer
0,81 1,20 0,85 1,22 0,84
Calculation results of the effects of harmonics on the distribution transformer TGD 160 kVA on Education and Training Unit in PT. PLN, obtained a decrease to 8 % THD with neutral currents down to 12 A.
The simulation results ETAP effective current of each phase down 6 % while the neutral current down 64 %. Derating transformer of these conditions can be avoided and the use of the load can be increased.
A. Running ETAP Simulation
ETAP simulation using harmonic measurement (Electrical Transient Analysis Program)
Fig. 5 Single-line simulation TGD 160 kVA transformer using ETAP
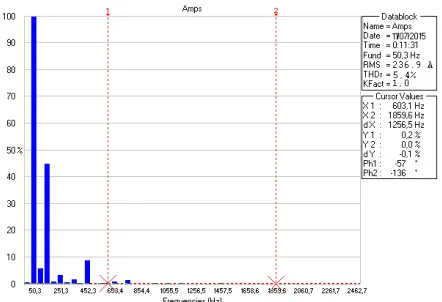
Harmonic spectrum can be illustrated using the histogram, as in Figure 6, where each harmonic spectrum (h1, h2, and so on) is the ratio of current or voltage frequency current or voltage harmonics of the fundamental frequency (fundamental).
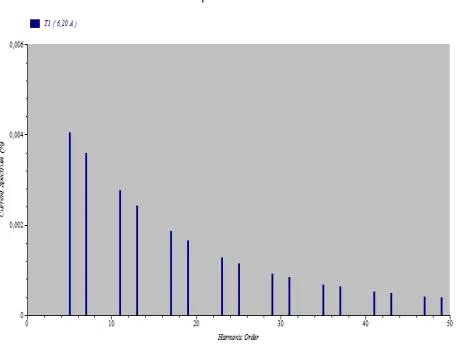
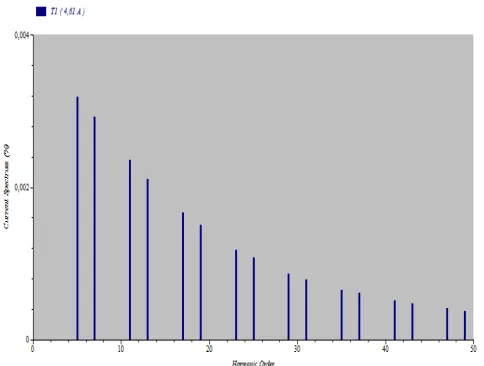
Fig. 7 Harmonic spectrum diagrams after installation of an active filter
B. Efforts to Reduce Harmonics
Immediate action can be taken to reduce the effects of harmonics on power transformers are: (1) Network, The raising the neutral wire impedance value, namely by increasing the cross-sectional conductors. (2) Transformer, Reduce the capacity of the power supply transformer (transformer derating).
IV.CONCLUSIONS
The impact of harmonics on transformer resulting in transformer losses increased from 3,755 kW to 3.775 kW. The increase in transformer losses (0.16 %) led to decreased work efficiency transformer. This resulted in a decrease in the capacity of the transformer.
REFERENCES
[1] Medina, J., Segundo,R,. Ribeiro, P., Xu, W., Lian, L., Chang, G.W., Dinavahi, V., and N.Watson, N.R., (2013). Harmonic Analysis in Frequency and Time Domain. IEEE Transactions OnPower Delivery, 28,. 3.
[2] Hussein, I., Zynal, A., Yass. (2012).The Effect of Harmonic Distortion on a Three phase Transformer Losses. Canadian Journal on Electrical and Electronics Engineering 3, 5.
[3] Ozerdem, O.C., . Al-Barrawi, A., (1992). Recommended Practices and Requirements for Harmonic Control in Electrical Power Systems. ISSN 2077 519.
[4] Biricik, S.,(1992). Measurement And Comparison Analysis Of Harmonic Losses In Three Phase Transformers. IJTPE Journal. [5] Asaad, A., Elmoudi. (2006). Evaluation Of Power System Harmonic
Effect On Transformers. Hot Spot Calculation and Loss of Life Estimation,TKK Disertations, Helsinki University of Technology. C. Sankaran. Power Quality, CRC Press LLC.