ISSN 1392-2785 ENGINEERING ECONOMICS. 2006. No 1 (46)
WORK HUMANISM
Teamwork Dysfunctions at Large – Scale Enterprises: Comparative Research
Based on Norm-Referenced Testing
Gediminas Merkys
1, Vilma Žydži
ū
nait
ė
1, Gintaras Šaparnis
2,
Daiva Urbonait
ė
-Šlyžiuvien
ė
1, Mykolas Dromantas
31
Kauno technologijos universitetas
K. Donelaičio g. 73, LT-44029, Kaunas
2
Šiaulių universitetas
Architektų g. 1, LT-78366, Šiauliai
3
Lietuvos žemės ūkio universitetas
Studentų g. 11, LT-53361, Akademija, Kauno r.
The paper deals with the data obtained in the
re-search which lasted for a period of 5 years and was
car-ried out by a joint team of researchers. The test „Team
Puls“ developed in Germany for the assessment of
teamwork efficiency was adapted for Lithuanian
pro-duction enterprises and served as the basis for the
re-search. The test consists of 66 questions which reflect
different aspects of teamwork. By the method of factor
analysis primary questions were summarised into 6
scales (dimensions): 1) Orientation to goals and
achievements; 2) Work dedication and responsibility;
3) Communication in the team; 4) Team management;
5) Team organisation; 6) The role and the status of the
team in the organisation.
The paper consists of two parts: Introduction
,
in
which scientific topicality of the study is proved and
theoretical assumptions are reviewed; and Research
methods and results.
Theoretical and empirical studies
on teamwork carried out by Lithuanian and foreign
re-searchers are reviewed in the theoretical part
(Intro-duction) of the paper. Theoretically postulated 6
dimen-sions of the adapted test are shown, proved to be
rea-sonably universal and acknowledged by other authors.
In the second part, Research methods and results, the
structure of the test is substantiated and described and
psychometric measurements and formulations of the test
phases are provided. Norm and target samples, 4
large-scale production companies, where 403 employees
rep-resenting 35 different working teams were tested, are
also described in this part. Brief anonymous company
profiles are provided.
Keywords:
teamwork, norm test, factor analysis, rating
Introduction
Teamwork
in organization is especially urgent in
problem solving and decision – making and in striving
for total quality management. Results of teamwork leave
behind the results of people, who work in individual
manner. Evident are qualities of teamwork: higher quality
work, results with achieved higher standards, more
possi-bilities to open the great apossi-bilities of people, flexibility
and ability to adapt to changes (Jezerskyt
ė
& Žydži
ū
n-ait
ė
, 2005).
Researchers
1analyze differences between team and
group, team dynamics and roles in a team, features of
ef-fective team. Researchers very seldom accentuate the
teamwork limits, which obstruct the striving for high
standards results and effective achievements. There are
very few studies or empirical evidence about
team-working peculiarities and especially – dysfunctions that
are related to enterprise production and engineering, too.
The
novelty
of the study presented in this paper is
re-vealed in the presentation of various types of enterprises
with focus on teamwork and those are empirically
com-pared and illuminated teamwork peculiarities and
dys-functions of teams in various types of large – sized
enter-prises.
Research question:
What are the peculiarities,
positive qualities and dysfunctions of teamwork in
vari-ous types of large – scale enterprises?
Research aim:
To
compare, analyze and generalize the teamwork
peculiari-ties, positive qualities and limits in various types of
en-terprises.
Background
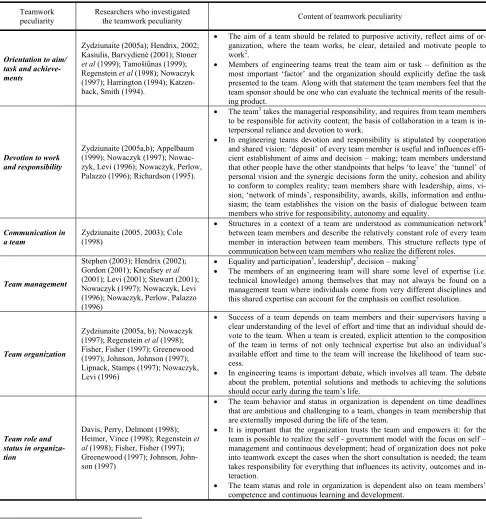
The focus is on six main peculiarities of teamwork
(see Table 1).
Table 1
Teamwork dimensions according to various studies
Teamwork peculiarity
Researchers who investigated
the teamwork peculiarity Content of teamwork peculiarity
Orientation to aim/ task and achieve-ments
Zydziunaite (2005a); Hendrix, 2002; Kasiulis, Barvydienė (2001); Stoner
et al (1999); Tamošiūnas (1999); Regenstein et al (1998); Nowaczyk (1997); Harrington (1994); Katzen-back, Smith (1994).
• The aim of a team should be related to purposive activity, reflect aims of or-ganization, where the team works, be clear, detailed and motivate people to work2.
• Members of engineering teams treat the team aim or task – definition as the most important ‘factor’ and the organization should explicitly define the task presented to the team. Along with that statement the team members feel that the team sponsor should be one who can evaluate the technical merits of the result-ing product.
Devotion to work and responsibility
Zydziunaite (2005a,b); Appelbaum (1999); Nowaczyk (1997); Nowac-zyk, Levi (1996); NowacNowac-zyk, Perlow, Palazzo (1996); Richardson (1995).
• The team3 takes the managerial responsibility, and requires from team members to be responsible for activity content; the basis of collaboration in a team is in-terpersonal reliance and devotion to work.
• In engineering teams devotion and responsibility is stipulated by cooperation and shared vision: ‘deposit’ of every team member is useful and influences effi-cient establishment of aims and decision – making; team members understand that other people have the other standpoints that helps ‘to leave’ the ‘tunnel’ of personal vision and the synergic decisions form the unity, cohesion and ability to conform to complex reality; team members share with leadership, aims, vi-sion, ‘network of minds’, responsibility, awards, skills, information and enthu-siasm; the team establishes the vision on the basis of dialogue between team members who strive for responsibility, autonomy and equality.
Communication in a team
Zydziunaite (2005, 2003); Cole (1998)
• Structures in a context of a team are understood as communication network4 between team members and describe the relatively constant role of every team member in interaction between team members. This structure reflects type of communication between team members who realize the different roles.
Team management
Stephen (2003); Hendrix (2002); Gordon (2001); Kneafsey et al
(2001); Levi (2001); Stewart (2001); Nowaczyk (1997); Nowaczyk, Levi (1996); Nowaczyk, Perlow, Palazzo (1996)
• Equality and participation5, leadership6, decision – making7
• The members of an engineering team will share some level of expertise (i.e. technical knowledge) among themselves that may not always be found on a management team where individuals come from very different disciplines and this shared expertise can account for the emphasis on conflict resolution.
Team organization
Zydziunaite (2005a, b); Nowaczyk (1997); Regenstein et al (1998); Fisher, Fisher (1997); Greenewood (1997); Johnson, Johnson (1997); Lipnack, Stamps (1997); Nowaczyk, Levi (1996)
• Success of a team depends on team members and their supervisors having a clear understanding of the level of effort and time that an individual should de-vote to the team. When a team is created, explicit attention to the composition of the team in terms of not only technical expertise but also an individual’s available effort and time to the team will increase the likelihood of team suc-cess.
• In engineering teams is important debate, which involves all team. The debate about the problem, potential solutions and methods to achieving the solutions should occur early during the team’s life.
Team role and status in organiza-tion
Davis, Perry, Delmont (1998); Heimer, Vince (1998); Regenstein et al (1998); Fisher, Fisher (1997); Greenewood (1997); Johnson, John-son (1997)
• The team behavior and status in organization is dependent on time deadlines that are ambitious and challenging to a team, changes in team membership that are externally imposed during the life of the team.
• It is important that the organization trusts the team and empowers it: for the team is possible to realize the self - government model with the focus on self – management and continuous development; head of organization does not poke into teamwork except the cases when the short consultation is needed; the team takes responsibility for everything that influences its activity, outcomes and in-teraction.
• The team status and role in organization is dependent also on team members’ competence and continuous learning and development.
2 Ignorance of the aim in a team stipulates managerial (e.g., non – efficient / non – effective activity) and psychological (e.g., anxiety, fear) problems. The team members, who treat themselves as a team, should form and accept the general aim / task (related to organizational aims) and identify themselves with it.
3 Team is a system: the team means a ‘derivate’, which consists of the aim and serves the aim, activity and actions, and that excepts the team in environ-ment as a compact and relatively autonomous unit.
4 Types of information interchange includes those aspects (Cole, 1998): a) speed of information diffusion, where an important question is how it is possi-ble to compare the structure of communication networks, according to speed characteristic; b) precision of information rendering with the question – in which type of network is the best precision; c) absorption of information – this aspect is related to information volume and raises the question – in which network the absorption is the highest and lowest.
5 Communication, collaboration and cooperation processes in the team should be based on interpersonal equality principle; power includes listening, trust and sharing; in the team the differences between members are not acceptable thus they should be eliminated after regular diagnostics / evaluations o teamwork and team management.
6 In teams there always exists a non-formal leader, and the functions of the leader are performed by some team members or all the team; the leadership style determines the processuality of teamwork; autocratic leadership style limits the leader’s identification with the team and the democratic style stipu-lates the effective teamwork, when responsibilities of the team leader are delegated to team members.
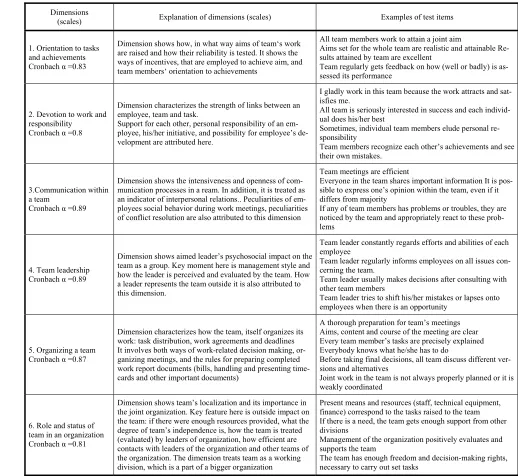
Table 2
Dimensions of teamwork test, their explanation and example of test items
Dimensions
(scales) Explanation of dimensions (scales) Examples of test items
1. Orientation to tasks and achievements Cronbach α =0.83
Dimension shows how, in what way aims of team‘s work are raised and how their reliability is tested. It shows the ways of incentives, that are employed to achieve aim, and team members‘ orientation to achievements
All team members work to attain a joint aim
Aims set for the whole team are realistic and attainable Re-sults attained by team are excellent
Team regularly gets feedback on how (well or badly) is as-sessed its performance
2. Devotion to work and responsibility
Cronbach α =0.8
Dimension characterizes the strength of links between an employee, team and task.
Support for each other, personal responsibility of an em-ployee, his/her initiative, and possibility for employee’s de-velopment are attributed here.
I gladly work in this team because the work attracts and sat-isfies me.
All team is seriously interested in success and each individ-ual does his/her best
Sometimes, individual team members elude personal re-sponsibility
Team members recognize each other’s achievements and see their own mistakes.
3.Communication within a team
Cronbach α =0.89
Dimension shows the intensiveness and openness of com-munication processes in a ream. In addition, it is treated as an indicator of interpersonal relations.. Peculiarities of em-ployees social behavior during work meetings, peculiarities of conflict resolution are also attributed to this dimension
Team meetings are efficient
Everyone in the team shares important information It is pos-sible to express one’s opinion within the team, even if it differs from majority
If any of team members has problems or troubles, they are noticed by the team and appropriately react to these prob-lems
4. Team leadership Cronbach α =0.89
Dimension shows aimed leader’s psychosocial impact on the team as a group. Key moment here is management style and how the leader is perceived and evaluated by the team. How a leader represents the team outside it is also attributed to this dimension.
Team leader constantly regards efforts and abilities of each employee
Team leader regularly informs employees on all issues con-cerning the team.
Team leader usually makes decisions after consulting with other team members
Team leader tries to shift his/her mistakes or lapses onto employees when there is an opportunity
5. Organizing a team Cronbach α =0.87
Dimension characterizes how the team, itself organizes its work: task distribution, work agreements and deadlines It involves both ways of work-related decision making, or-ganizing meetings, and the rules for preparing completed work report documents (bills, handling and presenting time-cards and other important documents)
A thorough preparation for team’s meetings Aims, content and course of the meeting are clear Every team member’s tasks are precisely explained Everybody knows what he/she has to do
Before taking final decisions, all team discuss different ver-sions and alternatives
Joint work in the team is not always properly planned or it is weakly coordinated
6. Role and status of team in an organization Cronbach α =0.81
Dimension shows team’s localization and its importance in the joint organization. Key feature here is outside impact on the team: if there were enough resources provided, what the degree of team’s independence is, how the team is treated (evaluated) by leaders of organization, how efficient are contacts with leaders of the organization and other teams of the organization. The dimension treats team as a working division, which is a part of a bigger organization
Present means and resources (staff, technical equipment, finance) correspond to the tasks raised to the team If there is a need, the team gets enough support from other divisions
Management of the organization positively evaluates and supports the team
The team has enough freedom and decision-making rights, necessary to carry out set tasks
Research methods and results
Research instrument: dimensions, validity and
reliability
The theoretic concept of Team Puls test is based on a
combination of modern Western theories of management,
and the test itself has passed the tests of scientific
re-search both in Germany (the country of its origin) and in
Lithuania (Žydži
ū
nait
ė
, 2005a,b; 2003; Merkys,
Droman-tas, 2004; Wiedemann, Watzdorf, Richter, 2000).
After the linguistic adaptation of the test, more than
2000 employees from 350 teams of various organization
types have been tested (see Table 4). The testing was
conducted anonymously. Typical five-point Likert scale
questions were used. The test provides a possibility to
precisely diagnose and assess the efficiency (or a lack of
it) of most diverse teams. The number of pre-testing
items is 66. The German authors of the test employed a
factor analysis to group them into six qualitative
team-work dimensions (subscales): 1) leading a team,
commu-nication within a team, employee dedication to work,
employee responsibility, etc. (Wiedemann, Watzdorf,
Richter, 2000).
ob-tained from Lithuanian labor organizations are rather
high. The Internal consistence of the test, dimension
characteristics and examples of items are presented in a
table (see Table2).
High indicators of the test Inter-Factor consistence
were obtained not only in the great target sample
(N=2047), but also in the sample of large-sized
manufac-turing organizations (N=403). According to the scales,
values of the following consistency coefficients were
ob-tained (Cronbach
α
1=0.75;
α
2=0.77;
α
3=0.84;
α
4=0.89;
α
5=0.8;
α
6=0.74). Notably, the German test adapted in
Lithuania demonstrates particularly high characteristics
of reliability by applying test – retest method both with
complete and reduced test versions. Every test dimension
of the reduced test included only those items, which met
at least two requirements: 1) they were logically valid in
the context of Lithuanian labor organizations 2) were
characterized by the highest factorial weight and
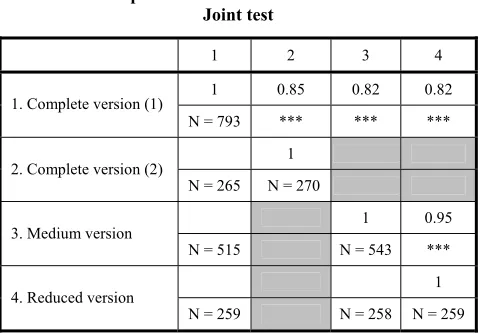
Inter-Factor consistence. Thus, two reduced test versions were
produced from the 66- item teamwork test – a) “Medium
test version“(27 items) and b) “Reduced version“(15
items). Retests, depending on the sample clusters, were
carried out during the interval of four to eight weeks.
Ta-ble 3 reflects repeated measurements correlation results
of the joint sample.
Table 3
Matrix of repeated teamwork tests intercorrelations.
Joint test
1 2 3 4
1 0.85 0.82 0.82 1. Complete version (1)
N = 793 *** *** ***
1 2. Complete version (2)
N = 265 N = 270
1 0.95
3. Medium version
N = 515 N = 543 ***
1 4. Reduced version
N = 259 N = 258 N = 259
Note: *** significance 0.01. Two empty cells in the table mean
the absence of corresponding retest formation.
The adapted teamwork test is highly stable and
reli-able. While reducing the test two or four times, the test
stability remains, correlation coefficients range from 0.82
to 0.95 and can be defined as very high. The volume of
sample clusters, in which correlations were calculated,
was high enough as well - from 259 to 793.
Next to control inner consistency, factor validation
and tests – retest methods, the test in Lithuania was tested
by correlating it with outside criterion, and by applying
qualitative methods (Merkys, Kalinauskait
ė
, Beniušien
ė
,
Weinhardt, Dromantas, 2005; Dromantas, 2002). It was
found out that there is a systematic and significant
corre-lation of the teamwork test with 18 subscales of the
or-ganization climate test. The explained variance of both
tests in a 810 N sample reached about 20% on the
aver-age.
For quantitative study, several small and medium -
sized business enterprises (teams) were selected.
Team-work scores of these enterprises extremely deviated from
the average towards positive and negative scores.
Re-searchers‘ visits and interviews during the test in the
best-performing team revealed exceptional and objective
eco-nomic indicators of this enterprise and a special
competi-tive success.
8A visit to the worst performing company in
terms of teamwork
9, did not reveal the crisis of economic
achievements, but revealed a deep crisis of staff
man-agement, job dissatisfaction and a permanent staff
turn-over (Dromantas, 2002). Valid indicators and tests ability
to forecast econometric indicators of an enterprise were
described by the authors of Team Puls test (Wiedemann,
Watzdorf, Richter, 2000).
Norm-referenced test sample and target
sample of manufacturing enterprises
Test norming
During the five years of testing and verification in a
Lithuanian organization, a significant norm-referenced
test sample was formed. Sample size is 2047 respondents.
In the norm-referenced sample a total test score is
accord-ing to normal distribution. Norm-referenced sample
clus-ters represent 363 teams from 50 different size „mother“
organizations. The sample includes acceptable
proptions of both public and private sector. Within state
or-ganizations, a particular organization type is
repre-sented – statutory organizations (see Table 4).
Rather large normative-referenced sample
deter-mined a very short confidential interval, which on the
standard z-scale of normal distribution is 0.12, when
α
=0.01. The accumulated norm-referenced database
en-ables us to construct “specialized” test norms for
individ-ual organization types, e.g. for statutory organizations,
education and health organizations, banks, municipality
department, etc.
However, the paper focuses on the analysis of larger
manufacturing enterprises teamwork. The term “rather
large manufacturing enterprise” in terms of Lithuania
ac-quires a specific meaning. According to Statistics of
Lithuania
10, as much as 89% of Lithuanian enterprises
employ a staff of about 19. The accumulated rate interval
of 99 employees covers 98.11% of all country‘s
enter-prises. The interval from 500 to 999 employees covers
only 0.12% of all enterprises. Thus, a larger enterprise in
Lithuania is a statistical exclusion.
8 This was a business incubator enterprise founded by a student of radio electronics and his friends. The enterprise designed and installed nonstan-dard security systems in enterprises. The fact, that it started its activities in the business incubator, indirectly indicated that at the beginning it had no working capital event to keep a small office. After two years, the turn-over of the company reached a 2-million Litas turnturn-over. This small enter-prise in an open tender won a huge order from a large local monopolist company.
9 This enterprise also represented the SME sector and business incubator. The enterprise had acquired good equipment to immediately deal with small oil product- related emergencies (e.g. in petrol stations, workshops, etc.) The visit allowed to raise a hypothesis the reason for a deep human resources crisis lies in impossible disposition of the owner and manager, or even most likely a psychic disorder. For a few years in a row, nobody of hired staff stayed for longer than 1-3 months.
An enterprise employing a staff of 100 or more
peo-ple, in terms of Lithuania, can be regarded as relatively
large, when using as a basis not organizational science or
international enterprises classification
11, but
empirically-based statistical trend. According to Statistics of
Lithua-nia, such enterprises comprise 1.9% of all 61035
enter-prises registered in Lithuania.
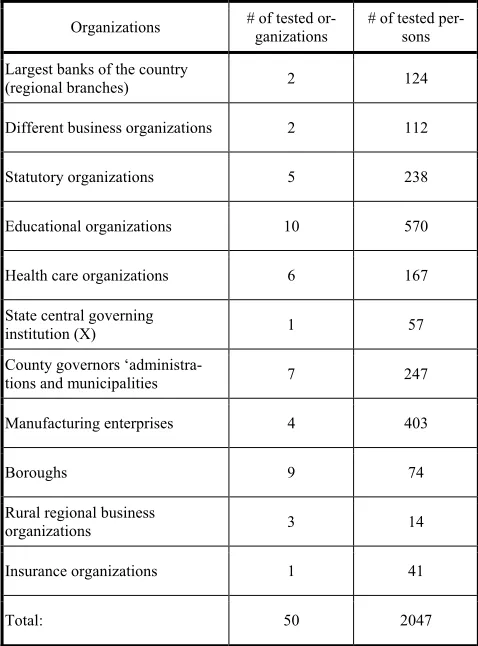
Table 4
Types of organizations tested on teamwork
Organizations # of tested or-ganizations # of tested per-sons
Largest banks of the country
(regional branches) 2 124
Different business organizations 2 112
Statutory organizations 5 238
Educational organizations 10 570
Health care organizations 6 167
State central governing
institution (X) 1 57
County governors
‘administra-tions and municipalities 7 247
Manufacturing enterprises 4 403
Boroughs 9 74
Rural regional business
organizations 3 14
Insurance organizations 1 41
Total: 50 2047
As a research subject three large-size enterprises
were selected from normative-referenced sample. On
Lithuanian scale, these were large-sized manufacturing
enterprises and which had independent manufacturing
facilities. Short profiles of these enterprises are presented
below. They are presented in general features without
mentioning their real names; code names (anonyms) were
used. The researchers undertook to keep the test
anony-mous and not to publish concrete data about the
enter-prises, which could damage their image.
A brief profile of Manufacturing Enterprise (X)
The manufacturing enterprise under the code name
X is a private – capital limited liability company (Ltd.).
The enterprise produces food stuffs and the export share
makes about 80%. High technologies prevail in the
en-terprise, and reorganization and reforms are in full
11 The meaning of terms “small-sized enterprise“, “medium-sized enter-prise or “large-sized enterenter-prise“ is not clearly defined neither in interna-tional nor in nainterna-tional management science. This was well revealed in S. Vaitkevičius PhD dissertation (Vaitkevičius 2005). The definition is most often based on the number of staff and turnover, but it is differently treated in terms of geography and branch.
swing. The organization employs about 600 men and
800 women. The diversity of tested teams (or
depart-ments) was sought on purpose in order to get indirect
information about the organization as a whole. Eight
teams took part in testing. The total number of tested
employees is 62.
A brief profile of Manufacturing Enterprise (Y)
Another large light industry manufacturing enterprise
under the code name (Y) is a stock company, the
activi-ties of which go back to the 1920s. In 1992 it was
privat-ized and reorganprivat-ized into stock company. At present,
lo-cal (Lithuanian) capital is prevailing, and export share
comprises 97%. The organization employs about 500 men
and 300 women, a narrow specialization predominates.
Reorganization and reforms are only being planned. The
changes were limited to replacing managers. Nine teams
took part in testing. The total number of tested employees
is 102.
A brief profile of Manufacturing Enterprise (Q)
Another large light industry manufacturing enterprise
under the code name (Q) is a stock company. It
manufac-tures X-type products and processes raw materials Z.
Al-though the company is classified as a local capital
com-pany, its export share is quite large – about 90%.
Tradi-tional technologies prevail in the enterprise.
Organiza-tional reforms have been started, but not completed: the
director general was replaced twice, as well as the
man-agers of commercial services; the inner structure of the
organization has undergone changes. The number of staff
is about 200. All employees have written job
descrip-tions. No staff management system is introduced in the
company; no staff studies are done; no seminars, staff
trainings on the issues of human resource management
are carried out. 11 teams took part in testing. The total
number of tested employees is 115.
A brief profile of Trade-Production Enterprise (Z)
Next to manufacturing enterprises, one was included into
the target sample. The establishment of this network is
linked to the coming of foreign capital to the Lithuanian
market. At present the enterprise is owned by a 100%
for-eign capital. In this paper, the trade company with a
net-work of outlets all over Lithuania is presented under a
code name Trade-Production Enterprise (Z). Employees
of trade and marketing areas and manufacturing
depart-ments (gastronomy, bakery, and confectionary) form the
foundation of the enterprise. The presence of large
pro-duction departments in particular led to the decision of
the authors to include this enterprise into the target
sam-ple. Seven teams (departments) took part in testing. The
total number of tested employees is 124.
Results
experience (GWE) ranged from one to 42 years, and the
standard deviation was 10 years (BDSmin=1; GWEmax=42;
GWEMean=16; GWESD=10.4).
Equivalent parameters of work experience in present
organization (SO) of the sample are the following:
(EPO-min
=1; EPO
max=35; EPO
Mean=6; EPO
SD=6.4). As one can
see from the data, the research sample represents both
very young (beginners) and mature (experienced)
em-ployees, also represented are those working for the
or-ganizations for a very long time and newcomers, who
hardly settled down. What is favourable for the sampling
is that there are 12% (N=47) team leaders, who allow us
to treat this subset as a separate statistical cluster, and to
compare the attitudes of managers and members towards
the functionality of teamwork. Gender-wise division is
also realistic – women make up 57%. The fact that
women outnumber men in the staff structure reflects the
trends prevailing in light industry.
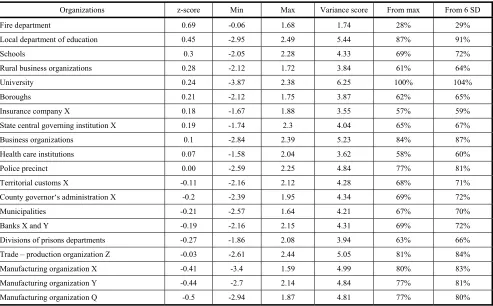
Table 5 presents ratings of all types of studied
or-ganizations in terms of teamwork efficiency. The same
information is presented in Figure 1. The dotted lines
mark the limits of confidence interval, when
α
=0.01. At
the top of ratings is the organization (or organizations)
that have the most effective teamwork performance. The
rating was constructed on the basis of standard normal
distribution z-values, when the scale mean is =0, and a
standard deviation is =1; z value is obtained calculating a
mean of all six-test dimensions values, i.e. by calculating
a mean of all 66 values of the primary test items. It is
im-portant to regard not only the mean, which equalizes the
statistical exclusion, but also variance. In the table, next
to z-value, a minimal and maximal feature value found in
relevant sample cluster, as well as the variation scope.
Next, two homogeneity indexes of attitudes on teamwork
in a particular organization are derived. They are
ex-pressed in percent. The first homogeneity index was
cal-culated from the highest precedent of present variation
scope. The highest variation scope was found in
individ-ual university departments (6.25 points on the z-scale)
and this value was equivalent to 100%. Another
homoge-neity index was calculated from 6 standard deviations,
based on a three-sigma rule, which obtains in case of
regular distribution. Here we have in mind the fact that
interval Mean±3SD gets about 99% of all possible
obser-vations. As one can see, the most scattered (or least
ho-mogeneous) is the attitude towards teamwork in an
or-ganization like university. Although university is at the
top of the rating, there was one faculty whose values
dropped below norm-referenced mean by 4 (3.87)
stan-dard deviations, which shows statistical exclusion. The
least scattered attitude on teamwork was found in fire
de-partment; in addition, this organization takes the first and
the highest place of the rating. Such have evaluations
probably result from the work specifics in this
organiza-tion. Extreme work conditions of firefighters determine
that those who are unable to adjust to high requirements
and accordant, joint work in a team are soon identified
and eliminated. It is symptomatic that the fire department
values significantly deviate from the value of statutory
organizations branch. As the values of other statutory
or-ganizations such as police precinct, territorial customs
and prisons department are less impressive. Thus, it is not
always correct to speak about the organizational branch
effect.
Table 5
Organizational rating
Organizations z-score Min Max Variance score From max From 6 SD
Fire department 0.69 -0.06 1.68 1.74 28% 29%
Local department of education 0.45 -2.95 2.49 5.44 87% 91%
Schools 0.3 -2.05 2.28 4.33 69% 72%
Rural business organizations 0.28 -2.12 1.72 3.84 61% 64%
University 0.24 -3.87 2.38 6.25 100% 104%
Boroughs 0.21 -2.12 1.75 3.87 62% 65%
Insurance company X 0.18 -1.67 1.88 3.55 57% 59%
State central governing institution X 0.19 -1.74 2.3 4.04 65% 67% Business organizations 0.1 -2.84 2.39 5.23 84% 87%
Health care institutions 0.07 -1.58 2.04 3.62 58% 60%
Police precinct 0.00 -2.59 2.25 4.84 77% 81%
Territorial customs X -0.11 -2.16 2.12 4.28 68% 71% County governor‘s administration X -0.2 -2.39 1.95 4.34 69% 72%
Municipalities -0.21 -2.57 1.64 4.21 67% 70%
Banks X and Y -0.19 -2.16 2.15 4.31 69% 72%
Divisions of prisons departments -0.27 -1.86 2.08 3.94 63% 66% Trade – production organization Z -0.03 -2.61 2.44 5.05 81% 84%
-0.6 -0.4 -0.2 0 0.2 0.4 0.6 0.8 Manufacturing organization Q
Manufacturing organization Y Manufacturing organization X Divisions of prisons departments Municipalities County governor‘s administration X Banks X ir Y Territorial customs X Trade – production organization Z Police precinct Health care institutions Business organizations Insurance company X State central governing institution X Boroughs University Rural business organizations Schools Local department of education Fire department
Figure 1.
Organizational ratings according to teamwork efficiency
Teamwork may be significantly different within the
de-partment of a single organization. Thus, the approach taken
by the authors that, while interpreting the values of
team-work test, to rely not only on the mean but also on the
pa-rameters of feature dispersion, was justified.
However, it is very symptomatic, that in the whole
normative sample, the last positions were unanimously
taken by three large-sized manufacturing organizations,
mentioned before. Their values significantly go beyond
the limits of reliable range and drop below normative
sample mean by approximately a half of standard
devia-tion. The values of manufacturing organizations differ
from those of the leading one, fire department, by more
than one standard deviation. The norm-referenced scale
also included large-sized organizations of other type.
E.g., large regional branches of the two biggest banks,
or a regional department of a large insurance company.
It has to be noted, that the rest of other business
enter-prises in the normative sample cannot be considered as
large-sized ones. These are rural tourism business
or-ganizations and SME-type oror-ganizations, including the
business incubator ones. The range of their activities is
very wide: services, small trade and manufacturing. In
any case, we are speaking here about very small
enter-prises, the larger part of which is working for the local
market and have a status of a sole entrepreneur, or Ltd.
It is symptomatic the values of large-sized
non-production business organizations and SMEs are more
favorable, and they are above the normative mean and
go beyond the upper limit of the reliable range. It is
worth mentioning that, the values of shopping centre
network, mentioned above, are closer to the mean of
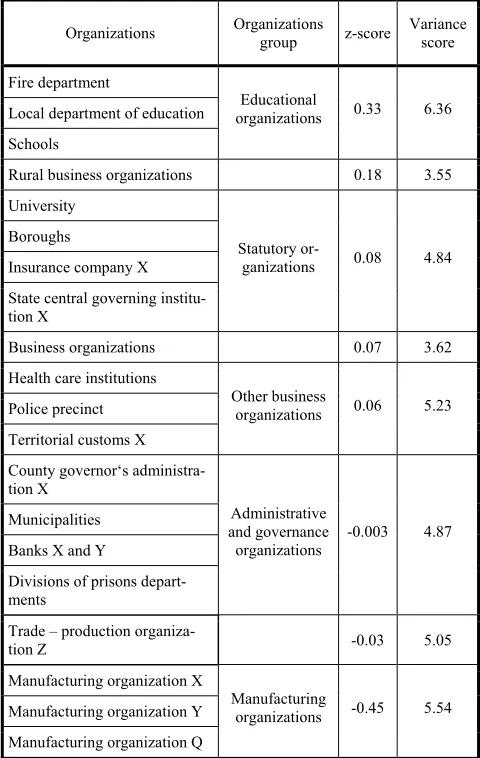
norm-referenced sample. Table 6 presents a generalized
rating of teamwork according to organization types
(branches, areas of activity). Educational organizations
and an insurance company are in the leading positions.
Table 6
Teamwork ratings according to organization types
Organizations Organizations group z-score Variance score
Fire department
Local department of education
Schools
Educational
organizations 0.33 6.36
Rural business organizations 0.18 3.55
University
Boroughs
Insurance company X
State central governing institu-tion X
Statutory
or-ganizations 0.08 4.84
Business organizations 0.07 3.62
Health care institutions
Police precinct
Territorial customs X
Other business
organizations 0.06 5.23
County governor‘s administra-tion X
Municipalities
Banks X and Y
Divisions of prisons depart-ments
Administrative and governance
organizations
-0.003 4.87
Trade – production
organiza-tion Z -0.03 5.05
Manufacturing organization X
Manufacturing organization Y
Manufacturing organization Q
Manufacturing
Figure 2.
MDS models, A (above) and B (below) versions with complete and reduced structure of features.
(Abbreviations are explained in Table 7)
Into the middle position fall statutory, health care,
administration and governance organizations, trade
net-work and SME organizations. The cluster of large-sized
manufacturing enterprises takes the lowest rating
posi-tion of all.
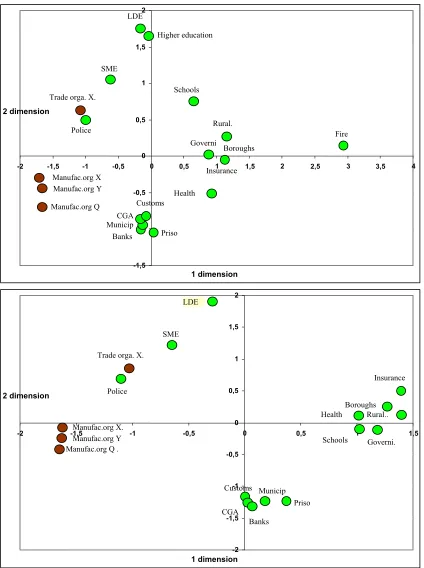
It was decided not to limit the study to the measures
of descriptive statistics only, and to conduct a study
em-ploying a multidimensional method, MDS
(Multidimen-sional scaling) model in particular. The model included
two dimensions – z-value and variation scope. Thus, the
model regarded two things: 1) efficiency of teamwork
and 2) homogeneity of attitude on the before mentioned
parameter in the organization.
Distances were calculated from the data matrix, the
selected unit of measure – Euclides distance. The result
was calculated in two versions: A) by including into the
model all types of organizations; B) by eliminating from
the model those types of organizations, which tend to be
1,5 -1,5
-1 -0,5 0 0,5 1 1,5 2
-2 -1,5 -1 -0,5 0 0,5 1 1,5 2 2,5 3 3,5 4
1 dimension 2 dimension
CGA
Insurance
Municip
Priso Trade orga. X.
Manufac.org X
Governi Rural.
Banks LDE
Health
Fire
Manufac.org Y
Manufac.org Q Customs
Boroughs Schools
Higher education
SME
Police
-2 -1,5 -1 -0,5 0 0,5 1 1,5 2
-2 -1,5 -1 -0,5 0 0,5 1
1 dimension 2 dimension
Insurance
Municip Priso Trade orga. X.
Manufac.org X.
Governi. Rural.. LDE
Health
Manufac.org Y Manufac.org Q .
Customs
Boroughs
Schools SME
Police
statistical exclusions. Specifically, fire department and
university were excluded from the model. The
MDS-modeling results are presented in Figure 2.
In both cases, a very similar “map“ of organizations
was obtained, the difference is only in the scale, on axis X
(first dimension). It is common knowledge, that MDS
model is an exploratory method, and the result of it is
ac-ceptable when it can be meaningfully interpreted. The first
dimension (axis X) may be relatively defined as a
dimen-sion of teamwork success, where on the left-hand side of
the map accumulate organizations and their types that are
characterized by poor teamwork. The right-hand side is
taken by organizations characterized by excellent
team-work. The upper part of the map concentrates
organiza-tions and their types that are characterized by
heterogene-ous evaluation of teamwork, and the bottom part
concen-trates organizations whose evaluation of teamwork
effi-ciency is relatively less scattered and is homogeneous.
Therefore, the second dimension (axis Y) signifies the
ho-mogeneity of attitudes on teamwork. It is symptomatic,
that in both SMS-modeling cases large-sized
manufactur-ing organizations form a smanufactur-ingle cluster of organizations
that failed in teamwork efficiency. Point values of these
organizations concur, they get into one cluster that take
marginal positions on the left-hand side of the map
(ac-cording to success-failure dimension) and middle position
on axis Y (dimension of attitudes homogeneity).
Table 7
Abbreviations used in MDS models
Manufacturing org Q Manufacturing organization Q Manufacturing org Y Manufacturing organization Y Manufacturing org X Manufacturing organization X
Police Police precinct
Trade org X Trade – production organization Z SME Small and medium enterprises LDE Local department of education CGA County governor‘s administration X Banks Banks X and Y
Customs Territorial customs X
Municip. Municipalities
Prison Prison department divisions Insurances Insurance company X
Health Health care institutions
Rural Rural business
Boroughs Boroughs Governing State central governing institution X Schools Schools
Summing up and discussion
The study highlighted that large-sized manufacturing
enterprises take the last position among different
organi-zations in the rating of such important human resources
dimension like teamwork. This allows concluding (at
least on grounded hypothesis) that teamwork in larger
manufacturing enterprises is relatively in a state of
ne-glect and of little efficiency. Certainly, this conclusion
should be strengthened in the future by additional
re-search, by including into the norm-referenced database
more large-sized enterprises, their number should not be
limited to three or four, but expanded to a minimal
statis-tical cluster of 25 enterprises. It is important, because
when diagnosing the functionality of human resources in
an organization, the unit of statistical observation is not
the only single score of tested persons, but the
tion itself, to be precise – aggregated values of
organiza-tion which are calculated by summing up the values of
single individuals. When the sample of organizations is
small, generalizations in terms of branch are partly risky,
even when the sample of individuals is relatively large.
Thus, the authors admit that the consistent pattern
identi-fied in the study is a scientific hypothesis that demands
further grounding and additional arguments for proof.
However, one should consider other circumstances,
which strengthen the validity of the raised hypothesis.
Firstly, the gauged scientific fact and obtained by a
reli-able and valid test. In terms of contents, the test is
com-plex and universal – 66 primary items are summed up in
six dimensions.
Next, while interpreting data, it worthwhile to
con-sider a rather large testing data rating base. Here, it is
meaningful to highlight two aspects: a) a large sample
which enables us to test very precisely; b) typological
va-riety of compared and rated organizations.
Joint teamwork is a very important indicator of
effi-cient human resources management in an organization. It
systemically correlates with other essential parameters,
such as organization climate, work motivation, work
stress, etc. It is meaningful in the context of this fact to
pose a research question, that probably other human
re-sources parameters in the large-sized organizations of this
country are relatively neglected. The relevant hypothesis
is supported by the fact that in a study conducted on
or-ganization climate; large-sized oror-ganizations were also
positioned at the bottom of the rating (Merkys,
Ka-linauskait
ė
, Beniušien
ė
, Weinhardt, Dromantas, 2005).
While interpreting the research data, one has to admit
that the employed test is rather eloquent, and in the future
it is useful to expand some of the obtained data by
quali-tative research. The employed test allows to: a)
accu-rately identify and evaluate general teamwork efficiency
(or its deficiency); b) determine, on which dimensions
and single features teamwork is efficient or less efficient.
However, the employed test tells us little in terms of an
attitude when we speak about the main reasons of
effi-cient (or poor) teamwork. An unexploited possibility for
further research (the qualitative one in particular) lies
here. The productivity of such research is revealed by
other studies, in which Team Puls test was combined with
qualitative methods. In this respect, it is worth
mention-ing studies carried out with the population of Lithuanian
nurses (Žydži
ū
nait
ė
, 2005a, b; 2004; 2003).
References
1. Appelbaum, S. Downsizing and the emergence of self – managed teams / S. Appelbaum, M. Bethune, R. Tannenbaum // International Journal of Participation & Empowerment, 1999, 5, 7, p. 109–130. 2. Barlow, A. Value cards: creating a culture for team effectiveness. San
Diego, CA: Pfeiffer & Pfeiffer, 1994.
4. Brewer, N. Supervisory behaviour and team performance amongst police patrol sergeants / N. Brewer, C. Wilson, K. Beck // Journal of Occupational and Organizational Psychology, 1994, 67, p. 69–70. 5. Cole, G. Organizational behaviour. London: Lets Educational, 1998. 6. Davis, P. Evolution of Team-Based Graduate Education Through a
Survey of Prospective Employers / P. Davis, J. Perry, T. J. Delmont// Electronic Journal on Excellence in College Teaching, 1998, 9, 1, p. 105-119.
7. Dromantas, M. Komandinis darbas kaip diagnostikos ir pokyčių or-ganizacijoje objektas: smulkaus ir vidutinio verslo įmonių specifika. Magistro darbas. Kaunas: Kauno technologijos universitetas, 2002. 8. Dubrin, A. Leadership. Research Findings, Practice, and Skills.
Bos-ton: Houghton Mifflin Company, 1995.
9. Fisher, K. The Distributed Mind: Achieving High Performance Through the Collective Intelligence of Knowledge Work Teams / K. Fisher, M. Fisher. New York: McGraw – Hill, Inc., 1997.
10. Gordon, J. Organizational behaviour. A diagnostic approach. (5th ed.) Prentice Hall International Edition, 2001.
11. Greenewood, A. Leadership for change. Nursing Standard 1997, 11, 19, p. 22–23.
12. Harrington, H. Of tails and teams: a fable for children and ceo’s. Milwoukee, WI: ASQC Quality Press, 1994.
13. Heimer, C. Sustainable learning and change in international teams: from imperceptible behaviour to rigorous practice / C. Heimer, R. Vince // Leadership & Organization Development Journal, 1998, 2, 19, p. 83–88.
14. Hendrix, G. The importance of goals to the Success of Work Teams/ CSWR Papers. Centre for the Study of Work Teams. University of North Texas, 2002. Prieiga per internetą:
15. <http://www.workteams.unt.edu/reports/ghedrix.htm>
16. Hirschorn, L. Managing in the new team environment. Reading, MA: Addison–Wesley, 1991.
17. Jezerskytė, E. Comparing Teamwork Competencies of The School Administration and Educators: The Aspects of Groupthink (Avoid-ance) and Social Loafing / E. Jezerskytė, V. Žydžiūnaitė // Socialiniai mokslai, 2005, 3 (49), p. 87 – 95.
18. Johnson, D. Learning to lead teams: developing leadership skills / D. Johnson, R. Johnson. Edina, MN: Interaction Book Company, 1997. 19. Kasiulis, J. Vadovavimo psichologija / J. Kasiulis, V. Barvydienė.
Kaunas: Technologija, 2001.
20. Katzenback, J. The wisdom of teams / J. Katzenback, D. Smith. New York: Harper Business, 1994.
21. Kneafsey, A. Exploring the role and contribution of the nurse in the multiprofessional rehabilitation team / A. Kneafsey, J. Ryan, J. Berry. Research Highlights, 2001, 45, p. 1–6.
22. Levi, D. Group dynamics for teams. Thousand Oaks: Sage, 2001. 23. Lipnack, J. Virtual Teams: Reaching Across Space, Time and
Organi-zations with Technology / J. Lipnack, J. Stamps. John Willey & Sons, 1997.
24. Margerison, Ch., McCann. Team Management. USA: Mercury, 1990. 25. Merkys, G. Organisational climate test for Lithuania work organisa-tions: validation and correlation with teamwork test / G. Merkys, R. Ka-linauskaitė, I. Beniušienė, J. Weinhardt, M. Dromantas // Socialiniai mokslai. Kauno technologijos universitetas, 2005, 3(49), p. 39–51. 26. Merkys, G. Komandinio darbo diagnostikos naudojant „Team Puls“
testą galimybės smulkiojo ir vidutinio verslo organizacijose / G. Merkys, M. Dromantas // Viešoji politika ir administravimas, 2004, 8, p. 89–99.
27. Nolan, M. Preparation for multi – professional / multiagency health care practice. The nursing contribution to rehabilitation within the multi – disciplinary team: literature review and curriculum analysis / M. Nolan, A. Booth, J. Nolan, H. Mason. Research Highlights, 1997, 28, p. 1–6.
28. Nowaczyk, R. Perceptions of Engineering Team at NASA (LaRC): Findings from a Survey of Engineers and Scientists. ICASE, 1997. Prieiga per internetą:
29. <http://www.icase.edu/newresearch/teamwork/factors1.html>; <http://www.icase.edu/newresearch/teamwork/factors2.html>; <http://www.icase.edu/newresearch/teamwork/factors3.html>;
<http://www.icase.edu/newresearch/teamwork/factors4.html>; <http://www.icase.edu/newresearch/teamwork/factors5.html>; <http://www.icase.edu/newresearch/teamwork/ronpage.html>. 30. Nowaczyk, R. Two approaches to teaching team skills to engineering
and science students / R. Nowaczyk, D. Levi. Proceedings of 6th AIAA/AFOSR/NASA/ISSMO Symposium on Multidisciplinary Analysis and Optimization, 1996.
31. Nowaczyk, R. An examination of personality traits and engineering / science student team performance / R. Nowaczyk, R. Perlow, M. Pa-lazzo. Proceedings of 6th AIAA/AFOSR/NASA/ISSMO Symposium on Multidisciplinary Analysis and Optimization, 1996.
32. Parker, G. Cross-functional teams tool kit. San Francisco, CA: Jossey-Bass, 1997.
33. Parker, G. Team players and teamwork. San Francisco, CA: Jossey-Bass, 1996.
34. Regenstein, M. Geriatric Teams in Managed Care Organizations. A promising Strategy for costs and outcomes / M. Regenstein, J. Meyer, N. Bagby. Washington, DC: Economic and Social Research Institute, 1998.
35. Richardson, S. Classic Blunders in Re – Design: 14 ways to turn your organization into a mess/CSWR Papers. Center for the Study of Work Teams. University of North Texas, 1995. Prieiga per internetą: 36. <http://www/workteams.unt.edu/newsletter/Archive/v5-2.html> 37. Smith, K. Cooperativce Learning: effective Teamwork for
Engineer-ing Classrooms, 1995. Prieiga per internetą:
38. <http://fie.engrng.pitt.edu/fie95/2b5/2b54/2b54.htm> [1995] 39. Stephen, R. Organizacinės elgsenos pagrindai. Kaunas: Poligrafija ir
informatika, 2003.
40. Stewart, J. Managing Change Through Training and Development (2nd ed). London, Stirling (USA): Kogan Page, 2001.
41. Stoner, J. Vadyba / J. Stoner, R. Freeman, D. Gilbert. Kaunas: Poli-grafija ir informatika, 1999.
42. Tamošiūnas, T. Projektų metodas ugdymo praktikoje. Šiauliai: Ši-aulių universitetas, 1999.
43. Vaitkevičiūtė, V. Tarptautinių žodžių žodynas. Vilnius: Žodynas, 2001. 44. Vaitkevičius, S. Strateginės analizės instrumentų taikymo ypatumai
smulkiajame ir vidutiniame versle. Nepublikuotas daktaro disertaci-jos rankraštis. Kaunas: Kauno technologidisertaci-jos universitetas, 2005. 45. Vijeikienė, B. Komandinio darbo pagrindai / B. Vijeikienė, J.
Vi-jeikis. Vilnius: Rosma, 2000.
46. Wiedemann, J. Team Puls – internetgestuezte teamdiagnose / J. Wiedemann, E. Watzdorf, P. Richter, Technische Universitaet Dres-den, Institut fuer Arbeits, – Organisations, und Sozialpsychologie. Methodensammlung, Band 15, 2000.
47. Žydžiūnaitė, V. Komandinio darbo kompetencijos ir jų tyrimo me-todologija. Monografija. Kaunas: Judex, 2005a, 400 p.
48. Žydžiūnaitė, V. The substantiation of a junction between teamwork competences and professional competence. In Learning and devel-opment for innovation, networking and cohesion / G.-B.Reinert, P. Jucevičienė, G. Merkys. (Eds.). Frankfurt am Main, Germany: Peter Lang, Europäischer Verlag der Wissenschaften, 2005b, p. 255 – 270. 49. Žydžiūnaitė, V. Evaluative content analysis of the curriculum of vo-cational education with the view to the development of teamwork competencies. EDUCATION-LINE. [British Education Index – BEI. Serial Online], 2004, p 1 – 12. Prieiga per internetą:
50. <http://www.leeds.ac.uk/educol/documents/00003651.htm> 51. Žydžiūnaitė V. Refleksija apie atotrūkį tarp aukštųjų studijų ir
prak-tikos: slaugytojų kompetencijų realizavimo trukdžiai // Socialiniai mokslai, 2003, 5 (42), p. 78–89.
Gediminas Merkys, Vilma Žydžiūnaitė, Gintaras Šaparnis, Daiva Urbonaitė-Šlyžiuvienė, Mykolas Dromantas
Komandinio darbo disfunkcijos stambiose gamybos įmonėse: tyrimo, paremto norminiu testavimu, duomenys
Santrauka
sukur-tas komandinio darbo tessukur-tas „Team Puls“. Jis tessukur-tas susideda iš 66 pa-vienių klausimų, kurie atspindi labai įvairius komandinio darbo raiškos aspektus. Faktorinės analizės būdu pirminiai klausimai apibendrinti į
šešias skales (dimensijas): 1) „Orientacija į tikslą ir pasiekimus“; 2) „Atsidavimas darbui ir atsakomybė“; 3) „Komunikacija komandoje“; 4) „Vadovavimas komandai“; 5) „Komandos organizavimas“; 6) „Ko-mandos vaidmuo ir statusas organizacijoje“. Testo adaptacija Lietuvoje pavyko. Pirma, analogiškai atsikartojo visos šešios dimensijos. Antra, sudarytų skalių psichometrinė kokybė labai aukšta ir yra ne prastesnė
už analogiškas charakteristikas Vokietijoje. Sudarytų 6 skalių vidinės darnos koeficientas Cronbach-alfa Lietuvos imtyje svyravo nuo 0,80 iki 0,89. Trečia, Lietuvos imtyje testas demonstruoja labai gerą matavimų
patikimumą, kuris buvo patikrintas retesto (pakartotinių matavimų) metodu. Atitinkamas koeficientas svyravo nuo 0,85 iki 0,95. Sutrumpi-nus testą 2 – 4 kartus, jo patikimumas nesumažėja.
Per 5 testo išbandymo metus sukaupta didelė ir įvairi testo norma-vimo bazė. Joje apibendrinti 2047 darbuotojųįverčiai. Testuotų darbo organizacijų pobūdis labai įvairus. Tai 1) viešojo sektoriaus organizaci-jos (švietimo, sveikatos, vietos savivaldos ir centrinio valdymo organi-zacijos); 2) statutinės organizacijos (policija, muitinė, kalėjimų depar-tamentas, priešgaisrinė ir gelbėjimo tarnyba); 3) verslo organizacijos: draudimo kompanijos, bankai, stambios gamybinės įmonės, SVV į mo-nės. Didelė normavimo imtis lėmė gerą matavimų tikslumą. Apie tai liudija palyginti nedidelis normavimo vidurkio pasikliaujamojo interva-lo ilgis, kuris standartizuoto normaliojo skirstinio z-skalėje tesiekia 0,12 punkto, netgi tuo atveju, kai pasirinktas gana griežtas statistinio reikšmingumo lygmuo α=0,01. Antrinė visų šešių testo skalių faktori-zacija Lietuvos imtyje sudaro vieną faktorių, ir tai parodo, jog tikslinga skaičiuoti ir interpretuoti jungtinį testo balą, agreguojamą iš 66 pavie-niųįverčių. Tai atveria galimybę komandinio darbo raišką vertinti api-bendrintai ir visybiškai.
Straipsnis susideda iš dviejų dalių, „Įvado“, dalies, kurioje pagrį s-tas tyrimo mokslinis problemiškumas ir apžvelgti tyrimo teoriniai pa-grindai, ir „Tyrimo metodikos ir rezultatų“ dalies. Straipsnio teorinėje dalyje (įvade) apžvelgtos šalies ir užsienio autorių atliktos teorinės ir empirinės studijos apie komandinį darbą. Parodoma ir pabrėžiama, kad adaptuojamo testo teoriškai postuluojamos šešios dimensijos yra ganė -tinai universalios ir pripažintos kitų autorių. Tyrimo metodikos ir rezul-tatų dalyje pagrįsta ir aprašyta testo struktūra, pateikti jo psichometri-niai matai, testo žingsnių formuluočių pavyzdžiai. Šioje dalyje apibū -dinta ir testo normavimo imtis, ir tikslinė tyrimo imtis – keturios stam-bios gamybinės įmonės, – kuriose buvo testuoti 403 darbuotojai, atsto-vaujantys 35 skirtingoms darbinėms komandoms. Išsaugant organizaci-jos anonimiškumą, pateikta trumpa atitinkamųįmonių charakteristika.
„Gamybos įmonės (X)“ trumpa charakteristika. Gamybos įmonėje, kuri straipsnyje koduojama indeksu X ir turi uždaros akcinės bendrovės (UAB) statusą, vyrauja privatus kapitalas. Įmonė gamina maisto pro-duktus, o jos eksporto dalis sudaro apie 80 proc. Organizacijoje vyrauja aukšto lygio technologijos, o reorganizacijos ir reformos jau įsibėgė ju-sios. Organizacijoje dirba apie 600 vyrų ir 800 moterų. Testuojamų
komandų (arba padalinių) tipų įvairovės buvo siekiama sąmoningai, kad būtų galima netiesiogiai spręsti apie organizaciją kaip apie visumą. Testavimo tyrime dalyvavo 8 komandos. Bendras testuotų darbuotojų
skaičius yra 62.
„Gamybos įmonės (Y)“ trumpa charakteristika. Kita stambi leng-vosios pramonės gamybos įmonė, kuri straipsnyje koduojama (Y) ir pagal tipą priskiriama prie akcinių bendrovių (AB), savo veiklą vykdo nuo tarpukario laikų. 1992 metais buvo privatizuota ir reorganizuota į
AB. Dabartiniu metu įmonėje vyrauja vietinis (lietuviškas) kapitalas, o eksporto dalis sudaro apie 97 proc. Organizacijoje dirba apie 500 vyrų
ir per 300 moterų, vyrauja siaura specializacija. Reorganizacija ir re-formos kol kas dar tik planuojamos. Kol kas apsiribota tik tokiais
poky-čiais kaip vadovų keitimas. Šioje įmonėje buvo testuotos 9 darbinės komandos. Iš viso testuotų darbuotojų yra 102.
„Gamybos įmonės (Q)“ trumpa charakteristika. Dar viena stambi gamybos įmonė, kuri straipsnyje koduojama slapyvardžiu (Q), turi ak-cinės bendrovės (AB) statusą, o joje gaminami X tipo lengvosios
pra-monės dirbiniai bei apdirbama Z pirminė žaliava. Nors įmonė priski-riama prie vietinio kapitalo organizacijų, jos eksporto dalis gana didelė
– apie 90 proc. Įmonėje vyrauja tradicinės technologijos. Organizacinės reformos jau pradėtos, bet nebaigtos: net du kartus keitėsi gen. direkto-rius, komercinių tarnybų vadovai, buvo keičiama vidinė organizacijos struktūra. Įmonėje dirba apie 200 darbuotojų. Visi jie turi rašytinius pareigybės aprašymus. Pažymėtina, kad organizacijoje nėra įdiegta pe-rsonalo valdymo sistema; neatliekami pepe-rsonalo tyrimai; seminarai, personalo mokymai žmogiškųjų išteklių valdymo klausimais taip pat nevykdomi. Aptariamoje įmonėje testuota 11 darbinių komandų (pada-linių), o iš viso testuotų darbuotojų yra 115.
„Prekybos-gamybos įmonės (Z)“ trumpa charakteristika. Greta minėtų gamybos įmonių, į tyrimo tikslinę imtį buvo įtrauktas ir vienas prekybos tinklas. Tinklo įkūrimas sietinas su užsieninio kapitalo atė ji-mu į lietuvišką rinką, ir dabar visas įmonės kapitalas priklauso užsienio investuotojams. Straipsnio kontekste prekybos tinklas, turintis savo taškus visoje šalies teritorijoje, sąlygiškai pavadinamas „Prekybos-gamybos įmone (Z)“. Įmonės pagrindą sudaro prekybos ir marketingo sferos darbuotojai bei gamybos cechai (kulinarija, kepykla, konditerija). Būtent nemaži gamybiniai cechai organizacijos struktūroje ir lėmė au-torių apsisprendimą ir šiąįmonęįtraukti į tikslinę tyrimo imtį. Aptaria-moje įmonėje buvo testuotos 7 darbinės komandos (padaliniai), o iš viso testuotų darbuotojų yra 124.
Toliau rezultatų dalyje pristatytas įvairaus tipo organizacijų reitin-gas pagal komandinio darbo funkcionalumą. Reitingas sudarytas naudo-jant standartinio normaliojo skirstinio z skalę. Gauti reitingo duomenys rodo, kad stambios gamybinės įmonės sistemingai atsiduria normavimo reitingo apačioje. Nuo normavimo vidurkio gamybinių organizacijų įverčiai nukrypsta į neigiamų vertinimų sritį bemaž per pusę standarti-nio nuokrypio, o nuo geriausių pasiekimų organizacijų gamybos įmonių įverčiai nukrypsta bemaž per vieną standartinį nuokrypį. Tai reiškia, kad stambioms gamybinėms įmonėms būdingas palyginti prasčiau iš-plėtotas ir mažiau veiksmingas komandinis darbas nei kitokio tipo or-ganizacijoms. Pažymėtina, kad panašus dėsningumas nustatytas ir ki-tame tyrime, kuriame buvo diagnozuojamas organizacinis klimatas. Tai leidžia kelti šią hipotezę: visai tikėtina, jog stambioms gamybinėms
įmonėms apskritai sunkiau sekasi plėtoti žmoniškuosius išteklius nei tai pavyksta padaryti kitokio tipo organizacijoms. Esama nemažai skirtingo tipo verslo organizacijų, kuriose komandinis darbas, pasak testavimo duomenų, plėtojamas žymiai efektyviau nei stambiose gamybinėse
įmonėse. Čia paminėtinos tokios taip pat stambios organizacijos kaip draudimo kompanija, bankai. Minėtinos ir kaimo verslo bei SVV į mo-nės, kurių komandinio darbo pasiekimai irgi gerokai aukštesni nei stambokų gamybiniųįmonių.
Tyrimo metu konstatuota, kad tos pačios organizacijos komandose (padaliniuose) testuojamas įvertis labai kontrastingai skiriasi. Didžiau-sias pasitaikęs skirtumų precedentas tarp organizacijos padalinių siekė
6,36 z-skalės punktus. Akivaizdu, jog ganėtinai problemiška yra reitin-guoti ir klasifikuoti organizacijas vien tik pagal testo įverčio vidurkį. Išsamiau pagrįstai nagrinėjamų organizacijų klasifikacijai pagal ko-mandinio darbo raišką atlikti pasirinktas MDS (multidimensional sca-ling) metodas. Klasifikuota pagal dvi dimensijas – vidurkį ir požymio sklaidą (vertinimo homogeniškumą). Sklaidos matu pasirinkta variaci-jos apimtis. Abu į modelįįtraukti dydžiai išmatuoti standartinio norma-liojo skirstinio z įverčiais. Distancijos tarp organizacijų įverčių buvo išskaičiuotos iš duomenų matricos, pasirinktas distancijos matas – Euk-lido atstumas. MDS modelis buvo sudarytas keliais variantais: a) į trau-kiant visus normavimo imtyje buvusius organizacijų tipus; b) atmetus organizacijų tipus, kuriųįverčiai sudaro statistines išskirtis. Abiem at-vejais apie stambias gamybines organizacijas gauta vienoda išvada. Didelėse gamybinėse organizacijose komandinis darbo veiksmingumas vertinamas prastai, o išsakoma nuomonė nėra vienalytė. Komandinio darbo ir kitų žmoniškųjų išteklių parametrų raiška stambiose gamybinė -se įmonėse ateityje reikalauja išsamesnių tyrimų.
Raktažodžiai: komandinis darbas, norminis testavimas, faktorinė analizė, reitingas.