Process of the Implementation of
Knowledge Triangle
in Estonia
Aksel Kirch
Tallinn University of Technology, School of Economics and Business Administration Department of International Relations
Akadeemia tee 3, EE-12618, Tallinn, Estonia e-mail: [email protected]
The aim of the article is to highlight a recent development related to the knowledge triangle concept and the effectiveness of actors in education, research, and innovation concerning the Estonian situation of financial and economic crisis. The author of the article analyses the implementation of the Lisbon agenda in Estonia (in 2000-2009) and tries to evaluate Estonia’s perspectives in post-Lisbon strategy (in 2010-2020). The research problem in this article is: implementation of Lisbon strategy (EU-Strategy 2020) in changed financial and economic circumstances.
Since 2000, the European Commission has been measuring the innovation performance of countries with the help of the European Innovation Scoreboard (EIS) which is the instrument developed by the European Commission, under the Lisbon strategy, to provide a comparative assessment of the innovation performance of EU Member States annually. Estonia’s innovation performance has been increasing over the past five years in relation to the EU average, taking the lead in the moderate innovators’ group in 2008 and in the Innovation followers’ group in 2009 Estonia is reaching the EU mean level according to summary innovation index and has a relatively high growth rate for its level. However, elaborated analysis shows some relevant problems. According to the prognosis made in the strategy of Knowledge Based Estonia, employment in 2007-2013 in the high technology sector will grow about 19,800 employees, diminishing at the same time employment by the same amount in other sectors. This means that actually there is anacute need for highly qualified specialists (with doctorate degrees) for the Estonian high technology sector. First of all this indicates a need for additional investments in higher educational institutions. In Knowledge Triangle conception two main tendencies of the development are related: innovative rearrangements in economy and in higher educational sphere and, second, the increase of Estonian economic competitiveness. Today in Estonia modernisation of universities is a key element for enhancing competitiveness. At the same time there is some backwardness in higher educational sphere compared with EU neighbour countries. Other aspects of the knowledge triangle concern the creation of new economic mechanisms (concrete business solutions) and a new structure of institutions to carry out a new comprehensive and dynamic innovation model.
In the process of globalisation, where Europe will need a new understanding of financial and economic integration concerning all EU member states and their own mission, Estonia must focus on the challenge of small country being
more flexible economically and taking a chance in quick rearrangements of the higher education system.
Keywords: Knowledge Triangle, Lisbon Strategy on Growth and Jobs, knowledge-based economy, European competitiveness, European innovation scoreboard.
Introduction. Scientific problem and relevance of the research
Knowledge and innovation for growth became one of the three main areas for action in the Lisbon partnership for growth and jobs strategy, which places science, technology and innovation at the heart of European Union policies (COM (2005)24).
The innovation drives economic growth and job creation and is important not only for high-tech sectors but for all economic sectors. The change taking place in the European economy and society presuppose a greater commitment to economic competitiveness in order to preserve the European welfare model as said Maria J. Rodrigues (2002 & 2009).
In Estonia, the period from 2000 to 2007 saw a rapid increase in Gross Domestic Product (GDP) while it dropped in 2008. Thus, Estonian per capita GDP, which was 45% of the EU average in 2000, increased to 68% by 2008 as you can see from current Estonian Statistics - http://www.stat.e e/dashboard.
This can also be seen from the latest works of Lithuanian researches – “modern high school must solve the tasks of their region and the country's economy tasks. That is why today it is necessary to speak about a new role of high schools in informational society, which requires a new attitude towards the management of knowledge and the system of knowledge management in higher educational institutions“ (Daugeliene, 2008; Sedziuviene & Vveinhardt, 2009).
The accumulation of human capital is especially relevant to developing countries (as Estonia) to catch up European Union average level (Kirch, 2009). In this light the topic of knowledge workers employment in the high and medium-high technology sector and in high technological service gains new importance and becomes a sensitive issue with developmental implications. Recently this phenomenon is analysed by Estonian scientists (Sepp, 2006; Varblane et al., 2008; Meriküll, Eamets, (2009) and experts of European Union (ERAWATCH Country Report, 2008; ERBD, 2008).
This article analyses the aspects of recent development
innovation) concerning the Estonian contemporary financial and economic crisis, taking into account very high unemployment rate (15% in October/November 2009).
Research object – to estimate the competitiveness of Estonian human recourses and strengthen effectiveness of actors (in education, research, and innovation).
Research objective – analysis of the changes in composition of the Knowledge Triangle for Estonia and indicators of the knowledge-based economy sector on the ground of Estonian national innovation system.
Research methods – the analysis of the scientific literature and research policy issues.
In order to estimate Estonia’s prospects, the analysis is made on the basis of the European Innovation Scoreboard (EIS-2009) and of the Estonian Government and Academy of Sciences policy paper Knowledge-based Estonia: Estonian Research and Development and Innovation Strategy 2007-2013. The analysis will concentrate on the following four measures:
• development of human capital and modernisation of universities;
• organising the public sector RD&I more efficiently; • increasing the innovation capacity of enterprises; • policy-making aimed at the long-term development of Estonia.
Estonia’s position at the EIS of 2009
It is not a simple task to measure the innovativeness of a state. To work out, apply, and assess political measures for this, it is imperative to produce certain measurement tools proper to the object under consideration. For the last ten years the European Commission has been measuring the innovation performance of countries with the help of the European Innovation Scoreboard (Veugelers, 2007).
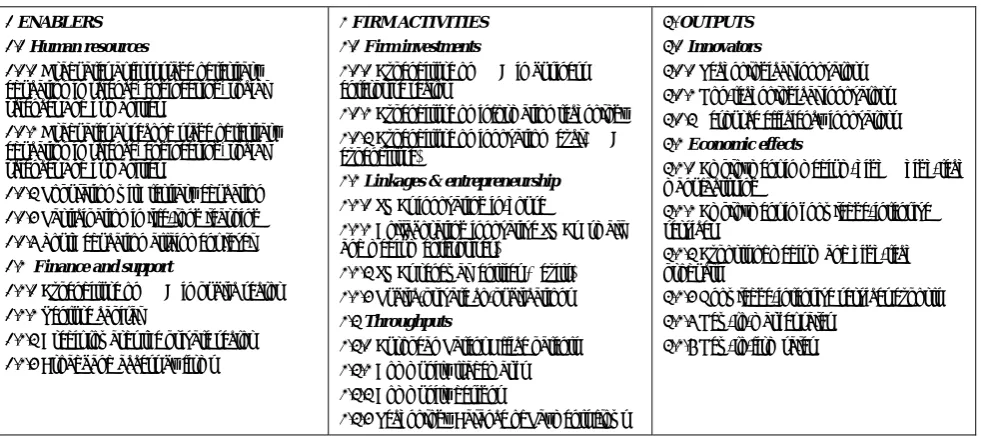
The European Innovation Scoreboard (EIS) has been published annually since 2001 to track and benchmark the relative innovation performance of EU Member States. From the EIS 2008-2010 onwards the methodology has been revised and the number of dimensions increased to 7 and grouped into 3 main blocks covering enablers, firm activities and outputs (Hollanders and van Cruysen, 2008).
These dimensions bring together a set of related indicators to give a balanced assessment of the innovation performance in that dimension (Table 1). The blocks and dimensions have been designed to accommodate the diversity of different innovation processes and models that occur in different national contexts (EIS- 2009). The newest structure of the innovation scoreboard is presented in Table 1.
Table 1 Indicators for EIS, 2008-2010
1 ENABLERS
1.1 Human resources
1.1.1 Graduates at first stage of tertiary education in science, engineering, social sciences and humanities
1.1.2 Graduates at second stage of tertiary education in science, engineering, social sciences and humanities
1.1.3 Population with tertiary education 1.1.4 Participation in life-long learning 1.1.5 Youth education attainment level
1.2 Finance and support
1.2.1 Expenditure on R&D in public sector 1.2.2 Venture capital
1.2.3 Credit towards the private sector 1.2.4 Broadband access by firms
2 FIRM ACTIVITIES
2.1 Firm investments
2.1.1 Expenditure on R&D in business enterprise sector
2.1.2 Expenditure on information technology 2.1.3 Expenditure on innovation (excl. R&D expenditure)
2.2 Linkages & entrepreneurship
2.2.1 SMEsinnovating in-house
2.2.2 Collaborating innovative SMEs (small and medium enterprises)
2.2.3 SMEs renewal (entries + exits) 2.2.4 Public-private co-publications 2.3 Throughputs
2.3.1 European Patent Office patents 2.3.2 Community trademarks 2.3.3 Community designs
2.3.4 Technology Balance of Payments flows
3. OUTPUTS
3.1 Innovators
3.1.1 Technological innovators 3.1.2 Non-technological innovators 3.1.3 Resource efficiency innovators 3.2 Economic effects
3.2.1 Employment in medium-high & high-tech manufacturing
3.2.2 Employment in knowledge-intensive services
3.2.3 Exports of medium and high-tech products
3.2.4 Knowledge-intensive services exports 3.2.5 New-to-market sales
3.2.6 New-to-firm sales
The EIS uses the most recent statistics from Eurostat and other internationally recognised sources available at the time of analysis. International sources have been used wherever possible in order to improve comparability between countries. It is important to note that the data relates to actual performance in 2006 - 2008 (IES-2009, 7). As a consequence the 2009 EIS does not capture the most recent changes in innovation performance, or the impact of policies introduced in recent years which may take some time to impact on innovation performance. Nor does it capture the impact of the financial crisis on innovation performance.
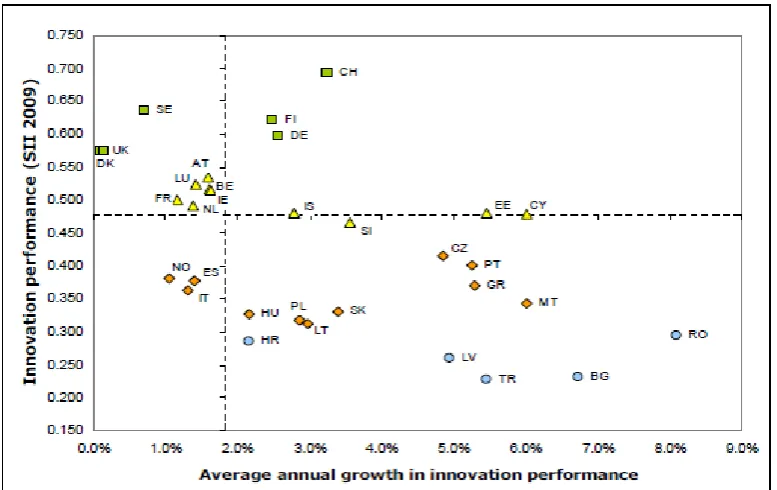
Figure 1. EIS - Convergence of innovation performance in 2009 (EIS- 2009)
At the same time the countries are logically grouped making it possible to follow similarities. The closest neighbours to Estonia are Slovenia and Cyprus. New Member States can be observed when comparing the indicators of other different fields as well.
The look at the position of the countries along vertical axis leaves no doubt that the innovativeness depends on the economic structure and standard of living of the countries. On the top of vertical axes one can find the industrial countries of high life standard like Sweden, Finland, Denmark, Germany and United Kingdom. Named countries are leaders.
The average growth rates for the four country groups show that there is between group convergence with the Innovation followers growing at a faster rate than the Innovation leaders, the Moderate innovators growing faster than the Innovation followers and the Catching-up countries growing at a faster rate than the Moderate innovators (Table 2). The overall process of catching up, where countries with below average performance have faster growth rates than those with above average performance, can also be observed at the level of most individual countries.
For Estonia, innovation performance is just below the EU27 average but the rate of improvement is above that of the EU27. According to EIS-2009 Estonia’s place among 27 EU states is 12th (see EIS-2009, 3). Estonia’s relative strengths, compared to the country’s average performance, are in finance and support, firm investments, linkages & entrepreneurship and innovators. Relative weaknesses are in sc throughputs (patents, trademarks, designs etc). Over the past 5 years, firm investments and throughputs have been the main drivers of the improvement in innovation performance, in particular as
a result from strong growth in Business R&D expenditures (20.0%), non-R&D innovation expenditures (29.3%), community trademarks (14.5%) and technology balance of payments flows (16.9%). Performance in innovators has remained stable (see EIS-2009).
Lithuania is among the group of moderate innovators, with an innovation performance well below the EU27 average and a rate of improvement above that of the EU27. Relative strengths, compared to the country’s average performance, are in human resources, finance and support and linkages & entrepreneurship. Lithuania’s relative weaknesses are in firm investments, throughputs and innovators. Over the past 5 years, human resources, finance and support and throughputs have been the main drivers of the improvement in innovation performance, in particular as a result from strong growth in S&E and doctorate graduates (14.8%), private credit (21.5%), EPO patents (15.5 %) and Community trademarks (26.8%). Performance in innovators has worsened, in particular due to a decrease in SMEs introducing product or process innovations (-6.1%).
Performance in linkages & entrepreneurship has worsened, in particular due to a decrease in the firm renewal rate (-17.2%) (see EIS-2009).
The 2008 European Innovation Scoreboard showed a clear process of convergence between EU Member States. The economic crisis may retard the convergence between EU countries in innovation performance. In the 2009 Scoreboard, this process is less clear but this still does not capture the full impacts of the crisis as most data come from 2007 and 2008 (EIS 2009, 20). The findings in this report suggest that the rapid advances in innovation performance made in many lower performing countries may not be maintained, at least in the short term, due to the severity of the economic crisis.
Authors of the Global Competitiveness Report Klaus Schwab and Xavier Sala-i-Martin have mentioned - “among the Baltic economies, Estonia at 35th loses some ground for the second year in a row, largely because of a deteriorating macroeconomic environment following the economic crisis. Nevertheless, Estonia continues to be characterized by efficient institutions, well-functioning markets, and strong uptake of new technologies“ (Global Competitiveness Report 2009-2010).
Recent economic crisis could be an opportunity to strengthen knowledge-based economy, and to push for greater cross-border cooperation, especially in the Baltic Sea region.
New trends of the development of the knowledge Triangle: problems with the human recourses competitiveness.
There appears to be a strong correlation between the levels of R&D and economic growth and competitiveness (see McGuinness, N. & O’Carroll, 2010). Recent years have seen an increased focus on R&D strategies as part of national public policies in the drive towards the knowledge economy. In Estonia modernisation of universities and cooperation between universities and enterprise is a key element for enhancing competitiveness.
There are 68 thousand students in Estonia today and more than half of them (54%) pay a fee for their studies. Students are accepted to both flows: the basis of state-commissioned study places and the ones that are not paid from the state budget funds. Over the years, the proportion
of students studying in state-commissioned study places and those available through tuition fee has significantly changed. A rapid increase of students who study at one’s own expense in universities came about in the years 1998-2003, when the state created state financed opportunities for only 1% of students while places for study for private money increased about 2.5 times (Kirch, 2005).
Estonian state contributes a relatively small share to the higher education sphere (as we can see on Figure 2) and the present situation in training of highly qualified specialists is not satisfying: on the one hand, students drop out from tertiary education institutions very often without graduation; on the other hand, the share of postgraduate students compared to the share of students with bachelor degrees is very small. However, national priority in the fields of study is given to engineering; manufacture and processing (different industrial technologies and products); IT sciences; environmental protection (environmental and geo- technologies); life sciences (biotechnology, biomedicine).
Estonian expenditure to higher education sector (index of expenditure per full time equivalent student compared to GDP per capita in 2006) was 60% of the average level of the EU. Compared to Estonian neighbours Latvia (86%) and Lithuania (84%), this is the lowest share, not to mention Finland (108%) or Sweden (135%) as one can see from Eurostat data (Indicators on education expenditure, 2009). Estonia has lost its position among innovative EU states.
It is important to note that in 2001- 2008 in Estonia the greater part of growth of graduates in the science and technology sector comes from growth in ITC specialities (total number for this period about 8000 students, but about half less in coming seven years) as recently mentioned Chairman of Supervisory Board of the Estonian Development Fund Raivo Vare on presentation in Estonian Parliament (www. Arengufond. ee. 11. March 2010).
According to employment study and prognosis for the year 2015 done by researchers of the Tartu University faculty of economics, employment in the high and medium-high technology sector and in high technological service will grow up to 11% in Estonian general employment. This makes about 69,100 highly qualified employees, which is a large share compared to Estonian higher education system capacity (Teadmispõhise majanduse suunas, 2009).
Estonian backwardness in training specialists with doctoral degrees has become one of the main problematic tasks in fulfilling the Lisbon strategy objectives. For example, in Estonia five times fewer students graduate from university with doctoral degrees than in Portugal (doctoral students per 1000 population aged 20-29) (Eurostat: Science, technology and innovation in Europe).
Figure 2. Public education expenditure as a percentage of GDP and total expenditure in Euro PPS per pupil / student – 2006
13,3
18,1
9,2
18,8
13,6 13,4
0 5 10 15 20 25
Estonia Lithuania Latvia Finland Sweden EU -27
2003 2004 2005 2006 2007
Figure 3. Estonian University Tertiary Graduates in 2003-2007 (per 1000 of Population aged 20-29)
Public financing and competitiveness
According to the prognosis made in the strategy of Knowledge Based Estonia (2007-2013), employment in the high technology sector will grow (ca 19,800 people) diminishing at the same time employment by the same amount in other sectors. This means that actually there is an acute need for highly qualified specialists (with doctorate degrees) for the Estonian high technology sector. First of all this indicates a need for additional investments in higher educational institutions.
In Estonia, as for general indicators of implementation of the strategy of Knowledge based Estonia, the total expenditure on research and development was planned to be increased to 1.5% of GDP by 2008 and to 3% of GDP by 2014, of which the business sector research and development investments cover more than half (1.6% of GDP). Today (2008) total expenditure for R&D is 3.255 billion kroons, which is 1.29% of GDP (Statistics Estonia, 2009).
However, despite the fact that Estonia’s investments to the R&D sector have been among those most quickly increasing, the speed of growth is not sufficient to fulfil the Lisbon Strategy criteria by 2014. Estonia’s speed of growing investments to the R&D sector is remarkable only compared to EU new member states. Austria, Estonia, and the Czech Republic are the member states that have achieved the most substantial progress towards their targets (Veltri, Grablowitz and Mulatero, 2009). The progress has been substantial, but not sufficient.
The results of the second Community Innovation Survey 2002-2004 (CIS4 – Innovation) showed clearly that certain challenge exists for the national science to be taken into consideration – demand to increase competence of local enterprise and expand international cooperation (Ukrainski, Masso, Varblane, 2009).
However, some positive tendencies are appreciable. According to public statistics, the labour productivity in the information and communications technologies (ICT) sector in 2009 was two times higher than the average of a business sector. It resulted mainly from the enterprises of telecommunications with four times higher labour productivity than the average of Estonian business sector (see: http://www.stat.ee/38012).
Increasing the innovation capacity of enterprises The key question is to develop all actors of the knowledge triangle and to involve the government’s responsibility in this process. As we see, in Estonia important aspect of the knowledge triangle concerns creating new economic mechanisms (concrete business solutions) and creating a new structure of institutions (rearrangement) to carry out a new comprehensive and dynamic innovation model.
Institutions that are responsible for supporting Estonian innovation development are: the Ministry of Economy and Communications and the Ministry of Education and Research together with the bigger universities. These institutions have to make serious efforts to create well functioning environment for innovative developments.
Purpose of leading institutions was to create Estonian Development Fund (EDF), the idea being taken from development strategy of Finnish innovation foundation SITRA. This very complicated task was carried out in 2006/2007. EDF creation initiated important changes: research projects of the EDF give meaning to Estonian economic development. The Estonian growth vision 2018 puts together the Estonian Development Fund's leadership in co-operation with decision makers now and in the future (Edasi, Raport Riigikogule).
Looking at the European economy in general, strategies to attack the recession are emphasised, not just to respond to it. Innovation – in business, communities, and public services – has to be core for this (White Paper to Estonian Parliament, 2009).
In Estonia it is necessary to support quick restructuring of the economy and the associated long-term growth of the enterprises' competitiveness. On the one hand, restructuring requires attracting new capital for investments into the economy and developing the human capital. On the other hand, in parallel we must deal with easing the direct impacts of the crisis. It is important to develop enterprises exporting capacity and sustain employment. Ministry of Economy and Communications is Institution responsible for supporting the Estonian foreign investment and export action planfor 2009-2011 “Made in Estonia” (2009). The disappearance of the Estonian main advantages – cheapness of labour and increasing domestic demand have lead up to result that our liberal and open economic policy which is of course necessary precondition in receipt of the foreign investments, is not sufficient any more. The receipt of such investments as required for Estonia today and possible on the basis of the trends, requires the development of new advantages and innovative approach for the activities of national involvement of foreign investments.
As first priority in “Made in Estonia” action plan is the promotion of the state as the target country of foreign investments the international recognition of the name of the state and its relation to the easily recognizable factors for the foreign investor are important. Sooner or later, Estonia will adopt a new currency – the euro. For the political leaders switch to the euro is about the trustworthiness of the Estonian Government. It is almost five years since the Estonian Government approved the first version of the national changeover plan for adopting the euro. This time Estonia didn’t meet the inflation criterion. Now, despite the country’s serious economic woes, a new version of the changeover plan was agreed in mid-2009, and although no target date has been set, both the Estonian Government and the Central Bank are agreed that their objective is to join the euro-zone as soon as possible. Estonia expects to meet all of the Maastricht criteria in spring of 2010.
Yet of course Estonia’s economic crisis has been real enough. An excessively high social price has been paid for the country’s stabilisation achievements. The rate of registered unemployment in the labour force is growing rapidly, with joblessness reaching 15% in spring of 2010.
In contrast to some of the newer EU member states, in Central Europe and especially in Estonia, popular support for EU membership is still significantly high. The last European Commission Eurobarometer survey showed that about 76% of Estonian respondents evaluate EU future as “totally optimistic” (Standard EB72. Autumn 2009).
Constructing the EU for the next decade
responses to the grand challenges of the present financial-economic crises should take the form of broad areas of issue-oriented research in relevant fields (Lund Declaration, 2009 ).
Attila Agh from Hungary writes, “the French–Czech– Swedish team presidency has been focusing on global crisis management but its task has continuously shifted from this short-term crisis management to long-term strategy building. This is due partly to the relative success of the crisis management after the first year and partly to the EU Road Map, which has indicated the end of the Lisbon Strategy by 2010 and has necessitated its renewal for the next decade“(Agh, 2009).
Attila Agh’s paper is frustrating because he identifies the chief problem of post-Lisbon strategy as follows: “There is a need for this kind of Road Map, with new community policies and new budgeting on one side and with renewed efforts for fully integrating the new Member States, including the EU 2020 agenda, on the other. The future strategy has to be elaborated with a few clear strategic priorities such as (1) a green or low-carbon economy, (2) an innovation-centred, productive society, (3) policy-driven financial perspectives and (4) a modernized public sector with high-quality public services. The EU 2020 Strategy has to be based on a well-coordinated set of concrete programmes, with the main objectives specified and with a detailed set of indicators that will facilitate a radical programming turn towards super-planning” (Agh, 2009).
The change taking place in the European economy and society presupposes a greater commitment to economic competitiveness in order to preserve the European welfare model. In the European Commission Strategy 2020 (March 2010) the future development plan was presented as follows: “Over the last two years common action taken at the height of the crisis through the European Recovery Plan helped prevent economic meltdown, whilst our welfare systems helped protect people from even greater hardship… What is needed is a strategy to turn the EU into a smart, sustainable and inclusive economy delivering high levels of employment, productivity and social cohesion. This is the Europe 2020 strategy“(COM 2010) 2020 final, 10).
Conclusions
In the process of globalisation, where Europe will need a new understanding of financial and economic integration concerning all EU member states, Estonia’s opportunity is to increase competitiveness of its own human resources and on the ground of this to strengthen the sector of the knowledge-based economy. Increase of professional knowledge and level of skills of people together with firms’ development and competitiveness in the larger context of the knowledge-based economy is one contingency by which to change the circumstances concerning one side of the knowledge triangle.
On the one hand, this requires attracting new capital for investments into the economy and the development of human capital. According to the prognosis of Governmental strategy (Knowledge Based Estonia), employment in the high technology sector will grow by about 19,800 employees in 2007-2013, diminishing at the same time employment in other sectors. This means that there is an acute need for highly-qualified specialists (with doctoral degree) for the Estonian high technology sector. First of al, this means an increase of investments in higher educational institutions.
Today Estonia has lost its position compared with neighbour EU states. Estonian recent backwardness in training highly qualified specialists (especially with doctoral degree) has become one of the main problematic tasks in fulfilling the Lisbon strategy objectives. However, Estonian people are still generally positive concerning the EU’s economic future and believe that advantageous economic change will be quicker through joining the euro-zone.
This is a challenge to take the economic crisis as an opportunity to strengthen knowledge-based economy. Demand for greater cross-border co-operation and development of instruments to stimulate and support initiatives for cross-border cooperation with knowledge-building institutions in Baltic Sea region and in Scandinavia (Sweden, Finland and Denmark) will create the peak of excellence environments.
References
Agh, A. (2009). Sweden gives a Nordic Flavour to the EU 2020 Strategy: Swedish Presidency between Crisis Management and Long-term Vision. In: (Eds.) Langdal, F. and von Sydow, G. The Swedish Presidency: European Perspectives – SIEPS 2009:3op (December 2009), 50-63.
COM (2005)24. Communication to the spring Council. Working together for growth and jobs: A new start for the Lisbon Strategy. http://ec.europa.eu/growthandjobs/pdf/COM2005_024_en.pdf
COM (2010) 2020 final. Communication from the Commission EUROPE 2020: A strategy for smart, sustainable and inclusive growth. www.lex.unict.it/eurolabor/news/en/default.htm
Daugeliene, R. (2008). Perspectives of Lithuania in Knowledge-based Economy: Aspect of National Innovation System Analysis. European Integration Studies, Research and Topicalities, 2, 71-82.
Edasi. Raport Riigikogule. (2008). Tallinn: EestiArengufond.http://www.arengufond.ee/ upload/Editor/Arengufondist/Arengufond-raport-Riigikogule-2009-light_1.pdf
EBRD – Transition Report 2008: Growth in transition: part 3. Fostering growth in transition economies, 50- 62.
Estonian Statistics. Indicators for Sustainable Development.2009. http://www.stat.ee/dashboard
The Global Competitiveness Report 2009-2010. Ed-s. Klaus Schwabe, Xavier Sala-i-Martin. World Economic Forum: Geneva 2009.
ERAWATCH Country Report 2008. An assessment of research system and policies Estonia. http://cordis.euro pa.eu/erawatch.
Standard EB72. Eurobarometer 72. Fieldwork: Oct.-Nov. 2009; Publication: December 2009. eb72_ee_en.pdf EIS-2009. European Innovation Scoreboard 2009. Comperative Analysis of Innovation Performance.
http://www.proinno-europe.eu/sites/default/files/page/10/03/EIS%202009%20Final%20report.pdf Eurostat: Indicators on education expenditure - 2006. Eurostat: Data in focus, 36/2009.
Eurostat: Science, technology and innovation in Europe - 2009 Edition. Eurostat, 2009.
Heinlo, A (2008). Innovaatilisus on jätkuvalt heal tasemel (Innovativeness continously measures up.) //2006-Teadus- ja arendustegevus (Research and Development), Tallinn: Statistics Estonia, 27-50.
Heinlo, A. (2009). Innovation Scoreboard: Estonia`s Advantages and Shortcomings// Eesti Statistika Kvartalikiri – Quarternal Bulletin of Statistics Estonia, Vol 1, Tallinn, 50-57.
Hollanders, H., van Cruysen, A. (2008). Rethinking the European Innovation Scoreboard: A New Methodology for 2008- 2010. http://hollanders.unumerit.nl/workshop/InnoMetrics/EIS/2008/Workshop/Output/Report.pdf
CIS4 - Innovation in Estonian Enterprises (Based on the Estonian results of the Fourth Community Innovation Survey, Authors: A. Viia; E. Terk; R. Lumiste; A. Heinlo //Innovation Studies, Vol 7, 2007, 108. http://www.mkm.ee/failid /Innovation_in_Estonian_Enterprises__CIS4_2.pdf
Kirch, A (2005). Lissaboni agendast ning Eesti teadus- ja kõrgharidussüsteemi arengutest. // Audentese Ülikooli Toimetised, vol. 7, pp 182-194.
Kirch, A. (2009). On the Perspectives of the Implementation of Knowledge Triangle Based on Lisbon Strategy in Estonia European. Integration Studies, Research and Topicalities, 3, 36-4.
Knowledge based Estonia: Estonian Research and Development and Innovation Strategy, 2007-2013. Tallinn 2006. Lund Declaration (July, 2009). Europe must Focus on the Grand Challenges of our Time// Swedish Presidency Research Conference in Lund „New worlds – New solutions , 7-9. July 2009.
McGuinness, N. & O’Carroll C. (2010). Benchmarking Europe's Lab Benches: How Successful has the OMC been in Research Policy? Journal of Common Market Studies, Vol.48, Issue 2, 293-318.
Meriküll, J., Eamets, R. (2009). Teadmis-põhise majanduse suunas liikumiseks vajalik tööjõud ja koolitus-valdkonnad (uuringu lühiversioon). Riigikantselei poliitika analüüside ja uuringute sari, 1/2009, Tallinn.
Made in Estonia (2009). Estonian foreign investment and export action plan 2009-2011. Operational Plan of the Estonian Entrepreneurship Policy for 2007-2013. Ministry of Economic Affairs and Communications (Tallinn, 23 April 2009). Rodrigues, M. J. (2002).The New Knowledge Economy in Europe. A Strategy for International Competitiveness and
Social Cohesion. Cheltenham: Edward Elger.
Rodrigues, M. J. (Ed.) (2009). Europe, Globalization and the Lisbon Agenda. Cheltenham: Edward Elger.
Sedziuviene, N., & Vveinhardt, J. (2009). The Paradigm of Knowledge Management in Higher Educational Institutions. Inzinerine Ekonomika-Engineering Economics(5), 79-90.
Sepp, J. (2006). Institutsionaalsete tegurite ja inimkapitali mõju riikide majanduspotentsi-aalile ja–kasvule. Majandusarengu institutsionaalsed tegurid. Tartu: Tartu Ülikooli Kirjastus, 103- 132.
Vare. R. (2010). Tööpuudus: Eesti strateegilised valikud. Eesti Arengufond. (11. 03. 2010).
Varblane, U. and others (2008). Eesti majanduse konkurentsivõime hetkeseis ja tulevikuväljavaated. // Eesti Fookuses, 1/ 2008, Eesti Arengufond. (www. arengufond.ee).
Veltri, G., Grablowitz, A., Mulatero, F. (2009). Trends in R&D policies for a European knowledge-based economy. EC JRC – Institute for Prospective Technological Studies, Seville. (EUR 24014EN-2099).
Veugelers, R. (2007). Developments in EU Statistic on Science, Technology and Innovation: Taking Stock and Moving Closer to Evidence-based Policy Analysis// Science, Technology and
Innovation Indicators in a Changing World. Responding to Policy Needs. OECD, 33- 46.
Aksel Kirch
Žinių diegimo procesas: Estijos trikampis
Santrauka
Straipsnyje nagrinėjama žinių ekonomikos diegimo, paremto žinių trikampio koncepcija, problema Estijoje (akademiniai tyrimai, aukštojo mokslo institucijų infrastruktūra, inovacijų įmonės). Taip pat aptariamas Lisabonos nutarimo diegimo efektyvumas Estijoje, stengiamasi įvertinti Estijos perspektyvas pagal Lisabonos strategiją, palyginti su kaimyninėmis valstybėmis.
Nuo 2000 m. Europos komisija Europos inovacijų taryboje vertina šalių inovacinę veiklą, kuri sukurta prie Europos komisijos pagal Lisabonos strategiją tam, kad kasmet atliktų Europos Sąjungos valstybių inovacinę veiklą. Pagal šios tarybos įvertinimą Estija yra 12 vietoje tarp 27 Europos Sąjungos valstybių. Tai aiškiai parodo, kad Estija siekia vidutinio lygio inovacijų rodiklio ir gana sparčiai auga.
Žinių trikampio koncepcijoje yra dvi pagrindinės vystymosi tendencijos: inovaciniai pertvarkymai ekonomikoje ir aukšto mokslo srityje bei Estijos ekonomikos konkurencingumo augimas. Universitetų modernizavimas Estijoje ir šių universitetų bendradarbiavimas su tyrimo institutais yra svarbiausias veiksnys didinant jų konkurencingumą. Tačiau aukštojo mokslo srityje atsiliekama, palyginti su kaimyninėmis Europos Sąjungos šalimis.
Estija turi galimybių didinti savo žmogiškųjų išteklių konkurencingumą ir stiprinti žinių ekonomikos sektorių. Profesinių žinių augimas kartu su firmų konkurencingumo didėjimu žinių ekonomikos kontekste yra tos sąlygos, kurios sudaro vieną žinių trikampio kraštinių. Kita vertus, reikalinga įvesti naujų kapitalo investicijųį ekonomiką ir vystyti žmogiškąjį kapitalą. Remiantis Estijos žinių ekonomikos strategija, 2007–2013 m. aukštų technologijų
srityje darbuotojų padaugės 19800. Kituose sektoriuose jų sumažės. Tai reiškia, kad Estijai reikia aukštos kvalifikacijos darbuotojų aukštųjų technologijų
sektoriuje. Taigi prireiks didelių investicijų, kad aukštasis mokslas šia kryptimi plėtotųsi. Estija, palyginti su kitomis ES šalimis šioje srityje atsiliko. Specialistų, įgysiančių daktaro laipsnį, rengimas Estijoje yra pagrindinis uždavinys vykdant Lisabonos strategijos nutarimus.
Kiti žinių trikampio aspektai susiję su naujų ekonominių priemonių (konkretūs verslo sprendimai) ir naujo tipo institucijų kūrimu, kuris leistų
parengti būtiną ir dinamišką inovacijų modelį.
Remiantis Estijos augimo vizija, 2018 m. siekiama derinti Estijos vystymosi fondus ir sprendimų kūrėjus dabar ir ateityje. Vizijos esmė – Estija, diegdama šiuolaikinę ekonomiką, galės vystytis pagal tą patį modelį, skatinantį plėtoti mažąją ir uždarą ekonomiką. Estijos parlamento Baltosios knygos pagrindinė mintis yra ta, kad Estijos ekonomikos padėtis yra kritinė ir gali toliau blogėti. Stebint, kaip vystosi Europos ekonomika, būtina imtis priemonių ir naujos strategijos recesijai įveikti, o ne tik kalbėti apie tai. Naujovės versle, bendrijose ir viešojo aptarnavimo sektoriuje yra neišvengiamos.
Estijoje reikia remti greitą ekonomikos restruktūrizaciją, ilgalaikį augimą, įmonių konkurencingumą. Viena, reikia pritraukti naujų investicijųį
ekonomiką ir žmogiškojo kapitalo vystymą. Antra, kartu reikia ieškoti priemonių ir būdų, kaip palengvinti krizės padarinius. Tam reikia kelti įmonių
eksporto galimybes ir didinti įdarbinimo galimybes.
2009 m. Ekonomikos ir bendradarbiavimo ministerija atsakinga už Estijos užsienio investicijų plėtimą ir eksporto veiklos plano įgyvendinimą
2009–2011 m. (Pagaminta Estijoje, 2009). Šiame plane svarbiausia yra užtikrinti investavimo galimybes, taikant visus veiksnius, galinčius skatinti augimą.
Anksčiau ar vėliau Estijoje bus įvesta nauja valiuta – euras Estijos vyriausybei tai yra svarbus politinis ir ekonominis žingsnis. Jau praėjo beveik penkeri metai, kai Estijos vyriausybė priėmė euro įvedimo planą. 2009 m., nepaisant rimtų šalies ekonominiųįsipareigojimų, priimta nauja plano versija ir nors galutinis terminas nenustatytas, Estijos vyriausybė ir Centrinis bankas sutaria, kad jų pagrindinis tikslas yra kuo greičiau prisijungti prie euro zonos. Šį pavasarį Estija tikisi įvykdyti visus Mastrichto kriterijų reikalavimus.
Aišku, kad Estijos ekonominė krizė yra realus veiksnys. Už kai kuriuos šalies stabilizavimo pasiekimus buvo sumokėta labai didele kaina. Nuolat didėja nedarbas, kuris šį pavasarį pasiekė 15 % ribą.
Estijos žmonės yra teigiamai nusiteikę dėl ES ekonominės ateities ir tiki, kad naudingi ekonominiai pokyčiai bus greitesni įsiliejus į euro zoną. Šiuo metu Europos šalių bendradarbiavimas yra svarbus negu kada nors anksčiau. Sparčiai keičiantis ekonomikai, bendros problemos ir iššūkiai turi būti sprendžiami regioniniu požiūriu (Europoje arba Europos Sąjungoje). Baltijos šalyse būtina plėtoti bendradarbiavimą tarp žinių kūrimo institucijų ir sukurti meistriškumo aplinką.
Raktažodžiai: žinių trikampis, Lisabonos strategija, žinių ekonomika, Europos konkurencingumas, Europos inovacijų taryba.