ISSN 0975-928X
135
Research Article
AMMI analysis of grain yield in rice genotypes across environments
M. Umadevi* and S. Manonmani
Centre for Plant Breeding and Genetics, Tamil Nadu Agricultural University, Coimbatore – 641 003
E-mail: [email protected]
(Received: 10 Nov 2017; Revised: 9 Mar 2018; Accepted: 13 Mar 2018)
Abstract
The identification of the highest yielding cultivar for a specificenvironment on the basis of both genotype (G) and genotype x environment (GE) interaction would be useful to breeders and producers since yield estimates based only on G and environment(E) effects are insufficient. The objective of this study wasto demonstrate the usefulness of additive main effects and multiplicativeinteractions (AMMI) model analysis. Replicated grain yielddata of rice (Oryza sativa L.) genotypes at three locations in Coimbatore (E1), Bhavanisagar (E2) and Aliyar Nagar (E3) were obtained andused for this purpose. Through AMMI model analysis, the magnitudeand significance of the effects of GE interaction and its interactionprincipal components relative to the effects of G and E wereestimated. Among the three, E3 environment was far away from the origin. The environments E2 and E3 condition were exhibiting high interaction effect, whereas the environment E1 had moderate interaction effect with the other two environments. The parent TP 1021 R and the hybrids viz., IR 80559 A X RR 286 R, APMS 6 A X IR 62037 R, IR 75601 A X IR 72865 R, IR 75601 A X RR 347 R, IR 75596 A X MDU 5 R, IR 75596 A X ASD 06-8 R, CRMS 32 A X IR 62037 R, CRMS 32 A X TP 1021 R and IR 75608 A X ASD 06-8 R showed IPCA 1 score close to zero with high main effects indicating that these varieties were less influenced by environments. Hence, the above said hybrids were stable and had general adaptability for all the environments. Since, the environments E3 had positive IPCA 1 score and high mean, it had positive interaction with these genotypes and this environment was considered as the stable environment for these hybrids.
Key words
Rice, AMMI, Biplot analysis, G x E interaction Introduction
Genotype x Environment Interaction is commonly
observed by crop producers and breeders as the
differential ranking of cultivar yields among
locations or years. Plant breeders conduct
multiple-environmenttrials (MET) primarily to identify the
superior cultivar fora target region and secondarily
to determine if the target regioncan be subdivided
into different mega-environments. Several
statistical methods have been developed for the analysis of Genotype by Environment Interactions
(GEI) and phenotypic stability. Regression
technique has been widely used (Eberhart and Russell, 1966; Perkins and Jinks, 1968) due to its simplicity and the fact that its information on adaptive response is easily applicable to locations.
The PCA is a multiplicative modelthat contains no
sources of variation for additive G or E maineffects
and does not analyze the interactions effectively.
Thelinear regression method uses E means, which
are frequently a poor estimate of environments,
such that the fitted linesin most cases account for a
small fraction of the total GE (Zobel et al., 1988).
The AMMI model analysis combines the ANOVA
(with additive parameters) and PCA (with
multiplicative parameters) into a single analysis.
The AMMI model analysis is useful in making
cultivar recommendations, specifically by
mega-environmentanalysis, in which the best performing
cultivar for each subregionof the crop's growing
region is identified. Biplot graphs, which show
markers of both genotypes and environments, are
used to present AMMI analysis results (Ebdon and Gauch, 2002). Crop breeding programs should take
GE interaction into consideration and have an
estimate of its magnitude, relative to the magnitude of G and E effects, which affect grain yield.
Furthermore, theidentification of the cultivar that
yields best at a specificgrowing environment would
be useful to breeders and producers. AMMI
analysis has been reported to have significantly improved the probability of successful selection and has been used to analyse GxE interaction with greater precision in many crops. The model combines the conventional analysis of variance for genotype and environment main effects with principal components analysis to decompose the GEI into several Interaction Principal Component Axes (IPCA). With the biplot facility from AMMI analysis, both genotypes and environments are plotted together on the same scatter plot and inferences about their interaction can be made. The present study demonstrated the utility of AMMI
model analysis in evaluating the significance and
136
yield and in determining the best performing
cultivarfor each environment.
Materials and Methods
The experimental material for the present investigation consisted of 100 genotypes including
18 parents viz., IR 80559 A, APMS 6 A, IR 72081
A, IR 75601 A, IR 75596 A, IR 80154 A, CRMS 32 A, IR 75608 A, IR 62037 R, IR 72865 R, IR 68427 R, MDU 5 R, ACK 99017 R, TP 1021 R, RR 363 R, RR 347 R, RR 286 R, ASD 06-8 R and their 80 hybrids along with 2 checks. Crosses were effected between eight female and ten male parents in Line x Tester fashion and a total of 80 cross combinations were obtained and they were evaluated in randomized block design with two replications at Coimbatore (E1), Bhavanisagar (E2) and Aliyar Nagar (E3). The hybrids along with their parents were sown in raised beds and 25 days old seedlings were transplanted in main field under puddled condition. For each genotype, single seedling per hill was planted at 20 x 20 cm spacing in two rows of 2.0 m length. Recommended fertilizer dose and cultural practices were adopted. Observations were recorded
for four yield contributing traits viz., plant height,
number of productive tillers, per plant, number of grains per panicle and grain yield per plant. Statistical constants of mean for all the characters were estimated by AMMI model.
Additive Main effects and Multiplicative
Interaction (AMMI) model (Zobel et al., 1988) was
performed by IRRI Stat. The AMMI statistical model is a hybrid model. It makes use of standard ANOVA procedures to separate the additive variance from the multiplicative variance (genotype x environment interaction) and then uses a multiplicative procedure (Principal Component Analysis-PCA) to extract the pattern from the G x E portion of the ANOVA analysis. The result is the least square analysis, which, with further graphical representation of the numerical results (Biplot
analysis), often allows a straightforward
interpretation of the underlying causes of G x E.
Results and Discussion
The AMMI analysis of variance clearly indicated that genotypes, environments and G X E interaction components were significant for the four traits studied (Table 1). The per cent contribution of individual components to total sum of squares was
worked out for yield. The genotypes,
environments, GEI components accounted for 85.39, 0.001 and 0.12 per cent of the percentage sum of square respectively. The significant GEI which was further partitioned into two IPCA axes (Interactive principal component axes). The two
terms (IPCA 1 and IPCA 2) were found significant with 100.00 per cent of G x E sum of squares, getting partitioned into first IPCA1 axis with 81.10 per cent and the remaining 18.91 per cent into second IPCA2 axis without leaving any residual effect which suggested that the first interaction axis accounted at least as much variance as the additive terms. Similar findings was reported by Kayode A.
Sanni et al. (2009) and suggesting that a wide range
of genotypic diversity and environmental variation.
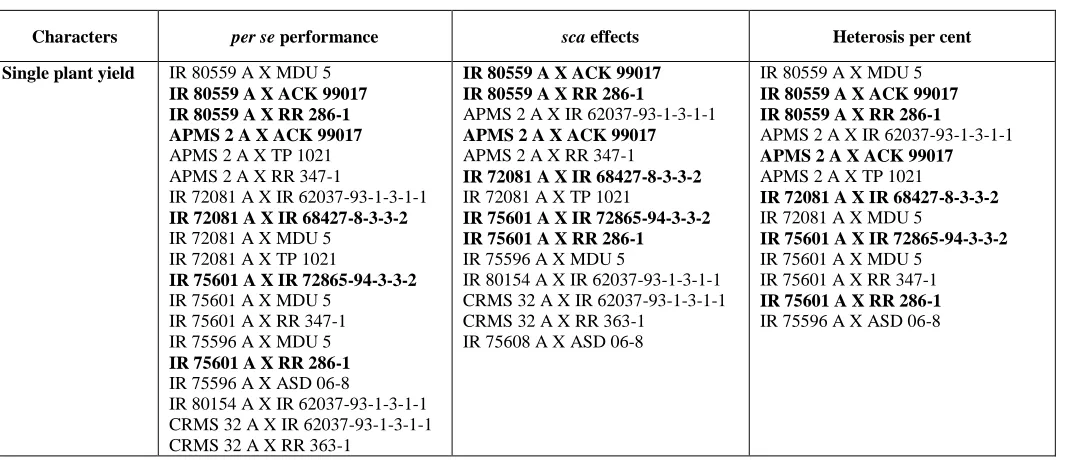
Biplot analysis is possibly the most powerful interpretive tool for AMMI models. Biplots are graphs where aspects of both genotypes and environments are plotted on the same axes so that inter relationships can be visualized. There are two basic AMMI biplots, the AMMI 1 biplot where the main effects (genotype mean and environment mean) and IPCA1 scores for both genotypes and environments are plotted against each other and the AMMI 2 biplot where scores for IPCA 1 and IPCA 2 are plotted. AMMI 2 biplots do not show genotype or environment main effects and hence do not show adaptation.
For number of grains per panicle, the IPCA1 value varied from -4.90 (CRMS 32 A X ASD 06-8 R) to 4.05 (IR 68427 R) and IPCA 2 values varied from -2.85 (IR 80154 A X ACK 99017 R) to 4.85 (IR 75596 A X RR 363 R). The three environments recorded the values such as 120.30 (E1), 121.70 (E2) and 121.00 (E3) as means and 6.57 (E1), 4.89 (E2) and -11.46 (E3) as IPCA 1 scores. IPCA 2 scores varied from -7.51 (E2) to 6.81 (E1). Environment 1 recorded the mean 29.98g, 4.03 (IPCA 1) and -2.91 (IPCA 2), whereas, the mean, IPCA1 and
IPCA2 found in E2 were 29.59g, -1.61 and 3.87
respectively and in E3were 30.22g, 5.63 and -0.98
respectively for single plant yield. The IPCA 1 score of genotypes varied from -3.18 (IR 75596 A X TP 1021 R) to 2.16 (IR 80154 A X MDU 5 R), while IPCA 2 score was found to differ from -1.64 (IR 75596 A) to 1.83 (RR 347 R) (Table 2). The AMMI 1 biplot for single plant yield clearly indicated that the three environments had differed in both main and interaction effects (Figure 1). Among the three, E3 environment was far away from the origin. The environments E2 and E3 condition were exhibiting high interaction effect, whereas the environment E1 had moderate interaction effect with the other two environments. However, these three environments showed little variation in main effect with each other. Similar findings were reported by Shanmuganathan (2005).
The parent TP 1021 R and the hybrids viz., IR
ISSN 0975-928X
137
IR 75601 A X IR 72865 R, IR 75601 A X RR 347 R, IR 75596 A X MDU 5 R, IR 75596 A X ASD 06-8 R, CRMS 32 A X IR 62037 R, CRMS 32 A X TP 1021 R and IR 75608 A X ASD 06-8 R showed IPCA 1 score close to zero with high main effects indicating that these varieties were less influenced by environments (Table 2). Hence, the above said hybrids are stable and had general adaptability for all the environments. Since, the environments E3 had positive IPCA 1 score and high mean, it had positive interaction with these genotypes and this environment was considered as the stable environment for these hybrids. Similar results were
observed by Mahalingam et al. (2006). Among the
parents, APMS 6 A and IR 72081 A and the
hybrids viz., IR 80559 A X MDU 5 R, IR 80559 A
X ACK 99017 R, APMS 6 A X ACK 99017 R, APMS 6 A X TP1021 R, IR 72081 A X IR 68427 R, IR 72081 A X RR 347 R and CRMS 32 A X RR 363 R exhibited high main effect with positive IPCA 1 score. Hence, they were identified as specifically adapted to favourable locations.
On the other hand, the hybrids viz., APMS 6 A X
RR 347 R, APMS 6 A X
ASD 06-8 R, IR 72081 A X IR 62037 R, IR 72081
A X MDU 5 R, IR 72081 A X
TP 1021 R, IR 72081 A X ASD 06-8 R, IR 75601
A X IR 72865 R, IR 75601 A X
MDU 5 R, IR 75601 A X ACK 99017 R, IR 75601
A X RR 286 R, IR 75596 A X
MDU 5 R, IR 75596 A X TP 1021 R, IR 75596 A
X RR 363 R, IR 80154 A X
IR 62037 R and CRMS 32 A X IR 62037 R had negative IPCA 1 score with high main effect. The environment E1 and E2 had negative IPCA 1 score
and these were considered as favourable
environments for the above said hybrids.
Proximity of genotype points to environment points does not indicate a higher level of adaptation. The best adapted genotype can plot far from the environment. AMMI 1 predicted response for APMS 6 A in E3 was 40.14 g. The AMMI I predicted response for IR 80559 A X MDU 5 R in E3 was 49.85g The estimated yield showed that IR 80559 A X MDU 5 R was highly adapted to E3 than APMS 6A though it occupied closely to this environment demonstrating that proximity of genotypes to environment does not indicate a high level of adaptation.
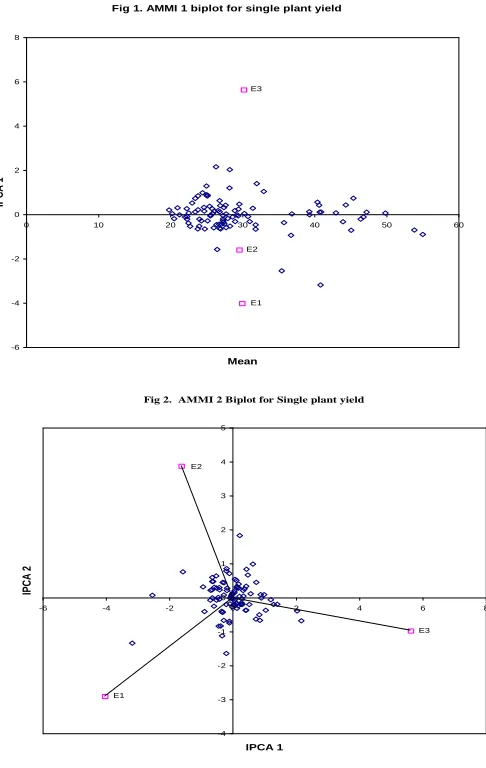
In AMMI 2 biplot, the environment scores are joined to the origin by side lines. Sites with short spokes do not exert strong interactive forces. Those with long spokes exert strong interaction. The environment, E3 had long spokes and hence exerted strong interaction while
the E1 and E2 had short spokes with the origin and they did not exert strong interactive forces (Fig 2).
The interaction of genotypes with sites can be read directly from the biplot by projecting genotype marks on the site lines. If the projection falls on to a site line then that genotype is positively adapted to that site. In the Fig. 3, the projection line of the genotype IR 80154 A X MDU 5 R fell on the site line of environment E3 and RR 347 R in E2 indicating that these had a positive interaction with E3 and E2 respectively. On the other hand, the site line must be extended back through the origin to meet the projection, and then the genotype has negative interaction with that site. The projection line of the genotype IR 75596 A X TP 1021 R fell on the extended portion of the site line E1. Hence, it had a negative interaction with that environment.
The genotypes occurring close together on the plot will tend to have similar yields in all environments, while genotypes apart may either differ in mean yield or showed pattern of response over the
environments. The genotypes viz., IR 80559 A X TP
1021 R, IR 72081 A X IR 68427 R, IR 75596 A X IR 72865 R, CRMS 32 A X RR 363 R A, IR 75608 A X IR 68427 R and CRMS 32 A X MDU 5 R were very close to the centre of the origin. Genotypes near the origin are non sensitive
to environmental interactive
forces and those distant from the origins are
sensitive and have large interaction
(Shinde et al., 2002). Adaptation of different
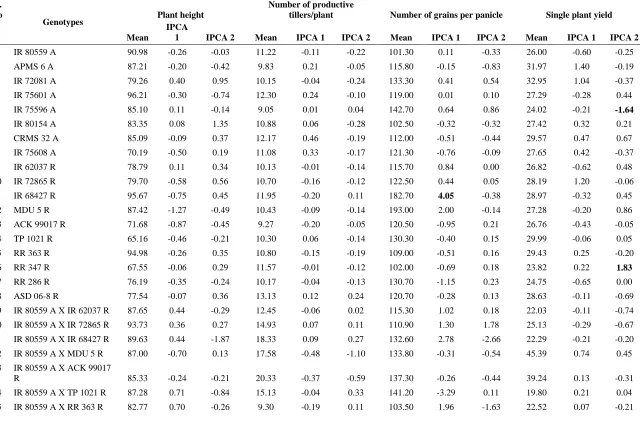
genotypes based on AMMI 1 biplot for single plant yield has been shown in table 3. The following
hybrids viz., IR 80559 A X ACK 99017 R, APMS 2
A X ACK 99017 R, IR 72081 A X IR 68427 R, IR 72081 A X RR 347 R and CRMS 32 A X RR 363 R found to have also high pooled per se performance,
sca, heterosis and utilized for further breeding
programme (Table 4).
References
Ebdon, J.S., and H.G. Gauch, Jr. 2002. Additive main effect and multiplicative interaction analysis of national turfgrass performance trials: II. Cultivar recommendations. Crop Sci., 42:497–506. Eberhart, S.A. and W.A. Russell. 1966. Stability
parameters for comparing varieties. Crop Sci., 6: 36-40.
138 Performances in Rice Genotypes Across
Environments. Asian J. of Plant Sci., 8: 48-53.
Mahalingam, L., S. Mahendran, R. Chandra Babu and G.Atlin. 2006. AMMI analysis for stability of grain yield in Rice (Oryza sativa L.). International J. of Botany, 2: 104-106.
Perkins, J. M. and J. L. Jinks. 1968. Environmental and genotype-environmental components of variability. III. Multiple line and crosses. Heredity, 23(4): 339-356.
Shanmuganathan, M. 2005. Phenotypic stability by ammi analysis for single plant yield in rice hybrid. Int. J. of Plant Sci., 1: 50-52.
Shinde, G.C., M.T. Bhingarde and S.S. Mehetre. 2012. AMMI analysis for stability of grain yield of pearl millet hybrids. Ind. J. Genet., 62: 215-217.
ISSN 0975-928X
139 Table 1. ANOVA for stability (AMMI) for different quantitative characters
Source df PH NPT NG SPY Percentage sum of squares for yield
Genotypes 99 109.94** 71.88** 1530.00** 186.59** 85.39
Environment 2 1158.75** 77.98** 49.91** 10.13** 0.001
G x E interaction 198 30.98** 2.58** 252.45** 15.86** 0.12
IPCA 1 100 54.18** 3.68** 393.53** 25.47** 0.12
IPCA 2 98 7.30** 1.46** 108.87** 6.06** 0.03
** Significant at 1% level
Table 3. Adaptation of parents and hybrids for single plant yield based on AMMI 1model
High mean and positive IPCA
High mean and negative IPCA
Low mean and positive IPCA
Low mean and negative IPCA
APMS 6 A IR 72081 A
IR 80559 A X MDU 5 R IR 80559 A X ACK 99017 R
IR 80559 A X RR 286-1 R APMS 6 A X IR 62037 R APMS 6 A X ACK 99017 R
APMS 6 A X TP 1021 R IR 72081 A X IR 68427 R IR 72081 A X RR 347-1 R IR 75601 A X IR 72865 R IR 75601 A X RR 347 R IR 75596 A X ASD 06-8 R CRMS 32 A X RR 363 R IR 75608 A X ASD 06-8 R
APMS 6 A X RR 347 R APMS 6 A X ASD 06-8 R IR 72081 A X IR 62037 R IR 72081 A X MDU 5 R IR 72081 A X TP 1021 R IR 72081 A X ASD 06-8 R IR 75601 A X MDU 5 R IR 7560 A X ACK 99017 R IR 75601 A X RR 286 R IR 75596 A X MDU 5 R IR 75596 A X TP 1021 R IR 75596 A X RR 363 R IR 80154 A X IR 62037 R CRMS 32 A X IR 62037 R
IR 80154 A CRMS 32 A IR 75608 A IR 72865 A RR 363 R RR 347 R
IR 80559 A X TP 1021 R IR 80559 A X RR 363 R IR 80559 A X ASD 06-8 R APMS 6 A X MDU 5 R APMS 6 A X RR 363 R IR 72081 A X RR 363 R IR 72081 A X ACK 990 17 R
IR 72081 A X RR 286 R IR 75601 A X IR 62037 R IR 75601 A X IR 68427 R IR 75601 A X ASD 06-8 R IR 75596 A X IR 72865 R IR 75596 A X IR 68427 R IR 75596 X ACK 99017 R IR 80154 A X IR 72865 R IR 80154 A X IR 68427 R IR 80154 A X MDU 5 R IR 80154 A X ACK 99017 R
IR 80154 A X RR 363 R IR 80154 A X RR 347 R CRMS 32 A X IR 68427 R CRMS 32 A X MDU 5 R CRMS 32 A X ACK 99017 R
IR 75608 A X IR 72865 R IR 75608 A X IR 68427 R IR 75608 A X MDU 5 R IR 75608 A X TP 1021 R IR 75608 A X RR 286 R
IR 80559A IR 75601A IR 75596A IR 62037 R IR 68427 R MDU 5 R ACK 99017R TP 1021R RR 286 R ASD 06-8 R
IR 80559 A X IR 62037 R IR 80559 A X IR 72865 R IR 80559 A X IR 68427 R APMS 6 A X IR 72865 R APMS 6 A X IR 68427 R APMS 6 A X RR 286 R IR 75601 A X TP 1021 R IR 75601 A X RR 363 R IR 75596 A X IR 62037 R IR 75596 A X RR 347 R IR 80154 A X TP 1021 R IR 80154 A X RR 286 R IR 80154 A X ASD 06-8 R CRMS 32 A X IR 72865 R CRMS 32 A X RR 347 R CRMS 32 A X RR 286 R CRMS 32 A X ASD 06-8 R IR 75608 A X IR 62037 R IR 75608 A X ACK 99017 R
140 Table 2. Estimates of stability parameters (AMMI) for quantitative traits
Sl. No
Genotypes Plant height
Number of productive
tillers/plant Number of grains per panicle Single plant yield
Mean
IPCA
1 IPCA 2 Mean IPCA 1 IPCA 2 Mean IPCA 1 IPCA 2 Mean IPCA 1 IPCA 2
1 IR 80559 A 90.98 -0.26 -0.03 11.22 -0.11 -0.22 101.30 0.11 -0.33 26.00 -0.60 -0.25
2 APMS 6 A 87.21 -0.20 -0.42 9.83 0.21 -0.05 115.80 -0.15 -0.83 31.97 1.40 -0.19
3 IR 72081 A 79.26 0.40 0.95 10.15 -0.04 -0.24 133.30 0.41 0.54 32.95 1.04 -0.37
4 IR 75601 A 96.21 -0.30 -0.74 12.30 0.24 -0.10 119.00 0.01 0.10 27.29 -0.28 0.44
5 IR 75596 A 85.10 0.11 -0.14 9.05 0.01 0.04 142.70 0.64 0.86 24.02 -0.21 -1.64
6 IR 80154 A 83.35 0.08 1.35 10.88 0.06 -0.28 102.50 -0.32 -0.32 27.42 0.32 0.21
7 CRMS 32 A 85.09 -0.09 0.37 12.17 0.46 -0.19 112.00 -0.51 -0.44 29.57 0.47 0.67
8 IR 75608 A 70.19 -0.50 0.19 11.08 0.33 -0.17 121.30 -0.76 -0.09 27.65 0.42 -0.37
9 IR 62037 R 78.79 0.11 0.34 10.13 -0.01 -0.14 115.70 0.84 0.00 26.82 -0.62 0.48
10 IR 72865 R 79.70 -0.58 0.56 10.70 -0.16 -0.12 122.50 0.44 0.05 28.19 1.20 -0.06
11 IR 68427 R 95.67 -0.75 0.45 11.95 -0.20 0.11 182.70 4.05 -0.38 28.97 -0.32 0.45
12 MDU 5 R 87.42 -1.27 -0.49 10.43 -0.09 -0.14 193.00 2.00 -0.14 27.28 -0.20 0.86
13 ACK 99017 R 71.68 -0.87 -0.45 9.27 -0.20 -0.05 120.50 -0.95 0.21 26.76 -0.43 -0.05
14 TP 1021 R 65.16 -0.46 -0.21 10.30 0.06 -0.14 130.30 -0.40 0.15 29.99 -0.06 0.05
15 RR 363 R 94.98 -0.26 0.35 10.80 -0.15 -0.19 109.00 -0.51 0.16 29.43 0.25 -0.20
16 RR 347 R 67.55 -0.06 0.29 11.57 -0.01 -0.12 102.00 -0.69 0.18 23.82 0.22 1.83
17 RR 286 R 76.19 -0.35 -0.24 10.17 -0.04 -0.13 130.70 -1.15 0.23 24.75 -0.65 0.00
18 ASD 06-8 R 77.54 -0.07 0.36 13.13 0.12 0.24 120.70 -0.28 0.13 28.63 -0.11 -0.69
19 IR 80559 A X IR 62037 R 87.65 0.44 -0.29 12.45 -0.06 0.02 115.30 1.02 0.18 22.03 -0.11 -0.74
20 IR 80559 A X IR 72865 R 93.73 0.36 0.27 14.93 0.07 0.11 110.90 1.30 1.78 25.13 -0.29 -0.67
21 IR 80559 A X IR 68427 R 89.63 0.44 -1.87 18.33 0.09 0.27 132.60 2.78 -2.66 22.29 -0.21 -0.20
22 IR 80559 A X MDU 5 R 87.00 -0.70 0.13 17.58 -0.48 -1.10 133.80 -0.31 -0.54 45.39 0.74 0.45
23 IR 80559 A X ACK 99017
R 85.33 -0.24 -0.21 20.33 -0.37 -0.59 137.30 -0.26 -0.44 39.24 0.13 -0.31
24 IR 80559 A X TP 1021 R 87.28 0.71 -0.84 15.13 -0.04 0.33 141.20 -3.29 0.11 19.80 0.21 0.04
ISSN 0975-928X
141
26 IR 80559 A X RR 347 R 86.33 0.22 -0.41 11.30 -0.59 0.42 150.60 0.52 1.98 25.56 -0.02 -0.27
27 IR 80559 A X RR 286 R 86.23 -0.36 -0.75 20.40 -0.22 0.23 156.30 3.01 -0.97 42.95 0.08 -0.04
28 IR 80559 A X ASD 06-8 R 89.27 1.81 -0.52 9.37 -0.14 0.17 76.02 -1.34 -1.31 23.43 0.12 -0.16
29 APMS 6 A X IR 62037 R 88.30 0.24 0.39 24.17 -0.43 0.31 124.50 2.45 -1.17 47.20 0.11 0.51
30 APMS 6 A X IR 72865 R 78.03 0.49 0.21 17.10 -0.01 -0.39 130.00 2.80 1.85 26.39 -0.45 -0.84
31 APMS 6 A X IR 68427 R 79.92 -1.27 -0.81 8.28 -0.26 -0.26 120.60 0.69 0.76 25.54 -0.06 -0.01
32 APMS 6 A X MDU 5 R 80.23 0.81 0.11 10.60 -0.21 -0.02 137.00 1.20 1.01 22.26 0.27 -0.15
33 APMS 6 A X ACK 99017
R 82.90 0.89 0.08 24.53 0.76 -0.54 162.40 0.01 0.07 40.61 0.42 0.34
34 APMS 6 A X TP 1021 R 82.70 1.04 -1.02 26.60 -0.19 0.11 170.10 0.31 0.71 44.34 0.43 0.84
35 APMS 6 A X RR 363 R 76.17 0.27 -0.79 14.80 0.13 0.07 83.93 -0.77 0.31 20.23 0.04 -0.08
36 APMS 6 A X RR 347 R 98.10 1.00 0.11 22.30 -0.05 0.37 126.10 0.36 -0.33 55.00 -0.90 -0.41
37 APMS 6 A X RR 286 R 86.02 1.07 -0.11 14.77 0.25 0.10 121.60 0.19 -0.03 29.24 -0.01 -0.03
38 APMS 6 A X ASD 06-8 R 78.20 0.25 0.03 15.57 0.19 0.08 106.20 -0.45 -0.04 31.01 -0.32 -0.42
39 IR 72081 A X IR 62037 R 83.60 1.37 0.24 25.00 -0.45 -0.12 126.50 0.25 -0.34 36.73 -0.94 0.32
40 IR 72081 A X IR 72865 R 79.90 0.87 0.17 14.20 -0.17 -0.31 121.80 -0.19 0.00 20.50 -0.19 0.21
41 IR 72081 A X IR 68427 R 85.28 0.24 0.13 28.10 -0.39 0.24 170.70 0.07 0.23 40.72 0.11 -0.18
42 IR 72081 A X MDU 5 R 87.70 -0.32 -0.38 23.57 -0.12 0.62 158.70 -0.14 -0.20 43.92 -0.33 -0.43
43 IR 72081 A X ACK 99017
R 94.37 -0.30 0.13 20.53 -0.28 0.08 91.12 1.08 -0.32 28.91 0.18 0.29
44 IR 72081 A X TP 1021 R 95.77 -1.29 -0.65 24.93 -0.04 0.14 182.00 -0.03 0.03 53.83 -0.70 0.22
45 IR 72081 A X RR 363 R 79.57 -0.42 -0.63 11.63 0.09 -0.40 113.30 0.68 -0.75 23.81 0.85 -0.67
46 IR 72081 A X RR 347 R 79.37 -0.90 -0.28 14.47 0.25 0.25 110.20 0.97 -0.31 31.42 0.29 -0.04
47 IR 72081 A X RR 286 R 86.05 -0.78 0.05 15.43 0.00 -0.25 110.30 0.69 -0.54 26.81 0.63 0.99
48 IR 72081 A X ASD 06-8 89.43 0.67 -1.30 17.57 0.28 0.07 128.10 2.23 -0.48 31.80 -0.46 0.01
49 IR 75601 A X IR 62037 R 87.57 0.06 -0.09 16.80 -0.03 0.16 119.10 1.62 -0.24 25.42 0.37 0.26
50 IR 75601 A X IR 72865 R 84.83 -0.18 -0.78 23.30 0.44 0.09 144.50 -0.56 -1.03 49.82 0.07 0.54
51 IR 75601 A X IR 68427 R 89.73 -1.51 -0.36 19.73 -0.13 -0.38 113.20 -0.23 -0.38 27.70 0.03 -0.21
52 IR 75601 A X MDU 5 R 85.30 -0.15 0.02 21.70 0.74 0.47 180.30 -0.79 -1.50 46.80 -0.11 0.71
53 IR 75601 A X ACK 99017
R 84.97 1.05 -0.41 16.30 -0.42 0.08 117.20 -0.55 0.03 31.81 -0.66 0.23
142
55 IR 75601 A X RR 363 R 83.43 0.11 -1.76 14.87 0.75 -1.04 141.50 3.71 0.84 22.50 -0.38 -0.83
56 IR 75601 A X RR 347 R 86.60 0.30 0.45 24.43 0.12 -0.05 146.60 -0.40 -0.71 36.85 0.03 -0.20
57 IR 75601 A X RR 286 R 89.50 0.11 -0.11 25.20 -0.09 -0.16 148.00 -0.38 -0.66 45.08 -0.71 -0.07
58 IR 75601 A X ASD 06-8
R 84.30 -0.18 -0.04 17.67 -0.29 0.29 107.30 -0.99 1.35 26.07 0.16 -0.24
59 IR 75596 A X IR 62037 R 81.93 -0.31 0.42 13.03 -0.48 -0.07 118.80 1.28 0.54 22.29 -0.09 -0.18
60 IR 75596 A X IR 72865 R 84.27 0.15 -0.41 12.63 -0.78 0.03 134.90 -2.77 0.35 23.00 0.52 -0.20
61 IR 75596 A X IR 68427 R 91.10 0.03 0.26 17.33 -1.49 -1.27 106.30 0.81 -0.06 24.43 0.99 0.09
62 IR 75596 A X MDU 5 R 81.03 -0.51 0.30 25.17 0.15 0.17 153.30 -0.70 -1.32 46.38 -0.21 0.79
63 IR 75596 X ACK 99017 R 87.98 -0.12 0.42 16.15 0.69 0.02 116.80 -1.62 0.78 24.97 0.90 -0.01
64 IR 75596 A X TP 1021 R 90.40 0.81 0.22 21.00 -0.23 0.53 115.20 -2.10 1.10 40.82 -3.18 -1.34
65 IR 75596 A X RR 363 R 88.53 -0.05 0.05 16.58 -0.72 0.51 127.50 1.47 4.85 35.45 -2.54 0.07
66 IR 75596 A X RR 347 R 88.70 1.44 0.20 15.70 0.52 0.05 101.90 -0.24 0.56 23.98 -0.52 0.29
67 IR 75596 A X RR 286 R 95.80 -1.70 0.30 13.92 0.01 -0.02 106.00 -1.08 -1.33 24.27 -0.29 0.08
68 IR 75596 A X ASD 06-8 82.43 -0.92 0.29 23.77 -0.07 -0.48 131.80 -0.18 -0.27 40.90 0.12 0.30
69 IR 80154 A X IR 62037 R 77.27 -0.05 0.36 21.32 0.27 0.20 135.20 -0.20 -0.31 35.76 -0.36 -0.40
70 IR 80154 A X IR 72865 R 82.40 -0.57 0.09 17.17 0.28 0.11 98.00 -2.16 0.35 20.96 0.31 -0.19
71 IR 80154 A X IR 68427 R 82.43 0.19 0.43 12.33 0.09 -0.06 105.90 -1.05 0.15 28.21 2.03 -0.39
72 IR 80154 A X MDU 5 R 78.45 -0.83 -0.13 11.50 0.36 -0.20 110.90 -0.69 -0.60 26.31 2.16 -0.68
73 IR 80154 A X ACK
99017 R 79.68 -1.85 0.26 13.33 0.50 0.29 127.60 -1.55 -2.85 24.67 0.16 0.29
74 IR 80154 A X TP 1021 R 74.18 -0.61 0.54 18.37 -0.34 -0.51 119.50 -1.00 -2.02 27.11 -0.43 0.30
75 IR 80154 A X RR 363 R 78.47 -2.58 0.40 13.00 1.52 -0.29 104.70 -1.37 -0.46 25.15 0.88 0.09
76 IR 80154 A X RR 347 R 85.23 0.54 0.84 16.43 0.58 -0.05 111.20 0.32 2.89 24.99 1.29 -0.20
77 IR 80154 A X RR 286 R 81.60 -0.86 -0.15 13.53 -0.31 0.44 91.87 0.14 -0.41 26.47 -1.58 0.76
78 IR 80154 A X ASD 06-8 84.80 0.58 -0.24 18.50 -1.29 -0.32 100.30 -0.06 -0.10 21.24 -0.01 0.11
79 CRMS 32 A X IR 62037
ISSN 0975-928X
143 80 CRMS 32 A X IR 72865
R 87.63 1.89 0.16 19.97 -0.32 0.24 113.90 0.62 1.68 27.30 -0.04 0.08
81 CRMS 32 A X IR 68427
R 78.67 0.01 0.20 12.63 0.15 0.26 116.80 -1.44 1.54 26.81 0.13 0.33
82 CRMS 32 A X MDU 5 R 92.50 1.76 0.29 20.27 0.03 -0.03 101.30 -0.97 -0.63 25.86 0.05 0.20
83 CRMS 32 A X ACK
99017 R 80.30 0.83 0.16 17.50 0.36 0.13 99.63 0.03 -0.23 26.58 0.18 0.40
84 CRMS 32 A X TP 1021 R 84.50 1.98 0.74 21.93 -0.18 0.20 97.30 0.83 0.22 30.76 -0.09 -0.01
85 CRMS 32 A X RR 363 R 77.83 1.32 0.14 25.07 -0.14 -0.21 115.50 0.40 0.88 40.40 0.56 0.12
86 CRMS 32 A X RR 347 R 81.33 2.16 0.35 20.47 0.36 0.03 97.17 -1.55 0.04 22.71 -0.53 0.64
87 CRMS 32 A X RR 286 R 78.77 -0.58 0.19 10.98 0.11 -0.11 94.45 -0.85 -0.27 26.95 -0.65 0.48
88 CRMS 32 A X ASD 06-8
R 86.93 1.33 0.43 20.65 0.49 0.39 97.37 -4.90 0.64 23.80 -0.65 0.60
89 IR 75608 A X IR 62037 R 80.17 -0.89 0.25 16.23 0.68 0.17 101.50 1.36 -0.65 27.49 -0.42 0.23
90 IR 75608 A X IR 72865 R 79.33 -0.21 0.14 15.45 0.37 0.19 106.10 0.61 -1.37 23.43 0.73 -0.63
91 IR 75608 A X IR 68427 R 81.33 -0.74 0.45 14.53 0.22 0.32 107.70 -0.47 -0.46 26.92 0.40 -0.37
92 IR 75608 A X MDU 5 R 81.30 -1.44 0.07 19.42 -0.18 0.58 114.30 -2.32 1.82 25.76 0.27 -0.20
93 IR 75608 A X ACK 99017
R 92.70 0.10 0.16 15.18 0.44 0.28 104.90 -2.28 -0.86 27.97 -0.18 0.28
94 IR 75608 A X TP 1021 R 80.13 0.18 0.22 17.33 -0.14 0.25 101.40 0.99 -0.13 25.10 0.84 -0.50
95 IR 75608 A X RR 363 R 79.52 0.24 0.70 15.37 -1.42 0.83 120.50 2.39 -0.18 27.38 -0.34 -1.12
96 IR 75608 A X RR 347 R 78.03 -0.82 0.65 16.63 -0.33 0.81 101.20 1.88 -0.12 28.25 -0.52 -0.07
97 IR 75608 A X RR 286 R 84.33 -1.56 0.62 12.93 0.44 0.15 104.00 -0.84 0.20 24.65 0.33 0.05
98 IR 75608 A X ASD 06-8
R 82.63 -0.15 0.33 15.53 0.83 0.09 99.13 -1.93 0.32 30.26 0.05 0.15
99 CORH 3 87.21 -0.47 -0.73 13.88 -0.23 -0.18 103.60 -0.29 0.13 29.36 0.05 -0.47
10 0
CO (R) 48
87.35 -0.22 0.17 11.57 -0.05 -0.17 91.20 -0.32 0.14 29.12 -0.05 0.13
E1 80.13 3.33 3.71 15.32 -2.40 -2.09 120.30 6.57 6.81 29.98 -4.03 -2.91 E2 85.19 3.67 -3.59 16.40 -1.11 2.69 121.70 4.89 -7.51 29.59 -1.61 3.87 E3 86.60 -7.00 -0.12 17.07 3.49 -0.59 121.00 -11.46 0.71 30.22 5.63 -0.98
144 Table 4. Hybrids selected for per se performance, sca effects and standard heterosis in three environments
Characters per se performance sca effects Heterosis per cent
Single plant yield IR 80559 A X MDU 5
IR 80559 A X ACK 99017 IR 80559 A X RR 286-1 APMS 2 A X ACK 99017
APMS 2 A X TP 1021 APMS 2 A X RR 347-1
IR 72081 A X IR 62037-93-1-3-1-1
IR 72081 A X IR 68427-8-3-3-2
IR 72081 A X MDU 5 IR 72081 A X TP 1021
IR 75601 A X IR 72865-94-3-3-2
IR 75601 A X MDU 5 IR 75601 A X RR 347-1 IR 75596 A X MDU 5
IR 75601 A X RR 286-1
IR 75596 A X ASD 06-8
IR 80154 A X IR 62037-93-1-3-1-1 CRMS 32 A X IR 62037-93-1-3-1-1 CRMS 32 A X RR 363-1
IR 80559 A X ACK 99017 IR 80559 A X RR 286-1
APMS 2 A X IR 62037-93-1-3-1-1
APMS 2 A X ACK 99017
APMS 2 A X RR 347-1
IR 72081 A X IR 68427-8-3-3-2
IR 72081 A X TP 1021
IR 75601 A X IR 72865-94-3-3-2 IR 75601 A X RR 286-1
IR 75596 A X MDU 5
IR 80154 A X IR 62037-93-1-3-1-1 CRMS 32 A X IR 62037-93-1-3-1-1 CRMS 32 A X RR 363-1
IR 75608 A X ASD 06-8
IR 80559 A X MDU 5
IR 80559 A X ACK 99017 IR 80559 A X RR 286-1
APMS 2 A X IR 62037-93-1-3-1-1
APMS 2 A X ACK 99017
APMS 2 A X TP 1021
IR 72081 A X IR 68427-8-3-3-2
IR 72081 A X MDU 5
IR 75601 A X IR 72865-94-3-3-2
IR 75601 A X MDU 5 IR 75601 A X RR 347-1
IR 75601 A X RR 286-1
ISSN 0975-928X
145
Fig 1. AMMI 1 biplot for single plant yield
-6 -4 -2 0 2 4 6 8
0 10 20 30 40 50 60
Mean
IPC
A
1
E1 E2
E3
Fig 2. AMMI 2 Biplot for Single plant yield
-4 -3 -2 -1 0 1 2 3 4 5
-6 -4 -2 0 2 4 6 8
IPCA 1
IPC
A
2
E2
E3
E1
-4 -3 -2 -1 0 1 2 3
En
v
ir
o
n
m
e
n
ta
l
in
d
ic
e
s
DF PH NPT PL SB 100 GW NG SPY
Characters
E1 E2 E3