IJOH | | Vol. 6 | No. 2 | 96-100 * Corresponding author: Iraj Mohammadfam, Email:
O
O
RRIIGGIINNAALLA
A
RRTTIICCLLEEEvaluation of the Implementation of a Computerized
Maintenance Management System on the
Maintenance and Safety KPIs
IRAJ MOHAMMADFAM*1, FAEZEH BAHMANI2, and SHAHRAM MAHMOUDI3 1*
Department of Occupational Hygiene, School of Public Health, Hamadan University of Medical Sciences, Hamadan, Iran; 2Information Engineering Section, Quality & Systems Department, MAPNA Co., Tehran, Iran; 3Safety Section,
Quality & Systems Department, MAPNA Co., Tehran, Iran.
Received November 28, 2013; Revised February 21, 2014; Accepted March 16, 2014
This paper is available on-line at http://ijoh.tums.ac.ir
ABSTRACT
Since maintenance plays a key role in a company's overall performance, the main goal of this study was to provide a managerial tool for constantly monitoring and improving maintenance KPIs. This was achieved by designing and implementing a Computerized Maintenance Management System (CMMS) in an Iranian mid-size plant, manufacturing power plant utilities. In this study, CMMS software was developed and deployed in order to both monitor and optimize safety and maintenance KPIs. Selected KPIs were measured yearly; before, during and 12 and 24 months after intervention. Longitudinal Data Analysis and Mixtur Model were employed to compare the improvement trend of KPIs. Results show that at the end of the intervention year, KPIs other than Mean Time to Repair (MTTR) improved. Moreover, the improvement trend of the KPIs other than MTTR continued even 12 months after intervention was stopped. Similarly, although the “LWD” safety KPI had an overall improvement, comparing its figure before and after intervention, there was a significant decrease during the last 6 months of intervention. After the deployment of the CMMS, MTTR KPI increased surprisingly. Furthermore, the decrease in the “LWD” KPI revealed that off-the-job safety has a key role.
Keywords: CMMS, Maintenance, Safety, KPIs, Manufacturing
INTRODUCTION
Nowadays, the significance of the maintenance function has increased due to two major factors: (1) Increased emphasis on system productivity, availability and safety, product quality, customer satisfaction, (2) Diminishing net revenues [1-2]. Maintenance defines a company's ability to compete with others in terms of cost, quality and delivery performance (maintenance synchronized with production requirements) [3-4].
In many big companies, maintenance costs can constitute up to 40% of the overall operational budget
[5]. Thus, improving maintenance effectiveness could lead to financial savings. Some studies indicated that in some industries, maintenance is the second highest or even the highest element of the operating costs [6-7]. Thus, the potential savings from enhanced maintenance are considerable in countries where advanced maintenance actions have yet to be good passed [5]. In addition, the efficacy of maintenance directly affects the production volume, fixed and operating costs, environmental and employee safety [8].
Performance measurement is the cornerstone of management. Like other manufacturing functions, performance measurement is important in managing the maintenance function. Well-defined performance INTERNATIONAL JOURNAL OF OCCUPATIONAL HYGIENE
Copyright © 2014 by Iranian Occupational Health Association (IOHA)
indicators would enable the identification of performance gaps between the current and desired performance and would enable the monitoring of the progress moving from the current state to the desired one [9]. Moreover, performance measures connect strategies with management action and backing the implementation and execution of improvement initiatives [10-12]. Furthermore, they can assist maintenance manager‘s focus their staff and resources on particular areas of production that most affect manufacturing performance.
One kind of performance measurement is key performance indicator (KPI). KPIs define a set of values, which could be used as a baseline for measurements. Three groups of the commonly used measures of maintenance performance are: (1) measures of equipment performance, (2) measures of cost performance and (3) measures of process performance [13-14].
The European standard for maintenance KPIs provides three basic groups of indicators named: economic, technical and organizational indicators [15].
The other commonly used classification is active and passive indicators. Active indicators screen whether the tasks are being performed that will ‗lead to outcomes‘. On the other hand, passive indicators screen whether the results have been achieved. Both active and passive indicators are therefore important for managing the performance of the maintenance function. In addition, the active indicators are even more important than the passive ones because they have the potential to thwart the occurrence of unfavorable situations [16].
Maintenance active indicators monitor whether the tasks are being performed such that the desired production results can be attained. The maintenance process is addressed through identifying work based on maintenance objectives and performance gaps, planning, scheduling, and executing work [17].
The passive indicators are used to measure maintenance results in terms of equipment performance and maintenance cost [9].
Studies report that Computerized Maintenance Management Systems (CMMSs) lead to increased equipment availability and better control of the maintenance activities [18].
Several authors present models to encourage the use of computers for maintenance activities and give estimates of the potential savings [19]. In addition, many publications shed lights on the benefits of using an IT-Based Maintenance [20]. CMMSs cause important savings of maintenance costs especially in the realms of labor, parts, and downtime. Studies have shown a 10% to 20% decrease in maintenance labor costs and a 10% to 15% decreases in pieces cost after the implementation of a CMMS [21]. Moreover, extracting maintenance performance indicators and tracking them can be done much effective using
In this study, we chose the leading maintenance
KPIs of preventive maintenance/emergency
maintenance ManHour% (PM/EM ManHour%) and mean time to repair (MTTR), the lagging KPIs of mean time between failures (MTBF) and availability and the safety KPIs of lost work day (LWD) and lost time case (LTC).
The primary goal of this study was to provide a managerial tool for constantly monitoring and improving these KPIs. This was achieved by designing and implementing a CMMS in an Iranian mid-size plant in 2008. At the time of this study, this company had almost 250 manufacturing equipment and 650 non-manufacturing equipment.
MATERIALS AND METHODS
This study was an intervention research in which a CMMS was developed and deployed in order to monitor maintenance KPIs and optimize both safety and maintenance KPIs. The project consisted of the five major stages:
1. The selection of KPIs
2. The measurement of the chosen KPIs
3. The selection of software development methodology
4. Software development and deployment 5. The re-measurement of the KPIs
In order to identify the KPIs we took into account the following: results of previous studies, the nature of our industry and the constraints regarding the availability of data. We chose the maintenance leading KPIs of PM/EM ManHour % and MTTR, the lagging maintenance KPIs of MTBF and Availability and the safety KPIs of LWD and LTC [22].
Next, considering the special requirements of the project, we decided to use Agile Software development as our development methodology. In this methodology, self-organizing cross-functional teams collaborate to evolve requirements and solutions. The Agile Manifesto, published in 2001, emphasizes four core values:
• Individuals and interactions rather than processes and tools.
• Working software instead of comprehensive documentation.
• Customer collaboration over contract negotiation. • Responding to change over following a plan. Next, the software development phase was carried out. It consisted of these steps: Project Planning, Systems analysis and requirements engineering, systems design, implementation, testing and debugging.
definition of the users‘ requirements. Several meetings were held in which the end-users and the software development team exchanged opinions on the requirements list and reached a conclusion. Next, Systems Design was performed in which the desired features and operations were agreed on in detail and were documented, the screen layouts were decided on and documented and the business rules were figured out elaborately and the process diagrams were documented. Then, the Implementation phase started during which the real code was written. The project was divided into several modules. Firstly, the basic data input forms including equipment entry form, personnel entry form and materials and spare parts entry form were developed and deployed. Then, the emergency maintenance, the preventive maintenance and the report generation modules were implemented one after the other. Meanwhile, ―Prototyping‖ was used in order to ensure a common understanding between the developers and the end-users. In other words, the development team had a constant interaction with the potential users of the software, provided them with the incomplete versions of the software, and got their feedback. Next, Testing and Debugging phases were executed. This software was developed using C#.Net and Microsoft SQL Server Database. The software‘s development cycle took almost one year.
Finally, to evaluate the efficiency of the mentioned software, the mentioned KPIs were re-measured during, 12 and 24 months after intervention. Obviously, no other intervention was done between 2008 and 2011 in order to improve these KPIs. In addition, there were no significant changes in the maintenance department management‘s policy and its number of staff during these years. Up to now, 14771 equipment emergency requests, 7087 installation emergency requests and
17049 pm work orders have been recorded in this CMMS.
RESULTS
The description of gathered data was done using average and deviation. Longitudinal data analysis and mixture model were used in order to compare the improvement trend of KPIs before, during and after intervention. In addition, the data analysis software was R2.12.1. All statistical tests were two-sided and performed at the 0.05 level of significance.
Trend Analysis
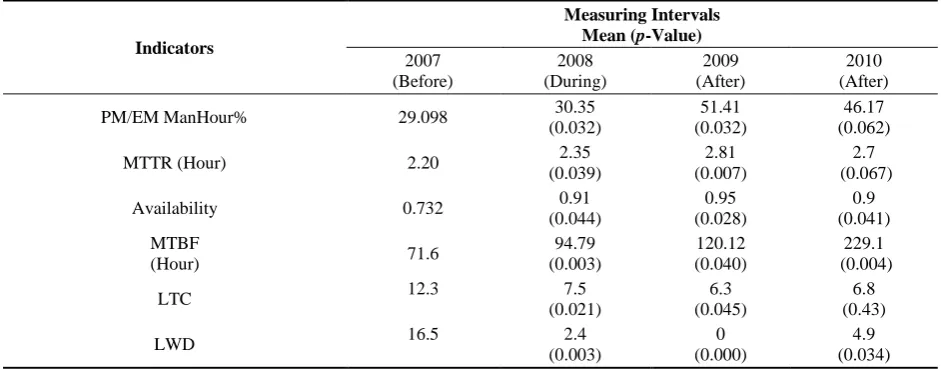
The results of comparing the change process in variables before and after intervention are summarized in Table 1.
Results show that at the end of the intervention year, KPIs other than MTTR improved and this improvement is of statistical significance (p-Value <0.05). It also became clear that even 12 months after stopping the intervention, the improvement trend of the KPIs other than MTTR continued at a significant rate(p <0.05). Moreover, 24 months after stopping the intervention, the improvement trend of PM/EM ManHour % and availability decreased insignificantly compared with the previous period. Meanwhile, the improvement trend of MTTR and LTC increased insignificantly and MTBF and LWD improvement trend increased significantly (p<0.05).
DISCUSSION
After the deployment of the CMMS, more potential sources of failure were pinpointed, thus more efficient preventive tasks were defined [23].
Table 1. Comparing the change process in variables
Indicators
Measuring Intervals Mean (p-Value)
2007 (Before)
2008 (During)
2009 (After)
2010 (After) PM/EM ManHour% 29.098 30.35
(0.032)
51.41 (0.032)
46.17 (0.062)
MTTR (Hour) 2.20 2.35
(0.039)
2.81 (0.007)
2.7 (0.067)
Availability 0.732 0.91
(0.044)
0.95 (0.028)
0.9 (0.041) MTBF
(Hour) 71.6
94.79 (0.003)
120.12 (0.040)
229.1 (0.004)
LTC 12.3 7.5
(0.021)
6.3 (0.045)
6.8 (0.43)
LWD 16.5 2.4
(0.003)
0 (0.000)
One report generated by the CMMS was on the frequency of each piece of equipment‘s breakdown with a particular description due to a specific breakdown cause. After the analysis of the report, the causes leading to the highest number of emergency breakdowns were detected and PM tasks were defined in order to prevent those. As a result, there was a rise in the number of PM tasks while the number of unexpected failure tasks declined. Therefore, both PM/EM ManHour% ratio and MTBF increased. In addition, as time passed, maintenance staff became more adept and could do more than repair and this decreased the number of emergency breakdowns and so both PM/EM ManHour% ratio and MTBF increased [24].
On the other hand, the production staff became more proficient in working with their equipment and this reduced the number of breakdowns resulting from the misusage of equipment that in turn led to a decrease in the total number of Ems and increased PM/EM ManHour % ratio and increased MTBF [22]. In addition, software vendors offer packages that usually include a preventive scheduling module that suggests a timeline for servicing machines and their units [25]. After the deployment of the software, PM tasks were scheduled by this module and were suggested on their due date so human error in planning preventive tasks was minimized and the PM tasks were less neglected so the PM/EM ManHour % ratio increased [26].
After the deployment of the CMMS, the number of minor breakdowns reduced and so most of the breakdowns were serious and took longer to repair and thus the MTTR KPI for the remaining breakdowns increased [24]. MTTR is affected by three parameters, which repair time, logistic time and administrative time. Equipment design, the training and skill of the personnel in charge of maintenance affect repair time. Operational structure of the organization, standard maintenance procedure and maintenance quality assurance document all affect administrative time. Time needed for supplying parts is Logistic time [25].
Based on other similar studies, it was anticipated that after deploying the CMMS the amount of time it takes to communicate a production problem to the potential expert solution provider would reduce, the quality of the information shared would improve and thereby the repair time would reduce [24]. All these factors could contribute to reducing mean time to repair (MTTR) [25]. Contrary to our anticipation, MTTR increased. There were two main reasons behind this deterioration. Firstly, the Procurement Department had a poor performance during this period; many sanctions were imposed and this hindered the supply of spare parts and material and increased the logistics time. This increase in logistic time outweighed the excepted decrease in administrative and repair time and therefore increased MTTR. Secondly, our equipment aged and became worn out during time and this brought about more severe breakdowns which took the maintenance
staff longer to repair and accordingly MTTR increased [26].
On the whole, MTBF, PM/EM ManHour % improved while MTTR worsened. However, the MTBF and PM/EM ManHours % improvement outweighed the MTTR‘s deterioration and this led to the overall improvement in availability. The root cause of the significant increase in LWD in the last six months of 2010 compared with the previous six-month period was the occurrence of a road accident leading to death while on commute to work. According to the insurance laws of Iran, the commute incidents are regarded as work-related incidents.
CONCLUSION
Overall, the CMMS improved the chosen KPIs of this company. Accordingly, other similar companies define their KPIs and then deploy CMMSs in order to monitor and constantly improve those KPIs.
Considering the fact that financial issues are important to management, it is recommended that financial-related data also be entered in the CMMS and a product‘s finished-cost module be added to the CMMS.
ACKNOWLEDGEMENTS
The authors declare that there is no conflict of interests.
REFERENCES
1. Al-Najjar B, Alsyouf I. Selecting the most efficient maintenance approach using fuzzy multiple criteria decision making. Int J Prod Econ 2003; 84(1): 85-100.
2. Azadeh A, Keramati A, Mohammadfam I, Jamshidnedjad B. Enhancing the availability and reliability of power plants through macroergonomics approach. J Sci Ind Res India 2006; 65(11): 873-8.
3. Pinjala SK, Pintelon L, Vereecke A. An empirical investigation on the relationship between business and maintenance strategies. Int J Prod Econ 2006 104(1); 214-229.
4. Cigolini R, Fedele L, Garetti M, Macchi M. Recent advances in maintenance and facility management. Prod Plan Control 2008; 19(4): 279-286.
5. Eti MC, Ogaji SOT, Probert SD. Reducing the cost of preventive maintenance (PM) through adopting a proactive reliability-focused culture. Appl Energ 2006; 83(11): 1235-1248. 6. Campos J. Development in the application of ICT in condition
monitoring and maintenance. Comput Ind 2009; 60(1): 1-20. 7. Rausand M. Reliability centered maintenance. Reliab Eng Syst
Safe 1998; 60(2): 121-132.
8. Alsyouf I. The role of maintenance in improving companies‘ productivity and profitability. Int J Prod Econ 2007; 105(1): 70-78.
9. Muchiri P, Pintelon L, Gelders L, Martin H. Development of maintenance function performance measurement framework and indicators. Int J Prod Econ 2011; 131(1): 295-302.
11. White PG. A survey and taxonomy of strategy related performance measures for manufacturing. Int J Oper Prod Man1996; 16 (3): 42–61.
12. Kaplan RS. Measuring manufacturing performance. A new challenge for managerial accounting research. Account Rev 1983, 58 (4), 686–705.
13. Parida A, Chattopadhyay G. Development of a multi-criteria hierarchical framework for maintenance performance measurement (MPM). JQME 2007; 13(3): 241-258.
14. Chan AP, Chan AP. Key performance indicators for measuring construction success. Benchmarking Int J 2004; 11(2): 203-221. 15. Panayiotou N. A, Ponis ST, Gayialis SP. Designing an industrial
maintenance system: a proposed methodological framework. Int J Inform Manage 2009; 8(4): 361-381.
16. Grigoriev A, van de Klundert J, Spieksma FC. Modeling and solving the periodic maintenance problem. Eur J Oper Res 2006; 172(3): 783-797.
17. Kans M. An approach for determining the requirements of computerized maintenance management systems. Comput Ind 2008; 59(1), 32-40.
18. Azadeh A, Fam IM. A framework for development of integrated intelligent human engineering environment. Inform Technol J 2006; 5 (2): 290-299.
19. Qingfeng W, Wenbin L, Xin Z, Jianfeng Y, Qingbin Y. Development and application of equipment maintenance and
safety integrity management system. J Loss Prevent Proc 2011; 24(4): 321-332.
20. Dyba T, Dingsoyr T. Empirical studies of agile software development: A systematic review. Inform Software Tech 2008; 50(9): 833-859.
21. Hwang WT, Tien SW, Shu CM. Building an executive information system for maintenance efficiency in petrochemical plants—an evaluation. Process Saf Environ 2007; 85(2): 139-146.
22. O‘Donoghue CD, Prendergast J. G. Implementation and benefits of introducing a computerized maintenance management system into a textile manufacturing company. J Mater Process Tech 2004; 153: 226-232.
23. Azadeh A, Mohammadfam I,Garakani M.M. A total ergonomic design approach to enhance the productivity in a complicated control system, Inform Technol J 2007; 6(7): 1036-1042. 24. Li MB, Su CT, Shen CL. The impact of covered overhead
conductors on distribution reliability and safety. Int J Elec Power 2010; 32(4): 281-289.
25. Muller A, Crespo Marquez A, Iung B. On the concept of e-maintenance: review and current research. Reliab Eng Syst Safe 2008; 93(8): 1165-1187.
26. Artana KB, Ishida K. Spreadsheet modeling of optimal maintenance schedule for components in wear-out phase. Reliab Eng Syst Safe 2002; 77(1): 81-91.