International Journal of Engineering
J o u r n a l H o m e p a g e : w w w . i j e . i rMulti-objective Efficient Design of
np
Control Chart Using Data Envelopment
Analysis
M. Bashiri, A. Amiri*, A. Asgari, M. H. Doroudyan
Industrial Engineering Department, Faculty of Engineering, Shahed University, Tehran, Iran,
P A P E R I N F O
Paper history:
Received 20 September 2012
Received in revised form 18 November 2012 Accepted 24 January 2013
Keywords:
Economic-statistical Design Data Envelopment Analysis (DEA)
MOESD np Control Chart Maxmin Weight Model
A B S T R A C T
Control charts are the most important tools of statistical process control used to discriminate between assignable and common causes of variation and to improve the quality of a process. To design a control chart, three parameters including sample size, sampling interval, and control limits should be determined. The objectives are hourly expected cost, in-control average run length, power of the control chart, and average time to signal. Different approaches such as statistical design, economic design, and economic-statistical design of control charts have been considered by many researchers. Recently, multi-objective design of control chart has been investigated in the literature. In this paper we propose a multi-objective economic-statistical design of np control chart (np-MOESD). To solve the multi-objective model, a method is used to find the Pareto optimal solution and then a combined method based on Data Envelopment Analysis (DEA) is proposed to determine the most efficient design parameters. A numerical example of Duncan [1] illustrates the proposed approach. Sensitivity analysis is performed to evaluate the proposed model. In addition, the proposed model is compared with pure economic design (Duncan’s model) as well as another model in the literature. Results show that the proposed np-MOESD model improves statistical properties of np control charts.
doi:10.5829/idosi.ije.2013.26.06c.07
1. INTRODUCTION 1
Control charts are powerful tools of statistical process control for monitoring and improvement of processes. To design control charts properly, we need to find optimal value of parameters, sample size (n), sampling interval (h), and the control limit (d). Selecting a combination of these parameters is called the design of control charts. A control chart which is used to monitor nonconforming fraction is p control chart. np-chart is the best alternative for the p-chart. This chart is used to monitor the number of nonconforming items. Different approaches such as statistical design, economic design, and economic-statistical design of control charts have been considered by many researchers to determine design parameters. The first economic model to determine design parameters of
control charts was presented by Duncan [2]. After that economic design of different control charts have been investigated by many researchers. Ladany [3] presented a model for the economic design of the p control chart. Chiu [4]
*Corresponding Author Email: [email protected] (A. Amiri)
proposed the economic model of the np controlchart. In the proposed model, he considered the cost of process adjustment. In addition, he assumed that process is stopped when the signal is taken by the control chart. Chiu [5] developed the economic model in Chiu [4] under multiple assignable causes. Montgomery et al. [6] proposed the economic model for the fraction nonconforming control chart under multiple assignable causes. In addition, they performed sensitivity analysis on the economic model. Duncan [1] proposed the economic model for p (np) control charts under one assignable cause. Chung [7] improved Chiu’s study by presenting an algorithm in the procedure. Lo [8] assumed that the input parameters of the economic design are not always known. He used two methods including maximum likelihood estimation and a naïve method in his paper. Wang and Chen [9] presented an economic-statistical model to design np control chart under the fuzzy situation. They used a fuzzy mathematical programming model and a heuristic method to determine the parameters.
Woodall [10] stated that the economic design of control chart without considering statistical constraints
leads to poor results in statistical properties. To overcome this problem, researchers proposed economic-statistical design of control charts, for example see review paper by Celano [11]. Another approach to account for this problem is using multi-objective economic-statistical design of control charts. Evans and Emberton [12] suggested the multi-objective model for designing the joint X and R control charts. Then, Del Castillo et al. [13] presented a multi-objective model for design of X control chart. This model is including three objective functions, two statistical objectives and an economic cost function. They used nonlinear optimization algorithm to solve the multi-objective model. Chen and Liao [14] proposed optimal design of X control chart as a multiple criteria decision-making and solved this model using data envelopment analysis (DEA). Celano and Fichera [15] presented a model similar to Del Castillo et al. [13] and solved this model by genetic algorithm. Zarandi et al. [16] suggested a fuzzy multi-objective model for economic-statistical design of X control chart when the input parameters are fuzzy. They used a genetic algorithm (GA) to find the optimal design parameters. Asadzadeh and Khoshalhan [17] presented a multi-objective model for X control charts. This model is similar to that used in Chen and Liao [14]. However, they added an average time to signal (ATS) constraint to the model and generalized the cost function from one assignable cause to multiple assignable causes. Recently, Safaei et al. [18] used a multi-objective model for economic-statistical design of X control chart considering
Taguchi loss function. Furthermore, they used
non-dominated sorting genetic algorithm II (NSGA-II) to solve the applied model.
Data envelopment analysis (DEA) is an optimization approach for measuring the relative efficiency of a batch of competing decision-making units (DMUs), whenever there are multiple inputs and outputs for each DMUs (Thanassoulis, [19]). The application of the DEA is in different areas including designing control charts. Chen and Liao [14] used DEA for determining the parameters of X control charts when there is only one assignable cause in the model. Asadzadeh and Khoshalhan [17] used DEA approach to solve a multi-objective model presented for designing X control charts.
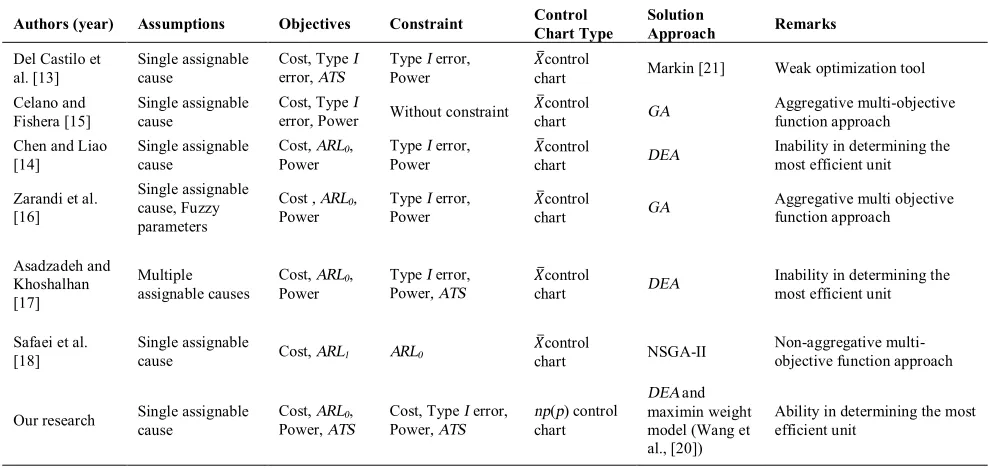
In Table 1, comparison between different researches on multi-objective design of control charts is done. Furthermore, the scope of our research among the other multi-objective researches is illustrated. To the best of our knowledge, there is no research on multi-objective design of np (p) control charts. In this paper, we design the np control chart with multiple objectives and determine design parameters, namely sample size (n), sampling interval (h), and sample number of nonconforming items (d). In the proposed multiple-objective model, there are three statistical multiple-objectives and one economic objective. To solve the multi-objective model, a method is used to find the Pareto optimal solution and then a combined method based on DEA is proposed to determine efficient design parameters. Finally, the most efficient combination of design parameters among DEA efficient units is selected using the maximin weight model (See Wang et al., [20]).
TABLE 1. Comparison of studies on multi-objective (criteria) design of control charts.
Authors (year) Assumptions Objectives Constraint Control Chart Type Solution Approach Remarks
Del Castilo et al. [13]
Single assignable cause
Cost, Type I
error, ATS
Type I error,
Power
control
chart Markin [21] Weak optimization tool Celano and
Fishera [15]
Single assignable cause
Cost, Type I
error, Power Without constraint chart control GA
Aggregative multi-objective function approach Chen and Liao
[14]
Single assignable cause
Cost, ARL0, Power
Type I error,
Power
control
chart DEA
Inability in determining the most efficient unit Zarandi et al.
[16]
Single assignable cause, Fuzzy parameters
Cost , ARL0, Power
Type I error,
Power chart control GA
Aggregative multi objective function approach
Asadzadeh and Khoshalhan [17]
Multiple assignable causes
Cost, ARL0, Power
Type I error,
Power, ATS chart control DEA
Inability in determining the most efficient unit
Safaei et al. [18]
Single assignable
cause Cost, ARL1 ARL0 chart control NSGA-II Non-aggregative multi-objective function approach
Our research Single assignable cause Cost, ARL0, Power, ATS
Cost, Type I error, Power, ATS
np(p) control chart
DEA and
maximin weight model (Wang et al., [20])
There are different methods for ranking DEA efficient units. For example, Andersen and Petersen [22] proposed the super-efficiency method for ranking the DEA efficient units. Sinuany-Stern et al. [23] proposed an AHP/DEA method for ranking decision making units (DMUs). Wang et al. [20] used a minimum weight restriction in DEA for determining the most efficient units and ranking DEA efficient units.
2. THE np-MOESD MODEL
In this section, the Duncan’s economic model is introduced. Then, the proposed np-MOESD model is presented.
2. 1. Economic Cost Function for np Control Charts Duncan [1] presented economic model with one assignable cause for np (p) control charts. This model is similar to Duncan model [2] presented for X
control charts. In Duncan model [1], there are in-control and one out-control states. The time between occurring two assignable causes is randomly exponentially distributed with mean time 1/λ. Moreover, the distribution of the number of nonconforming items in a sample is binomial with mean of np0. When a shift (δ)
occurs in the process, the process mean changes from
0
p to p1 as follows:
1 0 0(1 0)
p =p +d p -p (1)
If the average time in hours to looking for the assignable cause is D, and the time to take and testing the sample is gn, hence, the average time of the process which is in out-of-control state (B) will be
/ – ,
B= h P t +gn +D (2)
where, P is the probability of a signal (power) given by
(
) ( )
01 1
!
1 (1 ) .
! !
x n
d
x
x n
P p p
x n x
-=
= -
-å
(3)In Equation (3), d (the number of nonconforming items) is upper control limit (UCL) of the np control chart. When the number of nonconforming items exceeds the d, the process is in the state of out-of control.τ is the average time of occurrence of an assignable cause between samples and given by
( )
(
)
1 1
. 1
h
h
h e e
l
l
l t
l
-é - + ù
ë û
=
- (4)
Since the average time a process is in-control state equals to 1/λ, hence, the expected length of a cycle is
1 . B
l+ (5)
Moreover, probability of Type I error (α) is given by
(
) ( )
1 0 0
!
1 (1 ) .
! !
n x
x d
x
n p p
x n x
a
-=
= -
-å
(6)The average number of false alarms occurs per cycle is as follows:
/ (1 ).
h h
A=ae-l -e-l (7)
Thus, the expected cost per hour is
, 1
MB AT W b cn
L
b h h
l l l
l
+ +
= + +
+ (8)
where, M is the loss per hour due to producing nonconforming items in the out-of-control state, T is the average cost of verifying a false alarm, W is the average cost of detecting an assignable cause, b is the fixed cost and c is the variable cost of sampling.
2. 2. Multi-objective Design of np Control Chart The main aim of multi objective decision making ( np-MOESD) is to find a solution which can provide a harmony between all objectives (Hwang and Masud, [24]). In this paper, we propose an np-MOESD model with four objectives. One of them is the economic cost function which presented in the previous section, and the other objectives are statistical functions. The multi-objective model is given as follows:
( ) ( )
( ) ( )
0 Max Max Min Min s.t.
, s s
s s
ARL U P U ATS U L U
P P
ATS ATS
L L
a a
³ £
£ £
(9)
where, ARL0 is the in-control average run length, inverse of false alarm rate (α), P is the probability of detecting a shift in a process (power of control chart), ATS is the average time to signal when an assignable cause occurs, L is expected cost per hour, U is a possible combination of design parameters, Ps is the minimum value of power. In addition, as,ATSsand Ls
are the maximum values of a,ATSand L,
respectively. They are determined by decision maker (DM) to achieve desired solutions.
3. DATA ENVELOPMENT ANALYSIS
As discussed in the introduction section, the DEA is a mathematical programming model used to measure the relative efficiency of DMUs. The relative efficiency for jth DMU is computed as:
weighted sum of outputs . weighted sum of inputs j
E =
Thus, if a DMU wants to have upper efficiency, the denominator of above ratio namely, input data should be minimized and output data should be maximized. If we assume that there are n DMUs, each with m inputs and s outputs, the efficiency of jth DMU is computed using Equation (10).
( )
11 ( ) , ( ) s r rj j m i ij r i
u Y U E U
v X U
= =
=
å
å
j = ¼1, , ,n (10)where, ur is the weight of output r, vi is the weight of
input i, Yrj is the value of output r for jth DMU, Xij is the value of input i for jth DMU.
In our proposed np-MOESD model, the statistical objectives including ARL0 and P are considered as outputs because of their maximizing nature, and L and ATS are investigated as inputs. Therefore, DEA is designed to have two inputs and two outputs for determining the efficiency of DMUs.
3. 1. CCR Model To obtain the input and output weights, we used the CCR model which proposed by Charnes et al. [25]:
( )
( )
( )
0 0 1 0 1 Maximize s r i r r m i i u Y U E Uv X U
= = =
å
å
s.t. (11)( )
( )
1 1 1, s r r r i j m i ij u Y U v X U ==
£
å
å
j= ¼1, nr
u ³0, r= ¼1, s
i
v ³0. i= ¼1, , .m
where, DMU0 is the DMU under evaluation.
The CCR model is equivalently transformed into the linear programming model using transformation method in Charnes and Cooper’s [26]. The corresponding LP model of Equation (11) is:
( )
( )
( )
( )
( )
1 1 1 0 0 1 0 s.t. M a x im ize1, 0, 0, 0 . r i r i s r r m i i s m
r r j i ij
r
i
E U u Y U
v X U
u Y U v X U
u v = = = = = = - £ ³ ³
å
å
å
å
j= ¼1, ,n1,
r= ¼s
1, , i= ¼ m
(12)
The above model is solved for each of DMUs and relative efficiency for each of them are obtained. As a result, at least one of the DMUs will be efficient. However, usually more than one DMU have efficiency equal to one. Therefore, the DEA efficient units should be ranked. In this paper, we use maximin weight model proposed by Wang et al. [20] for ranking the DMUs.
3. 2. Maximin Weight Model Consider the DMU0
as the efficient unit that specified by CCR model. Therefore, the following results for this DMU0are obtained. 0 1 1 1 0 1 0 , 0 , 0 , 0 . s m
r r i i
r
s m
r r j i ij
i
i
r i
r
u y v x
u y v x
u v = = = = - = - £ ³ ³
å
å
å
å
j= ¼1, ,n1, 1, , r s i m = ¼ = ¼ (13)
Wang et al. [20] proposed a maximin weight model for ranking the DEA efficient units. This model is solved for all DMUs with efficiency equal to one. This model is introduced in Equation (14).
1 0 1 1 1 m 1 0 1, 0, 0 M axim ize s.t. ˆ ˆ ˆ , , . ˆ i i s m
r r i
r i
s m
r r
i
j i ij
r i r i y x y v u v
u v x
u v e e e = = = = = = - = - £ ³ ³
å
å
å
å
å
j= ¼1, ,n1, 1, , r s i m = ¼ = ¼ (14)
where, ε is the maximin weight which can keep DMU0 as an efficient unit, x iˆ ( 1, , ;ij = ¼m j= ¼1, , )n is normalized input data and y rˆrj
(
= ¼1, , ;s j= ¼1, ,n)
is normalized output1
1 ˆ
ˆ
,
, ij
ij n
ij
rj r
i
j
j n
rj
x x y
y x
y
=
= =
=
å
å
1, , ; 1, ,
i= ¼ m j= ¼ n
1, , ; 1, ,
r= ¼ s j= ¼ n
(15)
If there are k DEA efficient units, by solving maximin weight model in Equation (14) for each efficient unit, we can obtain a group of maximin
weights, * * *
1, 2, ,
i i ik
e e ¼e . The unit with largest e* is the most efficient unit. Then other efficient units are ranked based on their calculated e* in descending order. Genrally, the CCR and maximin weight models are applied to solve the np-MOESD model for determining the most efficient of combination of design parameters.
4. METHODOLOGY
In this paper, we apply the proposed algorithm by Chen and Liao [14]. There are many differences between our procedure and Chen and Liao’s method. First, our np -MOESD model is developed for the np (p) control chart instead of Xcontrol chart. Second, in the np-MOESD model, average time to signal is considered as an objective function and two constraints on ATS and cost are considered in addition to their model. Third, our procedure includes one step more than Chen and Liao’s. This step is used to rank the DEA efficient units and to determine the most efficient one. The proposed methodology to solve the np-MOESD model is as follows:
Step 0. Determining the potential combinations of design parameters.
First, by considering the bounds of design parameters, the potential combinations of the design parameters are specified and then the value of each objective function is computed. In this paper, the bounds of each parameter are assumed as follows:
- The bounds of sample size n are 1 and 45, increases by 1.
- The sampling interval h is confined between 0.5 and 6, increases by 0.5.
- The sample number of nonconforming items d is between 0 and n, increases by 1. For example if n equals to 5, d can be between 0 and 5.
Note that to solve the optimization model based on discrete optimization approach, the analyzer can limit the solution space. This is the method used by many authors (see for example Chen and Liao [14], Asadzadeh and Khoshalhan [17]). Our simulation studies showed that the values of n and h larger than 45 and 6, respectively usually lead to obtaining dominated solutions. Hence, to avoid additional computations, we
limited the solution space with the above bounds on the design parameters n and h.
Step 1. Discrimination of feasible combinations. Determination of the feasible combinations by the following assumption constraints:
s
a a£ P P³ s ATS£ATSs L L£ s. Then, the feasible combinations with the same sample size n are separately gathered into a set Qn.
Step 2.Partial solution selection.
Determine the non-dominated solution (NDS) points for each set of Qn. The NDS solution (combination) in the set Qn means that there is no other solution in the same set that is dominated in terms of statistical properties and cost.
Step 3.Global Pareto solution selection.
Combine all determined partial Pareto solution from step 2 into a set W, and then select the global Pareto solutions. In this step the efficiency score of each combination can be calculated using DEA.
Step 4.The most efficient unit determination.
Compute ε for each DEA efficient unit by solving Equation (14). The unit with the largest maximin weight ε will be the most efficient unit. In addition, the other DEA efficient unit can be ranked from the largest to the smallest based on the maximin weight ε.
5. NUMERICAL EXAMPLE AND COMPARISON
In this section, the numerical example of Duncan [1] is employed to investigate the performance of np-MOESD model. Then, the proposed approach is compared with pure economic design (Duncan’s model, [1]). In addition, we applied Chen and Liao [14]'s model and solved it with the proposed method. Then we compared the results of the proposed model to the results of Chen and Liao's model. Finally, sensitivity analysis is performed to evaluate performance of the proposed model.
5. 1. Duncan’s Numerical Example In this subsection, the numerical example of Duncan [1] with minor changes is considered to present the np-MOESD model.
binomial with mean np0 (p0= 0.01). In addition, the
value of δ is 1.5 and hence p1 is equal to 0.16. The
values of the other parameters are summarized in Table 2. The constraints of np-MOESD model are also assumed to be as follows:
0.05
a£ P³0.9 ATS£4 L£3.5
Based on the proposed methodology in section 4, the following steps are done to solve the model:
First, the feasible solutions are separated based on the constraints mentioned above. Then, the sets Qn are
determined and the NDS of each set are selected. Next, the relative efficiently of each NDS combination is computed by DEA through DEAP software. Finally, the maximin weight model is applied to rank the DEA efficient units and to determine the most efficient combination of design parameters. The determined efficient units using DEA are summarized in Table 3.
Furthermore, results of maximin weight model for all of efficient units are presented in Table 4. Based on results of maximin weighted model, combinations (40,3,3) and (40,3.5,3) are the most efficient units which are specified by * in Table 4.
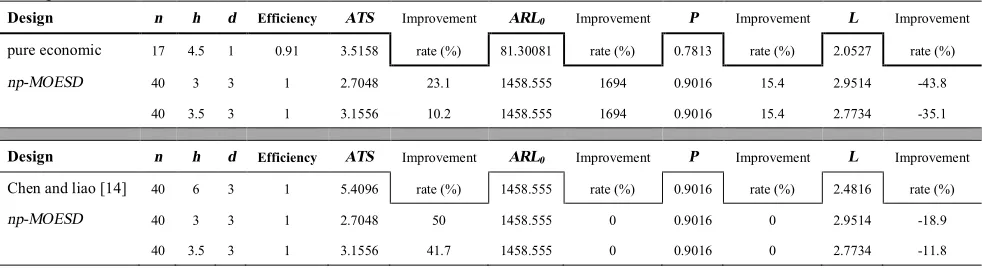
5. 2. Comparisons With the Pure Economic Model In this subsection, a comparison between the pure economic model presented by Duncan [1] and the proposed np-MOESD model is performed and the
results are summarized in upper half of Table 5. Note that the two most efficient design parameters determined in Table 4 are compared with the results reported by Duncan [1] for np control chart.
TABLE 2. The input value of cost parameters for Duncan (1978) example
Parameter Value
T 25$
W 12.5$
M 20$
b 1$
c 0.1$
TABLE 4. Ranking of DEA efficient combinations by
maximin weight model for the modified Duncan (1978) example
n H d e* Rank
23 1.5 1 0.05491 4
24 4 1 0.03064 5
40 2.5 3 0.15809 3
40 3 3 0.16003 1 *
40 3.5 3 0.16003 1 *
40 4 3 0.15895 2
43 2.5 2 no feasible 6
TABLE 3. Efficient combination of the determined design parameters obtained by DEA method
n h d ATS L ARL0 P Efficiency
23 1.5 1 1.3536 3.4889 45.4545 0.9024 1
24 4 1 3.6604 2.2245 41.841 0.9151 1
40 2.5 3 2.254 3.2251 1458.56 0.9016 1
40 3 3 2.7048 2.9514 1458.56 0.9016 1
40 3.5 3 3.1556 2.7734 1458.56 0.9016 1
40 4 3 3.6064 2.6551 1458.56 0.9016 1
43 2.5 2 2.4417 3.4159 108.6957 0.9767 1
TABLE 5. Comparison between the pure economic model and Chen and Liao's model with np-MOESD model for numerical example
Design n h d Efficiency ATS Improvement ARL0 Improvement P Improvement L Improvement
pure economic 17 4.5 1 0.91 3.5158 rate (%) 81.30081 rate (%) 0.7813 rate (%) 2.0527 rate (%)
np-MOESD 40 3 3 1 2.7048 23.1 1458.555 1694 0.9016 15.4 2.9514 -43.8
40 3.5 3 1 3.1556 10.2 1458.555 1694 0.9016 15.4 2.7734 -35.1
Design n h d Efficiency ATS Improvement ARL0 Improvement P Improvement L Improvement
Chen and liao [14] 40 6 3 1 5.4096 rate (%) 1458.555 rate (%) 0.9016 rate (%) 2.4816 rate (%)
np-MOESD 40 3 3 1 2.7048 50 1458.555 0 0.9016 0 2.9514 -18.9
In addition, a comparison between the proposed np -MOESD model and the model by Chen and Liao [14] is done and the results are summarized in lower half of Table 5.
The results of upper half of Table 5 show that the relative efficiency of the best combination determined by the pure economic model is less than 1. Selected two most efficient units by the proposed np-MOESD model
have improved ATS about 23.1%
[(3.5158-2.7048)/3.5158] and 10.2%, respectively. In addition, the sampling interval is decreased in np-MOESD design. Furthermore, the hourly expected cost (L) is increased about 43.8% [(2.0527-2.9514)/2.0527] and 35%, respectively by the proposed combinations. The values of ARL0for np-MOESD design are very suitable and the power of control chart is improved about 15.4% [(0.9016-0.7813)/0.7813]. Although, the cost of the np control charts is increased but statistical performance is improved using np-MOESD model. Finally, it can be concluded that the combination determined by pure economic model cannot be stated in the Pareto optimal solution in the multi-objective space. Its efficiency score confirm this conclusion.
The results of lower half of Table 5 show that the relative efficiency of the best combination obtained by the Chen and Liao [14]'s model is equal to 1. However, this combination is not feasible in the proposed model
because ATS is greater than 4. Although the values of
0
ARL and P are the same based on two models, the most efficient units of the proposed np-MOESD model have improved ATS about 50% and 41.7% . The cost (L) is also increased in the proposed np-MOESD model. It is true that the cost of the proposed model is increased but the values of ATS have been significantly improved using np-MOESD model.
5. 3. Sensitivity Analysis In this subsection, sensitivity analysis of the input cost parameters and resources of constraints is done which exhibit the robustness of the proposed np-MOESD.
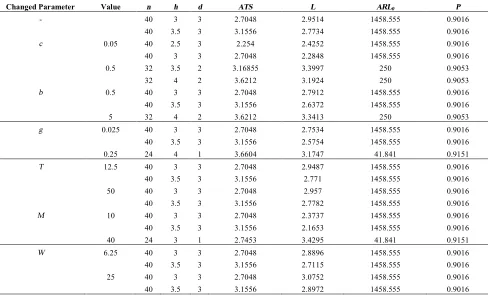
5. 3. 1. Sensitivity Analysis on Input Parameters of Cost Function Sensitivity analysis of the input cost parameters is done to investigate the effect of input parameters on the selection of most efficient units. The parameters include constant and variable sampling costs (b and c), loss per hour due to producing nonconforming items in out-of-control state (M), the average cost of verifying a false alarm (T), the average cost of detecting the assignable cause (W) and also the time for sampling and analyzing (g). The results are summarized in Table 6 and illustrated in Figures 1 and 2.
TABLE 6. Sensitivity analysis of input cost parameters
Changed Parameter Value n h d ATS L ARL0 P
- 40 3 3 2.7048 2.9514 1458.555 0.9016
40 3.5 3 3.1556 2.7734 1458.555 0.9016
c 0.05 40 2.5 3 2.254 2.4252 1458.555 0.9016
40 3 3 2.7048 2.2848 1458.555 0.9016
0.5 32 3.5 2 3.16855 3.3997 250 0.9053
32 4 2 3.6212 3.1924 250 0.9053
b 0.5 40 3 3 2.7048 2.7912 1458.555 0.9016
40 3.5 3 3.1556 2.6372 1458.555 0.9016
5 32 4 2 3.6212 3.3413 250 0.9053
g 0.025 40 3 3 2.7048 2.7534 1458.555 0.9016
40 3.5 3 3.1556 2.5754 1458.555 0.9016
0.25 24 4 1 3.6604 3.1747 41.841 0.9151
T 12.5 40 3 3 2.7048 2.9487 1458.555 0.9016
40 3.5 3 3.1556 2.771 1458.555 0.9016
50 40 3 3 2.7048 2.957 1458.555 0.9016
40 3.5 3 3.1556 2.7782 1458.555 0.9016
M 10 40 3 3 2.7048 2.3737 1458.555 0.9016
40 3.5 3 3.1556 2.1653 1458.555 0.9016
40 24 3 1 2.7453 3.4295 41.841 0.9151
W 6.25 40 3 3 2.7048 2.8896 1458.555 0.9016
40 3.5 3 3.1556 2.7115 1458.555 0.9016
25 40 3 3 2.7048 3.0752 1458.555 0.9016
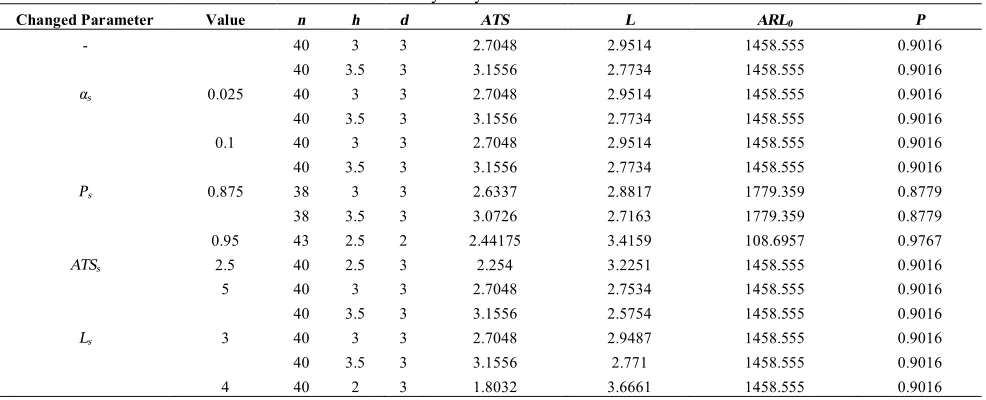
TABLE 7. Sensitivity analysis on resources of constraints
Changed Parameter Value n h d ATS L ARL0 P
- 40 3 3 2.7048 2.9514 1458.555 0.9016
40 3.5 3 3.1556 2.7734 1458.555 0.9016
αs 0.025 40 3 3 2.7048 2.9514 1458.555 0.9016
40 3.5 3 3.1556 2.7734 1458.555 0.9016
0.1 40 3 3 2.7048 2.9514 1458.555 0.9016
40 3.5 3 3.1556 2.7734 1458.555 0.9016
Ps 0.875 38 3 3 2.6337 2.8817 1779.359 0.8779
38 3.5 3 3.0726 2.7163 1779.359 0.8779
0.95 43 2.5 2 2.44175 3.4159 108.6957 0.9767
ATSs 2.5 40 2.5 3 2.254 3.2251 1458.555 0.9016
5 40 3 3 2.7048 2.7534 1458.555 0.9016
40 3.5 3 3.1556 2.5754 1458.555 0.9016
Ls 3 40 3 3 2.7048 2.9487 1458.555 0.9016
40 3.5 3 3.1556 2.771 1458.555 0.9016
4 40 2 3 1.8032 3.6661 1458.555 0.9016
Figure 1. Effect of decreasing input cost parameters on objective functions and design parameters
Figure 2. Effect of increasing input cost parameters on objective functions and design parameters
The np-MOESD model is robust to decreasing in the input cost parameters. In other words, when the input cost parameters decrease, design parameters including the sample size (n), the sampling interval (h) and the sample number of nonconforming items (d) are constant except the sampling interval which changes with the change of parameter c.
Furthermore, the np-MOESD model is robust to increasing in the average cost of verifying a false alarm (T) and the average cost of detecting an assignable cause (W). When, the input parameters increases, cost function also increases and some of previous design parameters combinations would be infeasible. As a result, number of feasible solutions decreases and finally optimal design parameters changes.
Note that the first two rows of Table 6 are the results of the numerical example based on the initial cost parameters discussed in subsection 5.1.
5. 3. 2. Sensitivity Analysis on the Right Hand Sides of Constraints In this segment, sensitivity analysis on the right hand side of constraints including (
s,P ATS Ls, s, s
a ) is done. To do that, each of these
resources is altered and the effect of these changes on the selection of the most efficient units is investigated.
When the bound of constraint on probability of Type I error (α) increases or decreases, the most efficient combination of design parameters does not change. On the other hand, np-MOESD is not dependent to decreasing in Ls and increasing in ATSs. Moreover,
-MOESD model is Ps because When this parameter
changes, the most efficient unit changes as well.
6 CONCLUSIONS
In this paper, we proposed a multi-objective economic-statistical model for np control chart (np-MOESD model). This model contains four objective functions including economic cost function, in-control average run length (ARL0), detection power (P) and also average time to signal (ATS). DEA approach was applied for measuring relative efficiency of different combinations of the design parameters (n, h and d). Then, the maximin weight model (Wang et al., [20]) was used to determine the most efficient unit. The numerical example from Duncan [1] was applied to investigate the proposed model. Comparison between our np-MOESD model with two models (pure economic model in Duncan [1] and Chen and Liao [14]'s model) showed the better statistical properties of the proposed model. In addition, the sensitivity analysis showed the robustness of np-MOESD model to decreasing in all of the input cost parameters except the sampling interval which changes with the change of parameter c. Moreover, the proposed np-MOESD model is robust to T and W parameters as well. Furthermore, the most sensitive right hand side of the constraints in np -MOESD is Ps because when this parameter changes, the
most efficient unit changes as well.
For the future research, one can use other MCDM methods to determine design parameters of np control chart. The proposed approach of this paper can be also applied in other control charts such as cumulative sum (CUSUM) or exponentially weighted moving average (EWMA) control charts. Moreover, when several assignable causes occur in the process, the proposed approach can be developed with some changes in the economic cost function.
7. REFERENCES
1. Duncan, A. J., "The economic design of p-charts to maintain current control of o process: Some numerical results", Technometrics, Vol. 20, No. 3, (1978), 235-243.
2. Duncan, A. J., "The economic design of x charts used to maintain current control of a process", Journal of the American Statistical Association, Vol. 51, No. 274, (1956), 228-242. 3. Ladany, S. P., "Optimal use of control charts for controlling
current production", Management Science, Vol. 19, No. 7, (1973), 763-772.
4. Chiu, W., "Economic design of attribute control charts", Technometrics, Vol. 17, No. 1, (1975), 81-87.
5. Chiu, W., "Economic design of np charts for processes subject to a multiplicity of assignable causes", Management Science, Vol. 23, No. 4, (1976), 404-411.
6. Montgomery, D. C., Heikes, R. G. and Mance, J. F., "Economic design of fraction defective control charts", Management Science, Vol. 21, No. 11, (1975), 1272-1284.
7. Chung, K. J., "An algorithm for the economic design of np charts for a multiplicity of assignable causes", Journal of the Operational Research Society, Vol., No., (1995), 1374-1385. 8. Lo, V. S., "On estimation methods of input parameters for
economic attribute control charts", The Statistician, (1994), 439-451.
9. Wang, R. C. and Chen, C. H., "Economic statistical np-control chart designs based on fuzzy optimization", International Journal of Quality & Reliability Management, Vol. 12, No. 1, (1995), 82-92.
10. Woodall, W. H., "Weaknesses of the economic design of control charts", Technometrics, Vol. 28, No. 4, (1986), 408-409. 11. Celano, G., "On the constrained economic design of control
charts: A literature review", Producao, Vol. 21, No. 2, (2011), 223-234.
12. Evans, G. W. and Emberton, G. R., "Bicriterion design of process control charts", International journal of production economics, Vol. 22, No. 2, (1991), 141-150.
13. Castillo, E. D., Mackin, P. and Montgomery, D. C., "Multiple-criteria optimal design of x control charts", IIE transactions, Vol. 28, No. 6, (1996), 467-474.
14. Chen, Y. K. and Liao, H. C., "Multi-criteria design of an x̄
control chart", Computers & Industrial Engineering, Vol. 46, No. 4, (2004), 877-891.
15. Celano, G. and Fichera, S., "Multiobjective economic design of an x control chart", Computers & Industrial Engineering, Vol. 37, No. 1, (1999), 129-132.
16. Zarandi, M. H. F., Alaeddini, A., Turksen, I. B. and Ghazanfari, M., "A neuro-fuzzy multi-objective design of shewhart control charts", in Analysis and Design of Intelligent Systems Using Soft Computing Techniques, Springer, (2007), 842-852. 17. Asadzadeh, S. and Khoshalhan, F., "Multiple-objective design of
an X-bar control chart with multiple assignable causes", The International Journal of Advanced Manufacturing Technology, Vol. 43, No. 3-4, (2009), 312-322.
18. Safaei, A. S., Kazemzadeh, R. B. and Niaki, S. T. A., "Multi-objective economic statistical design of x-bar control chart considering taguchi loss function", The International Journal of Advanced Manufacturing Technology, Vol. 59, No. 9-12, (2012), 1091-1101.
19. Thanassoulis, E., "Introduction to the theory and application of data envelopment analysis: A foundation text with integrated software", Kluwer Academic Pub, (2001).
20. Wang, Y.-M., Luo, Y. and Liang, L., "Ranking decision making units by imposing a minimum weight restriction in the data envelopment analysis", Journal of Computational and Applied Mathematics, Vol. 223, No. 1, (2009), 469-484.
21. Markin, P., "An algorithm for solving linear and nonlinear multiple criteria optimization problems", in Department of Decision and Information Systems, Arizona State University, (1991).
22. Andersen, P. and Petersen, N. C., "A procedure for ranking efficient units in data envelopment analysis", Management Science, Vol. 39, No. 10, (1993), 1261-1264.
23. Sinuany‐Stern, Z., Mehrez, A. and Hadad, Y., "An ahp/dea methodology for ranking decision making units", International Transactions in Operational Research, Vol. 7, No. 2, (2000), 109-124.
25. Charnes, A., Cooper, W. W. and Rhodes, E., "Measuring the efficiency of decision making units", European Journal of Operational Research, Vol. 2, No. 6, (1978), 429-444.
26. Charnes, A. and Cooper, W. W., "Programming with linear fractional functionals", Naval Research Logistics Quarterly, Vol. 9, No. 3‐4, (1962), 181-186.
Multi-objective Efficient Design of
np
Control Chart Using Data Envelopment
Analysis
M. Bashiri, A. Amiri, A. Asgari, M. H. Doroudyan
Industrial Engineering Department, Faculty of Engineering, Shahed University, Tehran, Iran,
P A P E R I N F O
Paper history:
Received 20 September 2012
Received in revised form 18 November 2012 Accepted 24 January 2013
Keywords:
Economic-statistical Design Data Envelopment Analysis (DEA)
MOESD np Control Chart Maxmin Weight Model
هﺪﯿﮑﭼ
ﯽﻓدﺎﺼﺗتﺎﻓاﺮﺤﻧازاﻞﯿﻟدﺎﺑتﺎﻓاﺮﺤﻧاﮏﯿﮑﻔﺗﻪﺑﻪﮐﺪﻨﺷﺎﺑﯽﻣيرﺎﻣآﺪﻨﯾآﺮﻓلﺮﺘﻨﮐدﺮﺑرﺎﮐﺮﭘيﺎﻫراﺰﺑازاﯽﻟﺮﺘﻨﮐيﺎﻫرادﻮﻤﻧ ﺪﻧﻮﺷﯽﻣﺪﻨﯾآﺮﻓﺖﯿﻔﯿﮐ دﻮﺒﻬﺑﺐﺟﻮﻣوﻪﺘﺧادﺮﭘ
.
ﻪﮐﺖﺳازﺎﯿﻧ درﻮﻣﺮﺘﻣارﺎﭘ ﻪﺳ،ﯽﻟﺮﺘﻨﮐيﺎﻫرادﻮﻤﻧ ﯽﺣاﺮﻃرﻮﻈﻨﻣﻪﺑ
ﺒﻋ زاﺪﻨﺗرﺎ
:
ﻪﻠﺻﺎﻓ،ﻪﻧﻮﻤﻧهزاﺪﻧا لﺮﺘﻨﮐدوﺪﺣﺐﯾﺮﺿويﺮﯿﮔﻪﻧﻮﻤﻧرﺎﺑودﻦﯿﺑ
.
ﻪﻠﻤﺟزانﺎﻘﻘﺤﻣﻂﺳﻮﺗﯽﻔﻠﺘﺨﻣيﺎﻫدﺮﮑﯾور
يدﺎﺼﺘﻗاﯽﺣاﺮﻃ،يدﺎﺼﺘﻗاﯽﺣاﺮﻃ،يرﺎﻣآﯽﺣاﺮﻃ
-ﺖﺳاﻪﺘﻓﺮﮔراﺮﻗﺮﻈﻧﺪﻣﯽﻟﺮﺘﻨﮐيﺎﻫرادﻮﻤﻧﯽﺣاﺮﻃياﺮﺑيرﺎﻣآ
.
ًاﺮﯿﺧا
نﺎﻘﻘﺤﻣﻂﺳﻮﺗلﺮﺘﻨﮐيﺎﻫرادﻮﻤﻧﻪﻓﺪﻫﺪﻨﭼﯽﺣاﺮﻃ ﺖﺳاﻪﺘﻓﺮﮔراﺮﻗﯽﺳرﺮﺑدرﻮﻣ
.
يدﺎﺼﺘﻗاﯽﺣاﺮﻃ،ﻪﻟﺎﻘﻣﻦﯾارد
-يرﺎﻣآ
لﺮﺘﻨﮐرادﻮﻤﻧﻪﻓﺪﻫﺪﻨﭼ
np
ﺖﺳاهﺪﺷدﺎﻬﻨﺸﯿﭘ
.
لﻮﻃﻂﺳﻮﺘﻣ،ﺖﻋﺎﺳردﻪﻨﯾﺰﻫﻂﺳﻮﺘﻣزاﺪﻨﺗرﺎﺒﻋهﺪﺷﻪﺘﻓﺮﮔﺮﻈﻧردفاﺪﻫا
راﺪﺸﻫﺎﺗنﺎﻣزتﺪﻣﻂﺳﻮﺘﻣولﺮﺘﻨﮐرادﻮﻤﻧناﻮﺗ،لﺮﺘﻨﮐﺖﺤﺗﻪﻟﺎﺒﻧد
.
ﻨﺸﯿﭘﻪﻓﺪﻫﺪﻨﭼلﺪﻣﻞﺣياﺮﺑ ﺖﻬﺟﯽﺷورزايدﺎﻬ
رادﻮﻤﻧيﺎﻫﺮﺘﻣارﺎﭘﻦﯾﺮﺗارﺎﮐﺎﻫهدادﯽﺸﺷﻮﭘﻞﯿﻠﺤﺗشورﺎﺑنآﺐﯿﮐﺮﺗﺎﺑوهﺪﺷهدﺎﻔﺘﺳاﻮﺗرﺎﭘﻪﻨﯿﻬﺑيﺎﻫﻞﺣيﻮﺠﺘﺴﺟ ﺖﺳاهﺪﺷﻦﯿﯿﻌﺗلﺮﺘﻨﮐ
.
ﻦﮑﻧادﻪﻟﺎﻘﻣزايدﺪﻋلﺎﺜﻣﮏﯾ
] 1 [
شورﯽﺑﺎﯾزراوﯽﺳرﺮﺑياﺮﺑنآزاوﺖﺳاهﺪﺷجاﺮﺨﺘﺳا
ﺎﺼﺘﻗالﺪﻣﺎﺑﻪﺴﯾﺎﻘﻣرديدﺎﻬﻨﺸﯿﭘ ﻦﮑﻧاديد
] 1 [
ﺖﺳاهﺪﺷهدﺎﻔﺘﺳاعﻮﺿﻮﻣتﺎﯿﺑداردﺮﮕﯾدلﺪﻣﮏﯾو
.
ﻪﺑﺰﯿﻧﻪﻣادارد
ﺖﺳاهﺪﺷﻪﺘﺧادﺮﭘيدﺎﻬﻨﺸﯿﭘشورﺖﯿﺳﺎﺴﺣﻞﯿﻠﺤﺗ
.
لﺮﺘﻨﮐرادﻮﻤﻧيرﺎﻣآصاﻮﺧدﻮﺒﻬﺑهﺪﻨﻫدنﺎﺸﻧﺞﯾﺎﺘﻧ
np
لﺪﻣﻂﺳﻮﺗ
ﯽﻣيدﺎﻬﻨﺸﯿﭘ ﺪﺷﺎﺑ
.