R C O S T N
BIBECHANA
A Multidisciplinary Journal of Science, Technology and Mathematics ISSN 2091-0762 (online)
Journal homepage: http://nepjol.info/index.php/BIBECHANA
Electronic structure and magnetic properties of bulk elements (Fe and
Pd) and ordered binary alloys (FePd and Fe3Pd):TB-LMTO-ASA
approach
Suraj Pandey1, Gopi Chandra Kaphle2, Narayan Prasad Adhikari2*
1Patan Multiple Campus, Patan Dhoka, Kathmandu, Nepal 2
Central Department of Physics Tribhuvan University, Kathmandu, Nepal *Email: [email protected]
Accepted for publication: February 05, 2014
Abstract
The binary alloys formed from the elements of Fe and Pd like FePd and Fe3Pd, have the strange electronic and magnetic properties, generally used in shape memory alloys, Computational chips, Medical purposes as well as modern technological uses. We used TB-LMTO-ASA Approach for the study of band structure and density of states of the transitional elements Fe and Pd and their ordered alloys FePd and Fe3Pd. We analyzed metallic and non-metallic character and occupation of s, p and d electrons from the band structures and magnetic properties through the plot of density of states. Our findings show that all the elements and alloys bear metallic nature whereas bulk Palladium shows non magnetic behavior. Similarly Fe and both the ordered alloys FePd and Fe3Pd are found to be magnetic in nature with values 2.19µB, 3.49µB and 3.01µBrespectively. These well agree with experimental as well as previous theoretical calculations.
© 2014 RCOST: All rights reserved.
Keywords: Binary alloys; Density of states; Electronic properties; TB-LMTO-ASA.
1. Introduction
The physical properties of metal are generally determined through its electronic structure. In solid there are large numbers of electrons and nuclei which are mutually interact with each other, so dynamics of these particles, in general cannot be considered separately. For the simplicity, we have considered frozen core approximation because the nuclei together with core electrons do not take part in bonding. The cohesive, electronic, optical, magnetic and superconducting properties of solids are dominated by the behavior of valance electrons moving in the field of the ion-cores of constituent atoms [1].
S. Pandey et al. / BIBECHANA 11(1) (2014) 60-69: (Online Publication: March, 2014) p.61
useful properties. Each alloy is distinct from its components, and the properties of each alloy are distinct. Indeed the purpose of forming an alloy is to provide a metallic substance with physical, mechanical and chemical properties and characteristics that are different from those of its components. Fe3Pd alloys are potentially useful ferromagnetic shape memory materials with a maximum predicted strain of up to 6.8%. Shape memory materials have found widespread application in engineering and medicine, and recently there has been a great deal of interest in the search for ferromagnetic shape memory alloys capable of large reversible strains under an applied magnetic field [3]. FePd alloys have large magnetization and magneto-crystalline anisotropies and as such are potentially technologically important for applications as permanent magnets or high-density storage media [4]. The large number of experimental and theoretical works have been done regarding the characteristics of Fe and Pd separately and their alloys.
The rest of the paper is organized as follows. Section II describes the computational details of the present study. Results and discussions are described in section III whereas section IV provides the conclusion and finally we present references used in the present study.
2. Computational details
All the systems considered are studied using Tight Binding Linear Muffin-Tin Orbitals Atomic Sphere Approximation (TB-LMTO-ASA). The calculations are carried out from self-consistent calculations (SCF) based on density functional theory within the framework of the local-density approximation (LDA) [5]. The SCF solve the Kohn-Sham equation using the exchange-correlation potential of Von Barth and Hedin [6] with the help of minimal basis sets and partial wave method implemented in TB-LMTO-ASA code. The crystal potential is constructed of overlapping Wigner-Seitz spheres for each atom in the unit cell. According to the spirit of the TB-LMTO-ASA procedure, only the energetically higher-lying valence states have been included in the self-consistent calculations of the effective crystal potential [7]. In such a case, the deeper lying core states are treated as atomic like and hence called frozen core approximation. The band calculation technique are divided into two main approaches; one uses trial wave function, which is formed as linear combinations of basis functions like plane waves in the nearly free-electron (NFE) method expands orthogonalized plane waves function into a set of energy-dependent partial waves and applies a matching condition for partial waves at the muffin-tin sphere like the APW [8] and KKR methods [9]. Actually, the linearized muffin-tin orbital (LMTO) method developed by Anderson [10,11] uses as basis set for expanding the wave function, a set of orbitals that form a complete basis set for a muffin-tin potential.
For the calculation of Fe (BCC) and Pd (FCC) structure same basis set were used at which (8×8×8) k-points were sampled in the irreducible wedge of Brillouin zone (BZ). These parameters are sufficient in leading to well converged total energy and other related parameters. The magnetic moment was calculated by differentiating up and down DOS. After the convergence of SCF we analyzed all the data required for band structure, total energy, DOS etc. All the calculations were iterated to self-consistency with accuracy of 10-6 Rydberg.
3. Results and discussions
This section contains the result and discussion of main findings for the band structure and density of states of elemental solid Fe, Pd and the ordered alloys formed by them like FePd and Fe3Pd.
A. Band Structure of Fe and Pd
S. Pandey et al. / BIBECHANA 11(1) (2014)
Figure 1: Plot of energy versus lattice constant for Fe (left) and Pd (right).
From the left panel of Fig. (1) we found that the lattice parameter of Fe at minimum energy is 2.83
(5.34 a.u.). This value of lattice parameter is 1.39 % less than the experimental value case of Palladium we have used FCC structure which belongs to the space group Fm minimization curve for it is shown in right panel of Fig.
minimum energy is 3.86 o
A (7.28 a.u.), this value of lattice parameter is 0.77% less than the experimen
value 3.89 o
A [12]. The band structures and density of states of these clusters are calculated with the base of these parameters.
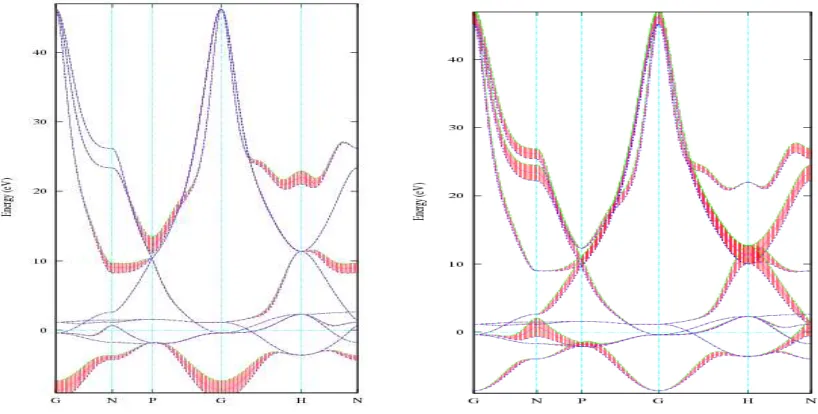
Figure 2: Energy band structures of Fe and Pd along symmetry axes with reference to the Fermi energy.
The band structure of Fe and Pd are shown in left panel and right panel of Fig. (2) respectively, which are plotted with reference to the Fermi energy, 0 on vertical axis represents Fermi energy of the iron. Bands below the Fermi energy are valance bands and bands above t
CHANA 11(1) (2014) 60-69: (Online Publication: March, 2014) p.62
Plot of energy versus lattice constant for Fe (left) and Pd (right).
(1) we found that the lattice parameter of Fe at minimum energy is 2.83
(5.34 a.u.). This value of lattice parameter is 1.39 % less than the experimental value 2.87 o A
case of Palladium we have used FCC structure which belongs to the space group Fm-3m. The energy curve for it is shown in right panel of Fig. (1). We found out that lattice parameter of Pd at
(7.28 a.u.), this value of lattice parameter is 0.77% less than the experimen
[12]. The band structures and density of states of these clusters are calculated with the base
Energy band structures of Fe and Pd along symmetry axes with reference to the Fermi energy.
re of Fe and Pd are shown in left panel and right panel of Fig. (2) respectively, which are plotted with reference to the Fermi energy, 0 on vertical axis represents Fermi energy of the iron. Bands below the Fermi energy are valance bands and bands above the Fermi energy are conduction bands
(1) we found that the lattice parameter of Fe at minimum energy is 2.83 o A o
A [12]. In 3m. The energy (1). We found out that lattice parameter of Pd at
(7.28 a.u.), this value of lattice parameter is 0.77% less than the experimental
[12]. The band structures and density of states of these clusters are calculated with the base
re of Fe and Pd are shown in left panel and right panel of Fig. (2) respectively, which are plotted with reference to the Fermi energy, 0 on vertical axis represents Fermi energy of the iron. Bands
S. Pandey et al. / BIBECHANA 11(1) (2014) 60-69: (Online Publication: March, 2014) p.63
In case of Fe there are all together 9 bands. The maximum energy is at conduction band having value 45.36 eV and minimum value of the energy lies at valence band which has the value -8.67eV. The difference between maximum value of energy of conduction band and minimum value of energy in valance band is found to be 54.01 eV. Conduction band and valance bands are overlapping within this range showing Fe as a metallic nature. Due to the high symmetry of the crystal at the maximum energy of the conduction band and minimum value of energy of the valance band occurs at the Gamma point.
Fat band structure calculations were carried out in order to know the s, p and d orbital contributions on the band structure of Fe. Fig. (3) shows the contribution of s and p orbitals on the band structure of Fe.
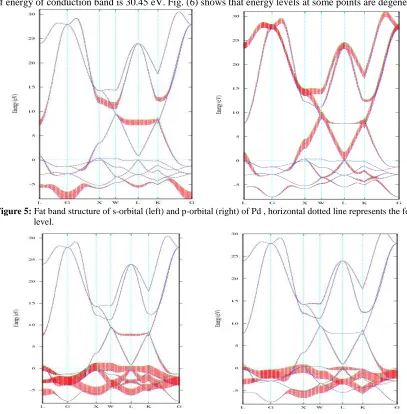
Figure 3: Fat band structure of s-orbital (left) and p-orbital (right) of Fe, horizontal dotted line represents the fermi
level.
Figure 4: Fat band structure of t2g-orbital (left) and eg-orbital (right) of Fe, horizontal dotted line represents the
It shows that s and p-orbitals do not contribute much in the band structure of Fe, there is a greater contribution of p-orbital to the conduction band in comparison to the valence band, while the contribution of s-orbital is negligible in both conduction and valence band. S band contribution for the electronic structure concerntrayed as the G points . The contribution of P band elongates from N to P and crosses Fermi energy through N. Figure (4) shows that d-orbitals overlap between the valence bands and conduction band at the fermi energy level, it has a greater occupancy at valence band and less at conduction band, this indicate that d-orbital contributes significantly to the total band structure. It is mainly due to majority of electrons are in d-orbitals of Iron.
In case of Pd, valance bands lie below the Fermi energy are found occupied, bands above the Fermi energy are unoccupied conduction band. Valance bands and conduction bands overlaps with each other. Along G axis maximum value of energy of conduction band is 28.17 eV and minimum value of the energy of valance band is -7.72 eV; difference between these two energies is 35.89 eV. Maximum value of energy of conduction band is 30.45 eV. Fig. (6) shows that energy levels at some points are degenerate.
)Figure 5: Fat band structure of s-orbital (left) and p-orbital (right) of Pd , horizontal dotted line represents the fermi level.
Figure 6: Fat band structure of t2 g-orbital(left) and eg-orbital (right) of Pd, horizontal dotted line represents the
S. Pandey et al. / BIBECHANA 11(1) (2014) 60-69: (Online Publication: March, 2014) p.65
We studied the fat band structures of s, p and d orbitals of Pd in order to know their contributions on the band structure. Dark and shaded portion of Fig. (5) shows the occupancy of s and p electron. Occupancy of the s-orbital is negligible in comparison with the p orbital, occupancy of p-orbital is greater at conduction band and less at the valence band. Fig. (6) shows that the occupancy of the d-orbital occurs at the valence band, while its occupancy at the conduction band is almost negligible due to which it has a significant contribution to the band structure. Physical properties of the solid such as electrical and magnetic properties, is contributed due to the d-orbital.
B.Band Structure of FePd and Fe3Pd
We deal with the ordered structure of the FePd and Fe3Pd alloys, both have a simple cubic structure with the space group Pm-3m ( Space group no. 221)[13-15]. In the present calculation
Figure 7: Plot of Energy vs lattice constant for FePd and Fe3Pd.
S. Pandey et al. / BIBECHANA 11(1) (2014) 60-69: (Online Publication: March, 2014) p.66
the lattice constant of FePd for the minimum energy is obtained as 3.01 o
A (5.68 a.u.). Similarly the lattice
parameter for the lowest energy value of Fe3Pd is found to be 3.56 o
A (6.70 a.u.). The energy minimization curves for both FePd and Fe3Pd are shown in Fig. (7). All the further calculations are done using these optimized lattice parameters.
The band structure of FePd and Fe3Pd obtained from the present study is shown in the left and right panel of Fig. (8). In case of FePd, we found 18 bands with valence and conduction bands overlapping with each other, showing FePd has metallic nature. The minimum value of energy of valence band is -4.25 eV, and the maximum value of energy of conduction band is 21.25 eV, at G point. Similarly, In case of Fe3Pd we found 36 bands contributing s, p and d orbitals. The valence and conduction bands also found to be overlapped with each other showing metallic nature of Fe3Pd alloy. The maximum energy of the conduction band lies at G point having value 31.36 eV and minimum energy of valence band at G point which has a value of -6.72 eV. To know the effective contribution of individual orbital we have to analyze density of states.
C. Density of States for Fe and Pd
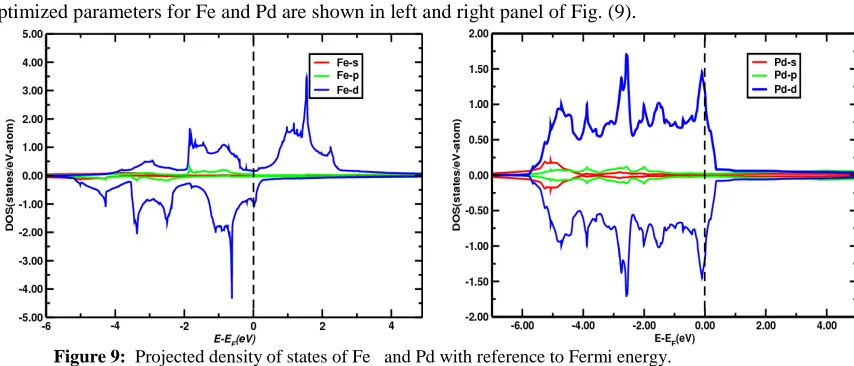
The plots of total density of states and partial density of states for s, p and d orbitals calculated using optimized parameters for Fe and Pd are shown in left and right panel of Fig. (9).
Figure 9: Projected density of states of Fe and Pd with reference to Fermi energy.
From the figure it is found that there is negligible contribution of s band for the magnetization whereas slight asymmetric nature of p orbital below the fermi level shows that p contributed less. There is great asymmetry in up and down spin of DOS of d orbitals indicating that overall magnetic behaviour of Fe is dominated by d electrons. The vertical dotted line at zero represents Fermi energy. The large number of peaks lies below the Fermi energy and few peaks lie above the Fermi energy in left panel of Fig. (9). The peaks in the DOS indicate the large number of states at the certain energy level, which can be occupied by large number of electrons. The magnetic moments are found by integrating the difference of density of states between up and down spin states up to Fermi energy. From the present calculation magnetic moment of Fe found to be equal to 2.19µB which is 1.35% less than the experimental 2.22µB obtained by W. Zhong et al. [16] which shows that Fe is strongly ferromagnetic. Partial density of state plot for the s, p and d orbital of Fe shows that there is a significant difference between the up and down spin density of state plot of the d-orbital which give rise to a net magnetic moment.
S. Pandey et al. / BIBECHANA 11(1) (2014) 60-69: (Online Publication: March, 2014) p.67
D.Density of states of FePd and Fe3Pd.
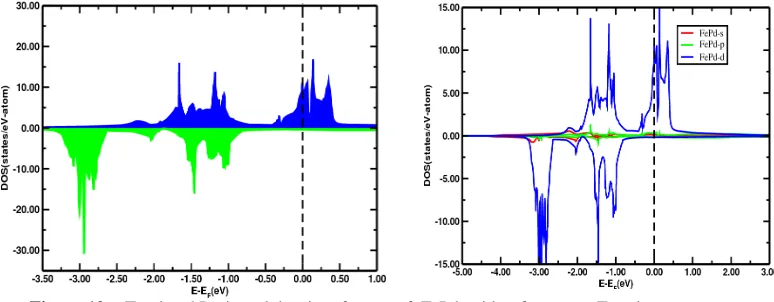
We have performed calculation of density of states of ordered binary alloy FePd and Fe3Pd. Fig. (10) shows the total density of state plot of ordered binary alloy FePd. All the up and down spin density of states of FePd are plotted with reference to the Fermi energy at which vertical line at zero in the figure represents Fermi energy of the system. Density of states on positive side of the vertical axis are for up spin, and on negative side are for down spin states of FePd. Fig. (10) shows that there is large number of peaks lies below the Fermi energy and few peaks lie above the Fermi energy for the up spin. The highest peak of Up spins lies above the Fermi energy and Down spins lies below the Fermi energy.
Figure 10: Total and Projected density of states of FePd with reference to Fermi energy.
The DOS of down spin shows that the curve above the Fermi energy is almost smooth having no peaks while below the fermi level it has a large no of peaks. There is a significant differences between the up and down spin DOS in FePd which results in the large magnetic moment. From data obtained for density of states of FePd, the d magnetic moment of FePd was found to be 3.49µB. The density of state plot for s
and p-orbital shows that it has a minimum difference of energy between up and down spin hence it does not contributes to the magnetic moment while there is a significant differences between the up and down spin in the DOS of d-orbitals indicating that magnetic moment mostly come from the contribution of d electrons.
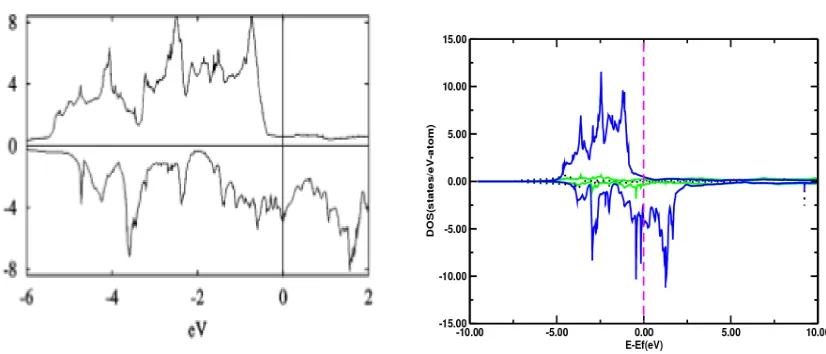
Figure 11: TDOS (Ref:3) and PDOS (present calculation) of Fe3Pd with reference to Fermi energy.
4. Conclusions and concluding remarks
The present work gives the calculation of band structure and density of states of elemental solids Fe and Pd and ordered binary alloy FePd and Fe3Pd using TB-LMTO-ASA approach. In all elemental solids Fe and Pd along some symmetrical axis we have found nine bands with valance and conduction bands overlapping with each other. This is due to the contribution of minimal basis set used LMTO. In case of ordered binary alloys FePd and Fe3Pd we have found 18 and 36 bands respectively with valance and conduction bands overlapping with each other. This shows that all the elements and their binary alloys behave metallic nature.
The band structures and DOS plot show that the transition metals have partially filled shells and their d-bands extend through the Fermi surface. Since the d-d-bands are narrow and contain more levels than free electron bands, the density of states at the Fermi level become very high. The magnetic moment is due to asymmetric distribution of d bands in the fermi level. The density of states of up and down spins for Fe, FePd and Fe3Pd are found to be quite asymmetric in nature which causes a net magnetic moment and thus they are magnetic in nature. While up and down DOS of Pd is symmetric in nature giving a total magnetic moment nearly zero, due to which it is non-magnetic in nature.
The magnetic moments for Fe, FePd and Fe3Pd are found to be 2.19µB, 3.49µB and 3.01µB respectively, which are comparable to experimentally calculated value.
Acknowledgments
GCK is grateful to ICTP/OEA NET-56 program of Trieste, Italy for financial support and Prof. A. Mookerjee of S. N. Bose National Center For Basic Sciences, Kolkata, India for providing
computational code and some discussion in the manuscript.
References
[1] R. M. Martin, Electronic structure: Basic Theory and Practical Methods, Cambridge University Press, United Kingdom, 2004.
S. Pandey et al. / BIBECHANA 11(1) (2014) 60-69: (Online Publication: March, 2014) p.69
[4] S. D Willoughby, J. M. MacLaren, Journal of Applied Physics, 91 (2002) 8813. [5] P. Hohenberg, W. Kohn, Phys. Rev. B, 136 (1964) 864.
[6] U. V. Barth , L. Hedin, J. Phys. C : Solid State Phys, 5 (1972) 1629.
[7] H. L. Skriver, The LMTO Method: muffin-tin orbitals and electronic structure , Springer- Verlag, 1984.
[8] J. C. Slater and G. F. Koster. Phys. Rev. B, 15 (1954) 1498. [9] W. Kohn, N. Rostoker, Phys. Rev., 94 (1954) 1111 . [10] O. K. Andersen, Phys. Rev. B, 12 (1975) 3060.
[11] O. K. Andersen, O. Jepsen, Phys. Rev Lett., 53 (1984) 2571.
[12] C. Kittel, Introduction to Solid State Physics, Wiley Publication, Seventh Edition 2009.
[13] A. Szabo, Neil S. Ostlund, Modern Quantum Chemistry, Dover Publication Inc., Second Edition 1996.