732
Copyright © 2011-15. Vandana Publications. All Rights Reserved.
Volume-5, Issue-3, June-2015
International Journal of Engineering and Management Research
Page Number: 732-737
Identification of Accidental Locations on NH-10 Highways
Rina1, S.S Kajal2
1
Student, Civil Engineering, Institute of Technology and Sciences, Bhiwani, Haryana, INDIA
2
Faculty, Civil Engineering, Institute of Technology and Sciences, Bhiwani, Haryana, INDIA
ABSTRACT
Haryana is a developing state but still roads are not safe. Therefore, Accident severity increases as number of vehicles are increases day by day that means accident severity is directly proportional to number of vehicle. All this gets out a result and that is number of accidents are increases on highways. The Accidental spots are increasing on highways. Therefore, an absence of proper safety and design of crossing traffic, an accidental conditions and fatalities are touching the sky. Here is a collection of traffic and accident data on NH-10 for an identification of more black spots or dangerous locations on this highway.
Keywords--- Highway Safety Mixed Traffic, Road Accidents, Traffic Volume, Vulnerable Road Users (VRU), Road accidents, fatalities, causes, safety.
I.
INTRODUCTION
Haryana is a developing state but still roads are not safe. Therefore, Accident severity increases as number of vehicles are increases day by day that means accident severity is directly proportional to number of vehicle. All this gets out a result and that is number of accidents are increases on highways. The Accidental spots are increasing on highways. Therefore, an absence of proper safety and design of crossing traffic, an accidental conditions and fatalities are touching the sky. Road accidents kill more people than any other natural or manmade disaster, from terrorism to earthquakes. The safety deficiencies in the road infrastructure need urgent attention . Hence Road Safety is a sectorl and multi-dimensional 2 issues. It incorporates the development and management of road infrastructure, provision of safer vehicles, legislation and law enforcement, mobility planning, provision of health and hospital services, child safety, urban land use planning etc. Here is a collection of
traffic and accident data on NH-9 and NH-10 for an identification of more black spots or dangerous locations on these highways.
II.
IDENTIFICATION OF BLACK
SPOTS
It is the procedure to locate those spots in the road network that are particularly dangerous. This study deals with the procedure for identification of hazardous locations or black spots as they are often called. The procedure described is based on recorded accidents, data about accidents, traffic volumes and vehicle- kilo meters. Other methods used are field investigations, conflict studies, questionnaires and interviews, etc. In Haryana Kharawar Mor and Rajive chowk has the highest no of accident due to industries based and heavy traffic loading respectively. Study stretch was taken from Sampla to Old Bus Stand Rohtak . Accident data were collected from police stations and analysed to study black spots.
III.
OBJECTIVE AND SCOPE OF
THE WORK
The whole stretch was divided in to four stretches. The accident data collected for the last three years and to derive improvement measures. The study objectives include,
1. Identification of suitable black spot 2. Ranking of the identified black spots
733
Copyright © 2011-15. Vandana Publications. All Rights Reserved.
IV.
BLACK SPOT IDENTIFICATION
AND ANALYSIS
Study Stretch
NH-10 passing through Rohtak city was selected for this study .
Stretch 1 Sampla to Kharawar Mor ,of 5 Km length. Stretch 2 Kharawar Mor to Rajive Chowk , of 5 Km length.
Stretch 3 Rajive Chowk to Jhajjr Road, of 5Km length. Stretch 4 Jhajjr Road to Old Bus Stand, of 5 Km length.
V.
DATA COLLECTION
The requisite data that is collected for developing road accident models for Rohtak city has been obtained from three different sources and they are as follows:
1. Police Records
2. Field Study
3. PWD B&R
With the prior permission of the concerned Superintendent of Police (S.P), Rohtak, the accident data of Rohtak city were collected for last three years (2012-2014) from the three Police stations of Rohtak city situated along the NH10 from Sampla to Old Bus Stand. These police stations are PS Sampla, PS Model Town, PS Hooda Complex. The data obtained from these police stations have the following information:
1. Number of accidents year-wise
2. Type of accident
3. Vehicles involved in accidents
4. Location of accident
5. Time of accident
6. Age wise accident
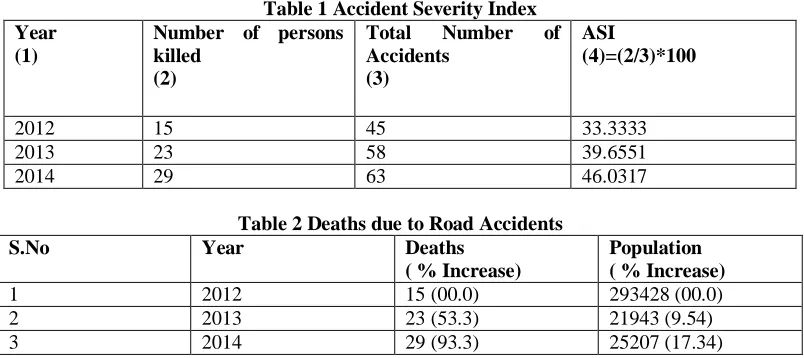
Table 1 Accident Severity Index Year
(1)
Number of persons killed
(2)
Total Number of Accidents
(3)
ASI
(4)=(2/3)*100
2012 15 45 33.3333
2013 23 58 39.6551
2014 29 63 46.0317
Table 2 Deaths due to Road Accidents
S.No Year Deaths
( % Increase)
Population ( % Increase)
1 2012 15 (00.0) 293428 (00.0)
2 2013 23 (53.3) 21943 (9.54)
3 2014 29 (93.3) 25207 (17.34)
Above table shows that with 17.3% increase in the population of the city, number of deaths has increased by 93.33% that is considered to be a great worry for the
people of Rohtak city. The percentage increase in deaths is found to be almost five times the corresponding increase in population.
Table 3 Deaths due to Traffic Volume
S.No Year Deaths
( % Increase)
Traffic Volume in PCU/day
( % Increase)
1 2012 15 (00.0) 8963 (00.0)
2 2013 23 (53.3) 9635 (7.5)
3 2014 29 (93.3) 10358 (15.6)
734
Copyright © 2011-15. Vandana Publications. All Rights Reserved.
Table 4 Time Distribution of Occurrence of Accidents
S.NO Time Year Total
2012 2013 2014
1 6:00am to 10:00am 3 10 10 23
2 10:00am to 2:00pm 15 17 24 56
3 2:00pm to 6:00pm 11 12 14 37
4 6:00pm to 10:00pm 10 12 13 35
5 10:00pm to 2:00am 6 7 0 13
6 2:00am to 6:00am 0 2 0 2
Total 166
Table 5 Age-Wise Distributions of Accidents
S.No Age Group (in years) Year Total
2012 2013 2014
1 0-15 1 0 1 2
2 16-29 17 22 27 66
3 30-45 31 40 43 114
4 46-60 8 13 13 34
5 61-75 2 3 4 9
VI.
STRETCH-WISE
DISTRIBUTION OF ACCIDENTS
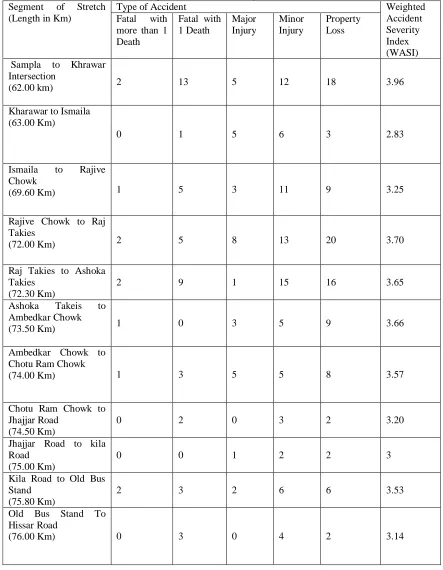
In the method of weighted accident severity index (WASI) for each segment is calculated. In this analysis weightage is given to each accident on the scale of 1 to 5 on the basis of type of accident as follows:
a. For more than 1 death = 5
b. For 1 death = 4
c. For major injury = 3
d. For minor injury = 2
e. For property loss = 1
The equation used for finding weighted accident severity index (WASI) is:
WASI =
Where a1 is the number of accidents with more than one death
a2is the number of accidents with one death
a3 is the number of accidents with major injury
a4 is the number of accidents with minor injury
a5 is the number of accidents with property loss
735
Copyright © 2011-15. Vandana Publications. All Rights Reserved.
Table 6 Weighted Accident Severity Index Calculations Segment of Stretch
(Length in Km)
Type of Accident Weighted
Accident Severity Index (WASI) Fatal with
more than 1 Death
Fatal with 1 Death
Major Injury
Minor Injury
Property Loss
Sampla to Khrawar Intersection
(62.00 km) 2 13 5 12 18 3.96
Kharawar to Ismaila (63.00 Km)
0 1 5 6 3 2.83
Ismaila to Rajive Chowk
(69.60 Km) 1 5 3 11 9 3.25
Rajive Chowk to Raj Takies
(72.00 Km) 2 5 8 13 20 3.70
Raj Takies to Ashoka Takies
(72.30 Km)
2 9 1 15 16 3.65
Ashoka Takeis to Ambedkar Chowk
(73.50 Km) 1 0 3 5 9 3.66
Ambedkar Chowk to Chotu Ram Chowk
(74.00 Km) 1 3 5 5 8 3.57
Chotu Ram Chowk to Jhajjar Road
(74.50 Km)
0 2 0 3 2 3.20
Jhajjar Road to kila Road
(75.00 Km)
0 0 1 2 2 3
Kila Road to Old Bus Stand
(75.80 Km)
2 3 2 6 6 3.53
Old Bus Stand To Hissar Road
736
Copyright © 2011-15. Vandana Publications. All Rights Reserved.
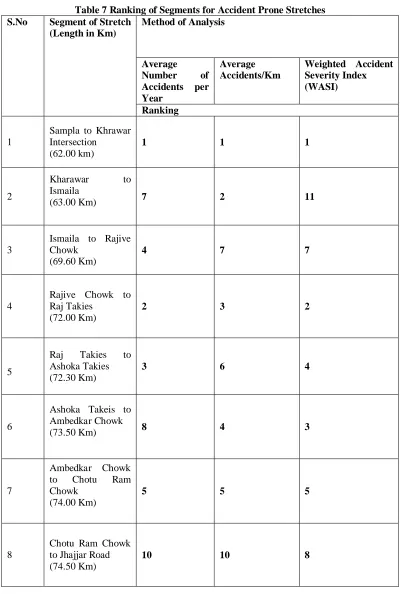
Table 7 Ranking of Segments for Accident Prone Stretches
S.No Segment of Stretch
(Length in Km)
Method of Analysis
Average
Number of Accidents per Year
Average Accidents/Km
Weighted Accident Severity Index (WASI)
Ranking
1
Sampla to Khrawar Intersection
(62.00 km)
1 1 1
2
Kharawar to Ismaila
(63.00 Km) 7 2 11
3
Ismaila to Rajive Chowk
(69.60 Km)
4 7 7
4
Rajive Chowk to Raj Takies
(72.00 Km)
2 3 2
5
Raj Takies to Ashoka Takies
(72.30 Km)
3 6 4
6
Ashoka Takeis to Ambedkar Chowk
(73.50 Km) 8 4 3
7
Ambedkar Chowk to Chotu Ram Chowk
(74.00 Km)
5 5 5
8
Chotu Ram Chowk to Jhajjar Road (74.50 Km)
737
Copyright © 2011-15. Vandana Publications. All Rights Reserved.
9Jhajjar Road to kila Road
(75.00 Km)
11 11 10
10
Kila Road to Old Bus Stand
(75.80 Km)
6 9 6
11
Old Bus Stand To Hissar Road
(76.00 Km)
9 8 9
VII.
CONCLUSIONS
Above table show the ranking of accidents location by the help of WASI method. On If traditional methods of determining unsafe sites for road traffic accidents is followed based on either number of accidents or severity of accidents erroneous conclusions will be drawn in identifying unsafe sites. A lot of money would be wasted and engineering these sites to prevent accident injuries would be cost ineffective. WASI method is most convineant method to find the unsafe location of accident prone area.
REFERENCES
[1] Charles V Zegeer (1995) “ Accident Relationships of
Roadway Width on Low-Volume Roads Horizontal curves”.TRB.
[2] Andrew Vogt and Joe Bared (1998), “Accident
Models for Two-Lane Rural Segment and Intersection “ , TRB Paper No. 98-0294.
[3] Arun Chatterjee (2005), “ Planning Level Regression
Models For Crash Prediction on Interchange and Non-Interchange Segment of Urban Freeways” , Southeastern Transportation Center, Center for Transportation Research, The University of Tennessee, Knoxville, TN 37996-4133 August ,2005.
[4] Andrew P. Tarko (2006) “ Calibration of Safety