R E S E A R C H
Open Access
Integrative network analysis for
survival-associated gene-gene interactions across
multiple genomic profiles in ovarian cancer
Hyun-hwan Jeong, Sangseob Leem, Kyubum Wee and Kyung-Ah Sohn
*Abstract
Background:Recent advances in high-throughput technology and the emergence of large-scale genomic datasets have enabled detection of genomic features that affect clinical outcomes. Although many previous computational studies have analysed the effect of each single gene or the additive effects of multiple genes on the clinical outcome, less attention has been devoted to the identification of gene-gene interactions of general type that are associated with the clinical outcome. Moreover, the integration of information from multiple molecular profiles adds another challenge to this problem. Recently, network-based approaches have gained huge popularity. However, previous network construction methods have been more concerned with the relationship between features only, rather than the effect of feature interactions on clinical outcome.
Methods:We propose a mutual information-based integrative network analysis framework (MINA) that identifies gene pairs associated with clinical outcome and systematically analyses the resulting networks over multiple genomic profiles. We implement an efficient non-parametric testing scheme that ensures the significance of detected gene interactions. We develop a tool named MINA that automates the proposed analysis scheme of identifying outcome-associated gene interactions and generating various networks from those interacting pairs for downstream analysis. Results:We demonstrate the proposed framework using real data from ovarian cancer patients in The Cancer Genome Atlas (TCGA). Statistically significant gene pairs associated with survival were identified from multiple genomic profiles, which include many individual genes that have weak or no effect on survival. Moreover, we also show that integrated networks, constructed by merging networks from multiple genomic profiles, demonstrate better topological properties and biological significance than individual networks.
Conclusions:We have developed a simple but powerful analysis tool that is able to detect gene-gene interactions associated with clinical outcome on multiple genomic profiles. By being network-based, our approach provides a better insight into the underlying gene-gene interaction mechanisms that affect the clinical outcome of cancer patients.
Keywords:Mutual information, Outcome-associated gene interaction network, Integrative network analysis, Survival analysis, TCGA
* Correspondence:[email protected]
Department of Information and Computer Engineering, Ajou University, Suwon 443-749, Republic of Korea
Background
Through the development of high-throughput sequen-cing technology and collaborative projects such as The Cancer Genome Atlas (TCGA), the integrative analysis of clinical data and genomic data at different molecular levels has emerged as a prominent tool for improving our understanding of the biological mechanisms under-lying cancer. Many computational attempts have been made to identify molecular abnormalities that affect clin-ical outcomes and therapeutic targets, by integrating multiple genomic profiles and clinical data [1–15]. In particular, the association between various genomic fea-tures and the clinical outcome of cancer patients has been studied extensively. Previous studies have often fo-cused on the association between each single gene and clinical outcomes [16–19], and have not been able to de-tect the combined effects of multiple genomic features. Other approaches are based on regression models that can describe the effects of multiple features. For ex-ample, the cox regression or sparse regression frame-work, like elastic net analysis, is effective in finding gene expression signatures associated with the overall survival of cancer patients [20]. However, these methods are lim-ited to detection of the additive effect of multiple fea-tures on clinical outcome, and do not translate well for more general types of interaction effects.
More recently, network information either between pa-tients or between genes has been shown to significantly improve the accuracy of predicting clinical outcomes, such as survival in cancer patients. Kim et al., developed an inte-grated framework by graph-based semi supervised learn-ing, to handle multi-level genomic data for the prediction of clinical outcomes inovarian serous cystadenocarcinoma [10]. The similarity network between patients is first con-structed by using genomic feature values, and then the net-work information is utilized in learning the clinical label of new patients. Cox-regression for predicting cancer patient survival has also been successfully extended to incorporate the network structure among genes [21]. However, many of the existing networks used for such analyses are con-structed either by a simple correlation approach between features, or taken from the existing knowledge base, such as protein-protein interaction networks. Neither type of network contains information about the effect of gene in-teractions on clinical outcomes, from a given dataset. In al-ternative ways, there were studies to consider effect of clinical outcomes of constructed networks. Vandin et al. proposed mutated sub-networks associated clinical out-come with HotNet algorithm [22, 23], Pauling et al. pro-posed network integration method with hybrid network construction and differential network mapping for condi-tion specific key pathways [24]. However, these studies fo-cused only interaction or association between single gene and clinical outcomes.
In terms of genomic features, gene signatures based on mRNA expression have been most widely investi-gated to date, while other features such as Copy-Number Alteration (CNA), miRNA, or methylation levels, are gaining more attention recently. For example, Gorringe et al., tried to identify genomic loci interactions of CNA in samples from ovarian cancer patients, al-though found no association with survivability [25].
In this paper, we propose a new integrative framework to identify interacting gene pairs that affect the clinical outcome of cancer patients. Our approach of Mutual information-based Integrative Network Analysis (MINA) allows systematic investigation of gene-gene interactions associated with clinical outcome, via gene network con-struction and analysis. Unlike many existing models, which consider the effects of each single gene or mul-tiple but additive interaction effects on clinical outcome, the proposed method focuses on identifying the gene-gene interaction effect of any type on clinical outcome. By building a gene interaction network, we obtain a glo-bal view of the gene interaction landscape that is associ-ated with the clinical outcome of patients. To gain better insight into the gene interactions that affect clin-ical outcome, we utilized available genomic profiles across different molecular levels. We find that the result-ing integrated network has a greatly enhanced level of scale-freeness and biological significance than each net-work based on a single genomic profile.
Instead of relying on parametric tests, which may suf-fer from a large number of pairwise tests and multiple testing issues, we use an information-theoretic measure of mutual information and a non-parametric approach to extract significant interactions among genes. Mutual information has been widely used as an association measure in the context of genome-wide association studies for detecting epistasis, but rarely in the associ-ation between general genomic features and clinical out-comes. It has the advantages of being flexible and easily applied to both discrete and continuous variables. We implemented an efficient non-parametric testing scheme based on permutation, for measuring the statistical sig-nificance of detected interactions.
Here, we apply the proposed method to TCGA data from ovarian cancer patients. Ovarian cancer is a fatal gynecological cancer that is the leading cause of genital system cancer death and fifth-most common fatal cancer among women in the United States [30]. The cancer shows a high recurrence and poor survival rate [31], which cannot be addressed by standard treatment. In this study we detected novel strong pair-wise interac-tions associated with survival in ovarian cancer, includ-ing many genes with little marginal effect. We also present the topological properties and biological signifi-cance of networks constructed from multiple genomic profiles.
Methods
Mutual information for identifying gene-gene interactions associated with clinical outcome
Using genomic profile data, we identify genomic interac-tions that are associated with clinical outcome, by utiliz-ing an information-theoretic measure of mutual information [32]. It has been used successfully to detect linear or non-linear association between two random variables [33–36]. In most previous studies for detecting interactions based on mutual information, it has been used as a measure of association between a pair of genes [34, 33]. In other words, focus was on interactions or correlations between genes. We take a different ap-proach by using mutual information to assess the strength of association between a pair of genes and the clinical outcome of given samples. Below, we include a brief description of mutual information and how we modify it to capture genomic interactions associated with clinical outcome.
Entropy of a discrete random variable X is defined as
H Xð Þ ¼−X
x∈Xp xð Þlog2p xð Þ;
and joint entropy of two random variablesXandYis de-fined as
H X;ð YÞ ¼−X
x∈X
X
y∈Y
p x;ð yÞlog2p x;ð yÞ:
Mutual information of two random variables X and Y is defined as
I Xð ;YÞ ¼H Xð Þ þH Yð Þ−H Xð ;YÞ:
In order to measure the strength of association between a pair of genes and clinical outcome, we use the extended version of mutual information, which is as follows:
I Xð 1;X2;YÞ ¼H Xð 1;X2Þ þH Yð Þ−H Xð 1;X2;YÞ:
Here, X1 and X2 denote random variables for two
genes, and Ydenotes random variables for the clinical outcome of patients.
When a random variable is discrete, its probability dis-tribution can be easily approximated by the frequency of each possible value. If a genomic profile consists of con-tinuous valued features, then it is not straightforward to calculate mutual information directly, because the re-spective probability distribution for the continuous vari-able is unknown by given values [37]. To address this, we use the histogram-based technique [34] to discretize continuous values. This technique divides the range of a set of continuous values into equal-sized bins. The binning interval of ani-th gene in a genomic profile is determined asMax Vð Þi−Min Vð Þi
B , whereBdenotes the number of bins and
Viis a continuous-valued vector for the gene in the profile. The size of the vector is the number of samples in the pro-file. As the result of discretization, a continuous expres-sion value from a profile goes into one of theBbins.
We also discretize the clinical outcome variable as bin-ary and divide patients into two groups based on sur-vival months. As in previous studies dealing with binarized clinical information [14, 38], we define the short-term and long-term groups as the patients that survived less than or equal to 36 months, or more than 36 months, respectively.
Discretization of a genomic profile induces a partition on the set of samples. Then entropy of a random variable X can be defined in terms of the partition as follows:
H Xð Þ ¼−X
n
i¼1
Ai j j
S j j log2
Ai j j
S j j ;
whereX= {A1, A2,…,An} is a partition on the set of
sam-plesS, i.e.S=A1∪A2∪ ⋯ ∪Anand Ai∩Aj=∅for distinct
iand j. Joint entropy of two partitions X= {A1,A2,…,An}
andY= {B1,B2,…,Bm} can also be defined as follows:
H Xð ;YÞ ¼−X
n
i¼1
Xm
j¼1
Ai∩Bj
S j j log2
Ai∩Bj
It can be naturally extended to joint entropy of any number of multiple partitions.
Extraction of outcome-associated gene-gene interactions by permutation test
Since the exact probability distribution of mutual infor-mation computed on a dataset is generally unknown, the p-value for the significance of a computed mutual infor-mation value is not directly available. Instead of using an approximate scheme such as chi-square distribution ap-proximation [39], we use a non-parametric approach based on the permutation strategy in [34] and derive a threshold for the mutual information value. Specifically, clinical outcome labels (short-term vs. long term) are randomly permuted and the mutual information values with respect to the permuted labels are calculated for every pair of genes. We repeat this 30 times and com-pute the average mutual information across 30 runs by Iavgð Þ ¼i;j 301
X30
p¼1Iavg gi;gj;;Yp
for each pair of genes
giandgj, andYpfor the permuted clinical outcome labels atp-th run.
The thresholdθis determined as the maximum of aver-age mutual information values, i.e.,θ= maxi≠jIavg(i,j). The
pairs of genes having mutual information above this threshold with respect to the original clinical outcome la-bels are considered as associated with the clinical outcome and included for further analysis.
Construction of integrative gene networks
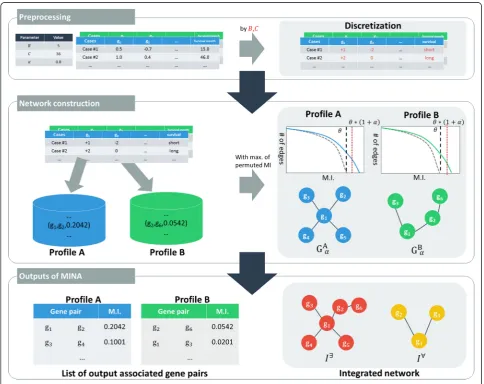
We compute the mutual information for every pair of genes and clinical outcome by using each genomic pro-file separately and obtain those interactions that are as-sociated with clinical outcome by the proposed method. This results in an outcome-guided mutual information gene network in which two genes are connected if their combination is associated with clinical outcome. We de-noted a network for each profile as follows:
Gprofileα ¼ gi;gj
jgi;gj∈P and I gi;gj;Y
≥θð1þαÞ
n o
wheregiandgjare two genes in the set of all genes P,θ
is the threshold from the permutation strategy, andαis the parameter for adjusting the statistical significance level. We constructed gene networks by applying the proposed method to each of the mRNA expression, CNA, and methylation profiles, which we denoted as GαmRNA,GαCNA, andGαMETH.
To enhance our view on the gene interaction associ-ated with clinical outcome across multiple genomic pro-files, we can further construct an integrated network by merging the three networks. As a pilot study, two types of integrated networks are considered: I∃=GmRNA∪ GCNA∪GMETH (integrated network with one-or-more
occurrence of association across profiles) and I∀= GmRNA∩GCNA∩GMETH (integrated network with co-occurrence of associations in every profile) to figure out the overall characteristic and relation of different gen-omic profiles.Integrated network I∃is a union-set of as-sociations which exists at least in one of the genomic profiles. In contrast, an edge for an association between two genes in I∀ must be in every given single profile networks.
Survival analysis of identified gene pairs
Once we obtain pair-wise gene features associated with the clinical outcome, we perform the following survival analysis to validate the result. For a given pair of genes, the patients are stratified into two groups based on the feature value combination of the selected genes, as in the grouping method of Multifactor-Dimensionality Re-duction (MDR) [40, 41]. We first set a thresholdρas the ratio of the number of short-term survival patients to the total number of patients in a given dataset, which was 146/340 in our study. For each possible combination of feature values at the gene pair, we identify patients with the feature combination and examine the ratio of the number of short-term survival patients to the total number of patients among the extracted ones. Each combination of gene feature values is considered as high-risk if the ratio from the combination is above the threshold ρ, and otherwise, as low-risk. This stratifies the patients into two groups of high-risk and low-risk, based on the values of gene pairs. We then apply the log-rank test to assess the significance of the difference in survivability by the gene pair. This is performed on the identified gene pairs as well as on each gene for comparison.
Network analysis
We analyzed the constructed gene networks in terms of the network topologies and then in terms of the bio-logical functionality through functional enrichment test. As many previous studies have revealed the scale-freeness of gene networks [42, 2, 43–46], we examined the scale-freeness of the constructed gene networks along with other topological properties at each signifi-cance level. In a scale-free network, the distributionp(k) of the node degrees follows a power law p(k) ~ k−γ, wherep(k) is the frequency of the node whose degree is k. To measure scale-freeness of a network, Zhang and Horvath [45] proposed to use the coefficient of deter-minationR2, which is the model-fitting index of the lin-ear model that regresses logp(k) on logk. If R2is close to 1.0, the network is considered scale-free. For a net-work constructed from each genomic profile and for each significance level with varying parameter values of
nodes, the number of edges, the number of connected components, the size of the largest component, and the measure of scale-freenessR2.
We performed enrichment analysis on the obtained net-works to assess common or related biological functional-ities of the genes belonging to the same connected component of the network. We ran gene ontology (GO) [47] enrichment analysis for the network in Cytoscape [48] with Biological Network Gene Ontology tool (BINGO) [49]. We used Ontology and annotation data in (http:// www.geneontology.org/). We ran those analysis for the co-occurrence network, the one-or-more co-occurrence network, and each of the three networks constructed by using each profile separately.
MINA: mutual information based network analysis framework
We developed a tool named MINA that automates the process of identifying significant gene interactions asso-ciated with clinical outcome and of generating various
networks from those pairs. Figure 1 illustrates the overall process performed inside MINA. Genomic profiles, clin-ical outcomes, and the model parameters (B, C, and α) are used as the input. MINA then transforms continuous feature values that may exist in some genomic profiles (e.g., mRNA expression or methylation) and clinical out-come to discrete value based on the parameters B (the number of bins) and C (threshold for survival months) and calculate mutual information value for every pos-sible pair of genes. This tool then outputs significant pairs of genes for a given genomic profile and the result-ing networks.
MINA is written in C++ and runs on operating system based on UNIX. We also used OpenMP (Open Multi-Processing) (http://www.openmp.org), a parallel process-ing library, to hasten the overall process. For the TCGA dataset, it took about 2 to 3 h to run the entire process in a common desktop computer. The source codes for MINA are publically available at https://github.com/ hhjeong/MINA.
Results
Ethics statements
All data related to human subjects used for this study is de-identified and publicly available from The Cancer Genome Atlas project (http://cancergenome.nih.gov/). Therefore, this research is not classified as a human sub-ject research and no Institutional Review Board approval is required.
TCGA data and pre-processing
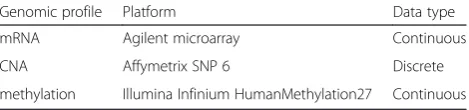
We used genomic and clinical profiles of patients with ovarian serous cystadenocarcinoma from TCGA to dem-onstrate our proposed method. The genomic profiles in-cluded mRNA expression (mRNA), copy number alteration (CNA), and methylation (METH). We initially focused on the genomic features of 20,642 genes in the protein-coding region of 575 patients. The clinical infor-mation for the patients was also extracted. All datasets were downloaded from cBioPortal [50, 51] (http:// www.cbioportal.org) that provides convenient data ac-quisition tools for TCGA data. Table 1 summarizes plat-forms and data types used in our study. We further pre-processed the datasets to filter out genes or patients and to discretize the data as described below.
We applied a two-step procedure to filter genes and patients. In the first step, the following three filters were applied sequentially. First, each gene with missing values across the patient group was removed from all genomic profiles. Then, each patient with all missing values for the remaining genes was removed from all profiles. Fi-nally, each gene with a missing value in at least one of the three profiles on the remaining patients was re-moved. Thus, we had 10,022 protein-coding genes in common across the three profiles of mRNA expression, DNA methylation, and copy number alteration.
As our analysis employed clinical information as a bin-ary outcome of short-term versus long-term survival, in the second filtering step, we further excluded patients whose label assignments were ambiguous from the ana-lysis. That is, the patients with no survival status or with a survival status as living and observed survival time of <36 months were filtered out in the second step. As a result, we had 146 patients in the short-term group and 194 patients in the long-term group.
The copy number alteration profile had discrete valued features with five values of−2,−1, 0, 1, and 2, and there-fore, we directly used this representation from GISTIC
[52] to compute mutual information. We discretize mRNA expression and DNA methylation profiles as de-scribed before with the parameter for the number of binsB= 5 to be consistent with CNA profile.
Distribution of mutual information on each genomic profile
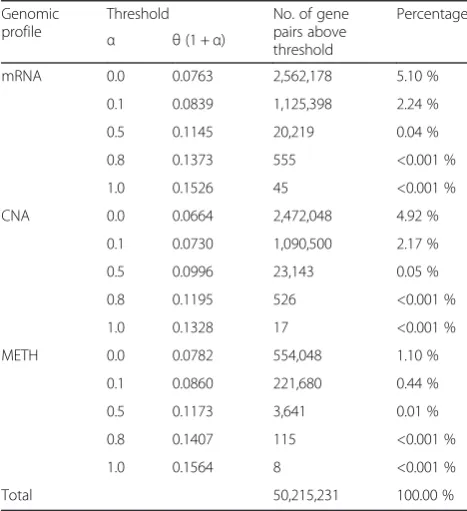
We calculated mutual information values using the ori-ginal and permuted clinical outcome labels of patients, for every pair of genes on each genomic profile in TCGA datasets. Figure 2 shows the empirical distribution of mutual information computed on each real profile (mRNA, CNA, METH) used in this study. The solid lines are with respect to the original clinical outcome la-bels, and the dotted lines are with respect to the per-muted labels averaged over 30 runs. The results from the permuted labels could not create mutual information above 0.0763, 0.0664, and 0.0782 on mRNA, CNA, and methylation profiles, respectively. Therefore, we set these numbers as threshold mutual information θ for each profile separately. A pair of genes with mutual in-formation above this threshold was considered to be as-sociated with clinical outcome.
Gene interactions associated with clinical outcome occur more typically with respect to mRNA expression or copy number alteration levels, but less so with respect to methylation levels. The mRNA expression profile pro-duced the highest number of gene pairs (2,562,178). The CNA profile was second with 2,472,048 pairs, and the methylation profile had far fewer interactions with 554,048 gene pairs (Table 2). This corresponds to about 1–5 % of all pairs of genes (i.e., out of 5 × 10⁷ pairs). When we increase the significance level by setting the threshold as θ× (1 +α) and varying α= 0.0, 0.1, 0.5, 0.8 and 1.0, the number of remaining edges (or gene pairs) becomes substantially less. For example, when α= 0.5, the numbers of gene pairs are 20,219, 23,143, and 3,641, for mRNA expression, CNA, and methylation profiles, respectively. The overall result is summarized in Table 2.
Survival analysis of selected pair-wise genes
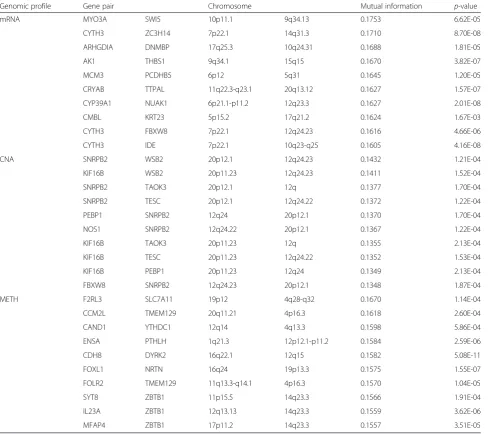
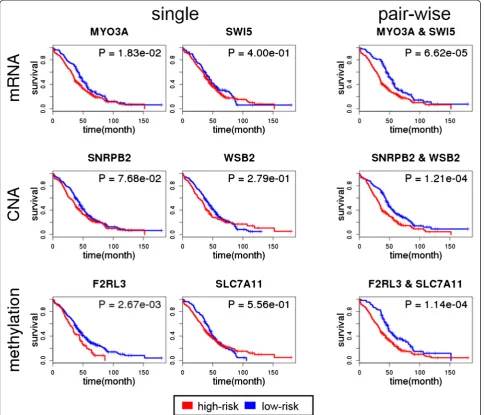
We validated the significance of identified gene inter-action effects on clinical outcome by applying the sur-vival analysis described in Methods. Table 3 shows the results of the log-rank test applied to the top 10 gene pairs from each genomic profile. All of the top 10 gene pairs induced a significant difference in survival, with p-values ranging from 1.67 × 10⁻³ to 5.08 × 10⁻⁷ across different profiles. In Fig. 3, the Kaplan-Meier survival curve of the gene pair that has the highest mutual infor-mation is shown for each profile, along with the ones de-rived by each single gene. The top pair of genes from the mRNA expression profile was MYO3A, a previously identified cancer gene [53] and SWI5, a recombination Table 1Summary of datasets used in this study
Genomic profile Platform Data type
mRNA Agilent microarray Continuous
CNA Affymetrix SNP 6 Discrete
repair homolog. The p-value from the log-rank test for survival difference according to the gene pair was 6.62 × 10⁻⁵, while each single gene produced p-values of 0.02 (MYO3A) and 0.4 (SWI5). In the case of the CNA pro-file, the top pair was from SNRPB2 and WSB2, both cancer genes documented in COSMIC [54], with a p-value of 1 .21 × 10−4, whereas thep-value based on each gene separately was 0.08 and 0.3, respectively.
For more comprehensive analysis, we ran the survival analysis for all the extracted gene pairs obtained from four different significance levels ofα= 0.0, 0.5, 0.8 and 1.0.
The distribution of the resulting p-value is shown in Fig. 4 as a box plot. For comparison, we also included the box plots for p-values for each single gene in the identified gene pairs. Overall, the association significance was substantially stronger in the case of gene pairs than in single genes, across different profiles and parameter settings. This means that there are many genes having weak or no effects, but a strong interaction effect on clinical outcome. Moreover, at each parameter α, the most significant p-value becomes much larger, that is,
−log(p-value) becomes much smaller when we consider the single genes separately, in the case of mRNA and CNA profiles. The methylation profile behaved differ-ently in that the top p-value at α= 0.0 was very similar in both the pairwise and single analyses. It appears that the gene-gene interaction at the methylation level is not as prominent as in other profiles, and the top interaction effects are largely based on the marginal effects of single genes.
Outcome-guided mutual information gene networks We constructed outcome-guided mutual information gene networks by considering genes as nodes, and con-necting two gene nodes if their combination was signifi-cantly associated with clinical outcome. For a network constructed from each genomic profile and also for each significance level with varying parameter values of α= 0.0, 0.1, 0.5, 0.8, and 1.0, we measured the number of nodes, the number of edges, the number of connected components, the size of the largest component, and the measure of scale-freenessR2(Table 4).
Overall, networks based on mRNA expression and CNA profiles tended to have a larger value ofR2asα in-creases, with the maximum at α= 0.8. The networks based on the methylation profile tended to have smaller Fig. 2Empirical distribution of mutual information values. We show the distribution of mutual information values computed for every pair of genes in each profile of mRNA expression (red), CNA (blue) and methylation (yellow). Thesolid linescorrespond to the values with respect to the original clinical outcome labels, and thedotted linesare with respect to the permuted labels averaged over 30 permutations
Table 2Threshold mutual information on each genomic profile
Genomic profile
Threshold No. of gene
pairs above threshold
Percentage
α θ(1 +α)
mRNA 0.0 0.0763 2,562,178 5.10 %
0.1 0.0839 1,125,398 2.24 %
0.5 0.1145 20,219 0.04 %
0.8 0.1373 555 <0.001 %
1.0 0.1526 45 <0.001 %
CNA 0.0 0.0664 2,472,048 4.92 %
0.1 0.0730 1,090,500 2.17 %
0.5 0.0996 23,143 0.05 %
0.8 0.1195 526 <0.001 %
1.0 0.1328 17 <0.001 %
METH 0.0 0.0782 554,048 1.10 %
0.1 0.0860 221,680 0.44 %
0.5 0.1173 3,641 0.01 %
0.8 0.1407 115 <0.001 %
1.0 0.1564 8 <0.001 %
R2when we increasedα. We then examined the I∀ and I∃ at each setting. The number of gene interactions appearing across all three profiles was relatively small. For example, at α= 0.1, the number of edges in I∀ was only 95, while the one-or-more occurrence network (I∃) at the same significance level had more than 2 million edges. There was no common edge across all of the pro-files at a significance level of 0.5 or higher. Also, we did not find a shared edge between any pair of profiles at a significance level 0.8 or higher.
Interestingly, the integrated network, either by taking the intersection or the union of edges, appeared to have a significantly enhanced scale-freeness. The co-occurrence network I0.1∀ had the highest R2 value of 0.950, and the
one-or-more occurrence network with I0.8∃ had the
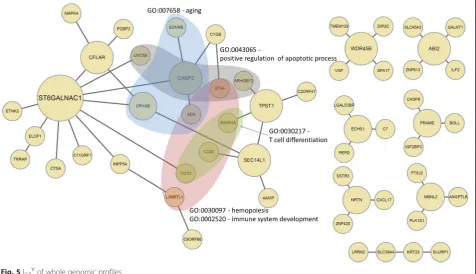
second highest R2value of 0.913. This may suggest that integrated networks are more effective in identifying func-tional gene modules across multiple molecular levels than networks constructed by using each profile separately. We selected these two networks to run further analysis. The graphical representation of the selected intersection net-work and the union netnet-work is shown in Fig. 5 and Fig. 6, respectively.
We performed gene ontology (GO) enrichment ana-lysis to assess common or related biological functions of the genes belonging to the same connected component of the constructed network. We ran the analysis for each of the three networks based on mRNA, CNA, and methylation profiles, and for their one-or-more occur-rence network at α= 0.8. The co-occurrence network at Table 3Top 10 gene pairs for each genomic profile
Genomic profile Gene pair Chromosome Mutual information p-value
mRNA MYO3A SWI5 10p11.1 9q34.13 0.1753 6.62E-05
CYTH3 ZC3H14 7p22.1 14q31.3 0.1710 8.70E-08
ARHGDIA DNMBP 17q25.3 10q24.31 0.1688 1.81E-05
AK1 THBS1 9q34.1 15q15 0.1670 3.82E-07
MCM3 PCDHB5 6p12 5q31 0.1645 1.20E-05
CRYAB TTPAL 11q22.3-q23.1 20q13.12 0.1627 1.57E-07
CYP39A1 NUAK1 6p21.1-p11.2 12q23.3 0.1627 2.01E-08
CMBL KRT23 5p15.2 17q21.2 0.1624 1.67E-03
CYTH3 FBXW8 7p22.1 12q24.23 0.1616 4.66E-06
CYTH3 IDE 7p22.1 10q23-q25 0.1605 4.16E-08
CNA SNRPB2 WSB2 20p12.1 12q24.23 0.1432 1.21E-04
KIF16B WSB2 20p11.23 12q24.23 0.1411 1.52E-04
SNRPB2 TAOK3 20p12.1 12q 0.1377 1.70E-04
SNRPB2 TESC 20p12.1 12q24.22 0.1372 1.22E-04
PEBP1 SNRPB2 12q24 20p12.1 0.1370 1.70E-04
NOS1 SNRPB2 12q24.22 20p12.1 0.1367 1.22E-04
KIF16B TAOK3 20p11.23 12q 0.1355 2.13E-04
KIF16B TESC 20p11.23 12q24.22 0.1352 1.53E-04
KIF16B PEBP1 20p11.23 12q24 0.1349 2.13E-04
FBXW8 SNRPB2 12q24.23 20p12.1 0.1348 1.87E-04
METH F2RL3 SLC7A11 19p12 4q28-q32 0.1670 1.14E-04
CCM2L TMEM129 20q11.21 4p16.3 0.1618 2.60E-04
CAND1 YTHDC1 12q14 4q13.3 0.1598 5.86E-04
ENSA PTHLH 1q21.3 12p12.1-p11.2 0.1584 2.59E-06
CDH8 DYRK2 16q22.1 12q15 0.1582 5.08E-11
FOXL1 NRTN 16q24 19p13.3 0.1575 1.55E-07
FOLR2 TMEM129 11q13.3-q14.1 4p16.3 0.1570 1.04E-05
SYT8 ZBTB1 11p15.5 14q23.3 0.1566 1.91E-04
IL23A ZBTB1 12q13.13 14q23.3 0.1559 3.62E-06
α= 0.1 was analyzed due to its superior scale-freeness and network sparseness at a higher significance level.
We first compared the number of enriched GO terms from each constructed network (Fig. 7). The mRNA profile revealed the greatest number of significant terms among the single networks, which was expected. There was no shared GO term between the CNA and methylation profiles, which may suggest distinct func-tional roles for each profile on clinical outcome. I0.8∃
indicated the greatest number of enriched GO terms with 62 additional BP (Biological Process), 21 CC (Cel-lular Component), and 11 MF (Molecular Function) terms, which were not found in networks constructed by any of the single genomic profiles. Therefore, the in-tegration of networks may provide a better insight into
the gene interaction landscape associated with clinical outcome.
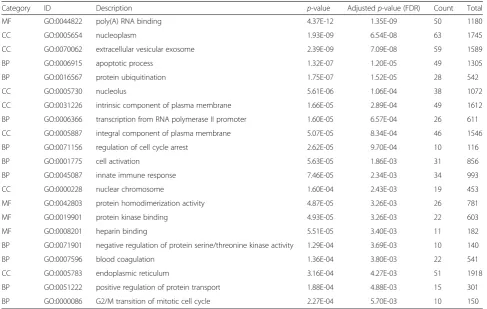
We further investigated the genes in the largest com-ponent of I0.8∃, which were enriched with 176 GO terms
have an important role in the mutation of a target onco-gene [56]. Table 5 summarizes significantly enriched GO terms with the correspondingp-values for the largest con-nected component of the I0.8∃. To present more specific
functionality, we show the term at the lowest level from the root of the directed acyclic graph for each GO cat-egory if multiple terms along the same path from the root are found to be significant.
We also found that major hub genes of the I0.8∃
net-work are related with ovarian cancer-related pathways. For example,Cytohesin 3(CYTH3), the first hub having the largest number of neighbors in the network, is in-volved in the PI3K pathway (M14532) in MSigDB [57]. This pathway is a common drug target of human can-cer, including ovarian cancer [58, 59]. Furthermore, Minichromosome maintenance complex component 3 (MCM3), the third hub, is included in the cell cycle pathway (hsa04110) [60], which is important to the cancer research because alterations in the mechanism characterize the abnormal proliferation of human ma-lignant tumors [61]. Previous research also reported that the cell cycle arrest in the G2/M phase via the blockade of cyclin B1/CDC2 in human ovarian cancer cells [62]. From this observation, we presume that in-teractions of major hub genes with connected
neighbors can play an important role in determining the overall survival of ovarian cancer patients.
For the I∀, many BP terms were discovered in the lar-gest connected-component, but not from CC or MF cat-egories. Table 6 shows the most significant GO terms for the largest connected-component of the co-occurrence network. The 5 most significant GO terms were hemopoiesis (GO:0030097), immune system devel-opment (GO:0002520), aging (GO:0007568), T cell dif-ferentiation (GO:0030217) and positive regulation of apoptotic process (GO:0043065). Immune system devel-opment and T cell differentiation are terms correspond-ing to the immune system, which has a significant role in cancer development and progression [63]. Positive regulation of apoptotic process is a cell death term, and is enriched in genes regulated by Ubiquitin carboxyl ter-minal hydrolase 1 (UCHL1) [64], which is a putative tumor suppressor in ovarian cancer. The hub genes also have known roles in cancer progression. For example, the top hub gene in the network was ST6GALNAC1 which is known to have an important role in ovarian cancer [65].
Discussions
We have proposed a new network-based analysis frame-work to detect gene pairs associated with the clinical outcome and to analyze the resulting networks systemat-ically. Our survival analysis showed that there are a large number of gene pairs that are significantly associated with survival in ovarian cancer in which each single gene has very weak or no association. From the integration of the profiles, we also showed that networks constructed by combining information across different genomic pro-files had better scale-freeness and revealed more bio-logical significance than a network that was constructed by using only one genomic profile.
In our analysis, the co-occurrence network consisted of a moderate level of interactions in single genomic profiles, but integration of the interactions revealed high biological significance in terms of GO BP terms. In con-trast to the I0.1∀, the I0.8∃ consisted of stronger
interac-tions for each genomic profile, and significant CC and MF terms were enriched. Interestingly, networks from interactions with high association strength at each pro-file did not have any shared edges. We also found that sub-networks in the I0.8∃, which were connected by
in-teractions of mRNA and methylation, had many hubs connected to many peripheral nodes, but sub-networks from CNA had a tendency to interconnect genes with-out any dominant hub gene structure.
In this study, we took a simple network integration scheme, which showed enhanced network properties despite its simplicity. A more complicated network inte-gration scheme may be employed in our future analyses, Fig. 4Boxplots forp-values from survival analysis. The distribution of
Table 4Network Topologies for differentαvalues
α Profile Vertices Edges Number of components Size of largest component R2
0.0 mRNA 9,997 2,562,178 1 9,997 0.643
CNA 10,021 2,472,048 1 10,021 0.590
METH 9,801 554,048 1 9,801 0.839
I∀ 1,244 1,538 61 1,105 0.914
I∃ 10,022 5,385,486 1 10,022 0.366
0.1 mRNA 9,943 1,125,398 1 9,943 0.758
CNA 9,934 1,090,500 1 9,934 0.749
METH 9,118 221,680 1 9,118 0.842
I∀ 138 95 44 27 0.950
I∃ 10,022 2,396,372 1 10,022 0.505
0.5 mRNA 6,466 20,219 25 6,418 0.810
CNA 2,886 23,143 9 2,855 0.831
METH 2,166 3,641 25 2,116 0.700
I∃ 8,032 46,975 11 8,012 0.864
0.8 mRNA 641 555 112 358 0.804
CNA 245 526 10 106 0.892
METH 145 115 32 58 0.690
I∃ 1,002 1,196 137 579 0.913
1.0 mRNA 73 45 28 11 0.797
CNA 13 17 1 13 0.363
METH 15 8 7 3 1.000
I∃ 100 70 35 23 0.803
Fig. 6I0.8∃of whole genomic profiles
such as that used in similarity network fusion using multiple genomic datasets [15]. Besides, we plan to in-vestigate the detection power and robustness of the proposed method through extensive simulation study and real data experiments. Another extension includes the application of the integrative network to network-based Cox-regression method using heterogeneous types of data. We expect that this application would enhance the prediction power and help to understand the complex interaction between different types of
genomic profiles for the survivability of cancer patients.
Conclusions
In this paper, we have proposed a simple but powerful method to detect gene pairs that are associated with the clinical outcome. By being network-based, our approach could provide a better insight into the underlying gene-gene interaction mechanisms that affect the clinical out-come of cancer patients.
Table 5Significantly enriched GO terms in the largest component of I0.8∃
Category ID Description p-value Adjustedp-value (FDR) Count Total
MF GO:0044822 poly(A) RNA binding 4.37E-12 1.35E-09 50 1180
CC GO:0005654 nucleoplasm 1.93E-09 6.54E-08 63 1745
CC GO:0070062 extracellular vesicular exosome 2.39E-09 7.09E-08 59 1589
BP GO:0006915 apoptotic process 1.32E-07 1.20E-05 49 1305
BP GO:0016567 protein ubiquitination 1.75E-07 1.52E-05 28 542
CC GO:0005730 nucleolus 5.61E-06 1.06E-04 38 1072
CC GO:0031226 intrinsic component of plasma membrane 1.66E-05 2.89E-04 49 1612
BP GO:0006366 transcription from RNA polymerase II promoter 1.60E-05 6.57E-04 26 611
CC GO:0005887 integral component of plasma membrane 5.07E-05 8.34E-04 46 1546
BP GO:0071156 regulation of cell cycle arrest 2.62E-05 9.70E-04 10 116
BP GO:0001775 cell activation 5.63E-05 1.86E-03 31 856
BP GO:0045087 innate immune response 7.46E-05 2.34E-03 34 993
CC GO:0000228 nuclear chromosome 1.60E-04 2.43E-03 19 453
MF GO:0042803 protein homodimerization activity 4.87E-05 3.26E-03 26 781
MF GO:0019901 protein kinase binding 4.93E-05 3.26E-03 22 603
MF GO:0008201 heparin binding 5.51E-05 3.40E-03 11 182
BP GO:0071901 negative regulation of protein serine/threonine kinase activity 1.29E-04 3.69E-03 10 140
BP GO:0007596 blood coagulation 1.36E-04 3.80E-03 22 541
CC GO:0005783 endoplasmic reticulum 3.16E-04 4.27E-03 51 1918
BP GO:0051222 positive regulation of protein transport 1.88E-04 4.88E-03 15 301
BP GO:0000086 G2/M transition of mitotic cell cycle 2.27E-04 5.70E-03 10 150
Table 6Significantly enriched GO terms in the largest component of I0.1∀
Category ID Description p-value Adjustedp-value (FDR) Count Total
BP GO:0030097 hemopoiesis 1.82E-05 6.81E-03 6 699
BP GO:0002520 immune system development 4.12E-05 6.81E-03 6 809
BP GO:0007568 aging 3.03E-04 1.36E-02 4 399
BP GO:0030217 T cell differentiation 4.69E-04 1.99E-02 3 185
BP GO:0043065 positive regulation of apoptotic process 7.47E-04 2.02E-02 4 507
BP GO:0006915 apoptotic process 5.92E-04 2.02E-02 6 1320
BP GO:0001890 placenta development 1.07E-03 2.44E-02 3 246
BP GO:0050870 positive regulation of T cell activation 1.08E-03 2.44E-02 3 247
BP GO:0023014 signal transduction by phosphorylation 1.49E-03 2.90E-02 3 276
BP GO:0071214 cellular response to abiotic stimulus 1.68E-03 2.93E-02 3 288
Competing interests
The authors declare that they have no competing interests.
Authors’contributions
KS, HJ, SL, and KW designed the study. HJ implemented the idea and performed the experiments. HJ, SL, KW and KS developed the idea and performed the analysis. HJ, KW, and KS wrote the manuscript. All authors read and approved the final manuscript.
Acknowledgements
This research was supported by Basic Science Research Program through the National Research Foundation of Korea (NRF) funded by the Ministry of Education, Science and Technology (2012R1A1A2042792), and by the Ministry of Science, ICT, and Future Planning (MSIP) (2010–0028631). In addition, we gratefully acknowledge the TCGA Consortium and all its members for the TCGA Project initiative, for providing samples, tissues, data processing and making data and results available.
Received: 23 December 2014 Accepted: 24 June 2015
References
1. West M, Ginsburg GS, Huang AT, Nevins JR. Embracing the complexity of genomic data for personalized medicine. Genome Res. 2006;16(5):559–66. doi:10.1101/gr.3851306.
2. Li M, Balch C, Montgomery JS, Jeong M, Chung JH, Yan P, et al. Integrated analysis of DNA methylation and gene expression reveals specific signaling pathways associated with platinum resistance in ovarian cancer. BMC Med Genet. 2009;2:34. doi:10.1186/1755-8794-2-34.
3. Akavia UD, Litvin O, Kim J, Sanchez-Garcia F, Kotliar D, Causton HC, et al. An integrated approach to uncover drivers of cancer. Cell. 2010;143(6):1005–17. http://dx.doi.org/10.1016/j.cell.2010.11.013.
4. Natrajan R, Weigelt B, Mackay A, Geyer F, Grigoriadis A, Tan DP, et al. An integrative genomic and transcriptomic analysis reveals molecular pathways and networks regulated by copy number aberrations in basal-like, HER2 and luminal cancers. Breast Cancer Res Treat. 2010;121(3):575–89. doi:10.1007/s10549-009-0501-3.
5. Taylor BS, Schultz N, Hieronymus H, Gopalan A, Xiao Y, Carver BS, et al. Integrative genomic profiling of human prostate cancer. Cancer Cell. 2010;18(1):11–22. http://dx.doi.org/10.1016/j.ccr.2010.05.026. 6. The Cancer Genome Atlas. Integrated genomic analyses of ovarian
carcinoma. Nature. 2011;474:609–15. doi:10.1038/nature10166. 7. Cho Y-J, Tsherniak A, Tamayo P, Santagata S, Ligon A, Greulich H, et al.
Integrative genomic analysis of medulloblastoma identifies a molecular subgroup that drives poor clinical outcome. J Clin Oncol. 2011;29(11):1424–30. doi:10.1200/jco.2010.28.5148.
8. Du Z, Fei T, Verhaak RGW, Su Z, Zhang Y, Brown M, et al. Integrative genomic analyses reveal clinically relevant long noncoding RNAs in human cancer. Nat Struct Mol Biol. 2013;20(7):908–13. doi:10.1038/nsmb.2591. http://www.nature.com/nsmb/journal/v20/n7/abs/
nsmb.2591.html#supplementary-information.
9. Mankoo PK, Shen R, Schultz N, Levine DA, Sander C. Time to recurrence and survival in serous ovarian tumors predicted from integrated genomic profiles. PLoS ONE. 2011;6(11):e24709. doi:10.1371/journal.pone.0024709. 10. Kim D, Shin H, Song YS, Kim JH. Synergistic effect of different levels of
genomic data for cancer clinical outcome prediction. J Biomed Inform. 2012;45:1191–8. doi:10.1016/j.jbi.2012.07.008.
11. Li Q, Seo J-H, Stranger B, McKenna A, Pe’er I, LaFramboise T, et al. Integrative eQTL-based analyses reveal the biology of breast cancer risk loci. Cell. 2013;152(3):633–41. http://dx.doi.org/10.1016/j.cell.2012.12.034. 12. Mo Q, Wang S, Seshan VE, Olshen AB, Schultz N, Sander C, et al. Pattern
discovery and cancer gene identification in integrated cancer genomic data. Proc Natl Acad Sci. 2013;110(11):4245–50. doi:10.1073/pnas.1208949110. 13. Joung J-G, Kim D, Lee SY, Kang HJ, Kim JH. Integrated analysis of
microRNA-target interactions with clinical outcomes for cancers. BMC Med Genet. 2014;7 Suppl 1:S10.
14. Kim D, Shin H, Sohn K-A, Verma A, Ritchie MD, Kim JH. Incorporating inter-relationships between different levels of genomic data into cancer clinical outcome prediction. Methods. 2014;67(3):344–53. http://dx.doi.org/10.1016/ j.ymeth.2014.02.003.
15. Wang B, Mezlini AM, Demir F, Fiume M, Tu Z, Brudno M, et al. Similarity network fusion for aggregating data types on a genomic scale. Nat Meth. 2014;11(3):333–7. doi:10.1038/nmeth.2810. http://www.nature.com/nmeth/ journal/v11/n3/abs/nmeth.2810.html#supplementary-information. 16. Loi S, Michiels S, Lambrechts D, Fumagalli D, Claes B, Kellokumpu-Lehtinen
P-L, et al. Somatic mutation profiling and associations with prognosis and trastuzumab benefit in early breast cancer. J Natl Cancer Inst.
2013;105(13):960–7. doi:10.1093/jnci/djt121.
17. Patani N, Jiang WG, Newbold RF, Mokbel K. Histone-modifier gene expression profiles are associated with pathological and clinical outcomes in human breast cancer. Anticancer Res. 2011;31(12):4115–25.
18. Wong K-K, Izaguirre DI, Kwan S-Y, King ER, Deavers MT, Sood AK, et al. Poor survival with wild-type TP53 ovarian cancer? Gynecol Oncol.
2013;130(3):565–9. http://dx.doi.org/10.1016/j.ygyno.2013.06.016. 19. Chen R, Khatri P, Mazur PK, Polin M, Zheng Y, Vaka D, et al. A meta-analysis
of lung cancer gene expression identifies PTK7 as a survival gene in lung adenocarcinoma. Cancer Res. 2014. doi:10.1158/0008-5472.can-13-2775. 20. Yoshihara K, Tsunoda T, Shigemizu D, Fujiwara H, Hatae M, Fujiwara H, et al.
High-risk ovarian cancer based on 126-gene expression signature is uniquely characterized by downregulation of antigen presentation pathway. Clin Cancer Res. 2012;18:1374–85. doi:10.1158/1078-0432.CCR-11-2725. 21. Zhang W, Ota T, Shridhar V, Chien J, Wu B, Kuang R. Network-based survival
analysis reveals subnetwork signatures for predicting outcomes of ovarian cancer treatment. PLoS Comput Biol. 2013;9:e1002975. doi:10.1371/ journal.pcbi.1002975.
22. Vandin F, Upfal E, Raphael BJ. Algorithms for detecting significantly mutated pathways in cancer. J Comput Biol. 2011;18(3):507–22. doi:10.1089/ cmb.2010.0265.
23. Vandin F, Clay P, Upfal E, Raphael BJ. Discovery of mutated subnetworks associated with clinical data in cancer. Pacific Symposium on Biocomputing Pacific Symposium on Biocomputing. 2012. p. 55–66.
24. Pauling JK, Christensen AG, Batra R, Alcaraz N, Barbosa E, Larsen MR, et al. Elucidation of epithelial-mesenchymal transition-related pathways in a triple-negative breast cancer cell line model by multi-omics interactome analysis. Integr Biol. 2014;6(11):1058–68. doi:10.1039/c4ib00137k. 25. Gorringe KL, George J, Anglesio MS, Ramakrishna M, Etemadmoghadam D,
Cowin P et al. Copy number analysis identifies novel interactions between genomic loci in ovarian cancer. PLoS One. 2010;5. doi:10.1371/
journal.pone.0011408
26. Languino LR, Kohn KW, Zeeberg BM, Reinhold WC, Pommier Y. Gene expression correlations in human cancer cell lines define molecular interaction networks for epithelial phenotype. PLoS One. 2014;9(6):e99269. doi:10.1371/journal.pone.0099269.
27. Hong S, Dong H, Jin L, Xiong M. Gene co-expression network analysis of two ovarian cancer datasets. 2010. p. 269–74. doi:10.1109/
bibmw.2010.5703811.
28. Hofree M, Shen JP, Carter H, Gross A, Ideker T. Network-based stratification of tumor mutations. Nat Methods. 2013;10(11):1108–15. doi:10.1038/ nmeth.2651.
29. Jeong H-H, Kim S, Wee K, Sohn K-A. Investigating the utility of clinical outcome-guided mutual information network in network-based Cox regres-sion. BMC Syst Biol. 2015;9 Suppl 1:S8.
30. Siegel R, Naishadham D, Jemal A. Cancer Statistics. 2013;2013(63):11–30. doi:10.3322/caac.21166.
31. Heintz APM, Odicino F, Maisonneuve P, Quinn MA, Benedet JL, Creasman WT, et al. Carcinoma of the ovary. FIGO 26th Annual Report on the Results of Treatment in Gynecological Cancer. Int J Gynaecol Obstet. 2006;95 Suppl 1:S161–92. doi:10.1016/S0020-7292(06)60033-7.
32. Shannon CE. A mathematical theory of communication. Bell Syst Tech J. 1948;27:379–423.
33. Liang K-C, Wang X. Gene regulatory network reconstruction using conditional mutual information. EURASIP J Bioinform Syst Biol. 2008;2008:253894. doi:10.1155/2008/253894.
34. Butte AJ, Kohane IS. Mutual information relevance networks: functional genomic clustering using pairwise entropy measurements. Pacific Symposium on Biocomputing Pacific Symposium on Biocomputing. 2000. p. 418–29.
36. Leem S, Jeong H-H, Lee J, Wee K, Sohn K-A. Fast detection of high-order epistatic interactions in genome-wide association studies using information theoretic measure. Comput Biol Chem. 2014. doi:10.1016/ j.compbiolchem.2014.01.005.
37. Steuer R, Kurths J, Daub CO, Weise J, Selbig J. The mutual information: detecting and evaluating dependencies between variables. Bioinformatics (Oxford, England). 2002;18 Suppl 2:S231–40.
38. Sohn I, Sung CO. Predictive modeling using a somatic mutational profile in ovarian high grade serous carcinoma. PLoS One. 2013;8:e54089. doi:10.1371/journal.pone.0054089.
39. Plackett RL. Karl Pearson and the Chi-squared test. Int Stat Rev. 1983;51(1):59–72. doi:10.2307/1402731.
40. Hahn LW, Ritchie MD, Moore JH. Multifactor dimensionality reduction software for detecting gene-gene and gene-environment interactions. Bioinformatics. 2003;19:376–82. doi:10.1093/bioinformatics/btf869. 41. Moore JH, Gilbert JC, Tsai C-T, Chiang F-T, Holden T, Barney N, et al. A
flexible computational framework for detecting, characterizing, and interpreting statistical patterns of epistasis in genetic studies of human disease susceptibility. J Theor Biol. 2006;241:252–61. doi:10.1016/j.jtbi.2005.11.036. 42. Jeong H, Tombor B, Albert R, Oltvai ZN, Barabási AL. The large-scale
organization of metabolic networks. Nature. 2000;407:651–4. doi:10.1038/35036627.
43. Diez D, Wheelock AM, Goto S, Haeggström JZ, Paulsson-Berne G, Hansson GK, et al. The use of network analyses for elucidating mechanisms in cardiovascular disease. Mol BioSyst. 2010;6:289–304. doi:10.1039/b912078e. 44. Carter SL, Brechbühler CM, Griffin M, Bond AT. Gene co-expression network
topology provides a framework for molecular characterization of cellular state. Bioinformatics (Oxford, England). 2004;20:2242–50. doi:10.1093/bio-informatics/bth234.
45. Zhang B, Horvath S. A general framework for weighted gene co-expression network analysis. Stat Appl Genet Mol Biol. 2005;4:Article17. doi:10.2202/ 1544-6115.1128.
46. Reguly T, Breitkreutz A, Boucher L, Breitkreutz B-J, Hon GC, Myers CL, et al. Comprehensive curation and analysis of global interaction networks in Saccharomyces cerevisiae. J Biol. 2006;5:11. doi:10.1186/jbiol36. 47. Ashburner M, Ball CA, Blake JA, Botstein D, Butler H, Cherry JM, et al. Gene
ontology: tool for the unification of biology. The Gene Ontology Consortium Nat Genet. 2000;25:25–9. doi:10.1038/75556. 48. Shannon P, Markiel A, Ozier O, Baliga NS, Wang JT, Ramage D, et al.
Cytoscape: a software environment for integrated models of biomolecular interaction networks. Genome Res. 2003;13:2498–504. doi:10.1101/gr.1239303. 49. Maere S, Heymans K, Kuiper M. BiNGO: a Cytoscape plugin to assess
overrepresentation of Gene Ontology categories in Biological Networks. Bioinformatics. 2005;21:3448–9. doi:10.1093/bioinformatics/bti551. 50. Cerami E, Gao J, Dogrusoz U, Gross BE, Sumer SO, Aksoy BA, et al. The cBio
cancer genomics portal: an open platform for exploring multidimensional cancer genomics data. Cancer Discov. 2012;2:401–4. doi:10.1158/2159-8290.CD-12-0095.
51. Gao J, Aksoy BA, Dogrusoz U, Dresdner G, Gross B, Sumer SO, et al. Integrative analysis of complex cancer genomics and clinical profiles using the cBioPortal. Sci Signal. 2013;6:pl1. doi:10.1126/scisignal.2004088. 52. Mermel C, Schumacher S, Hill B, Meyerson M, Beroukhim R, Getz G.
GISTIC2.0 facilitates sensitive and confident localization of the targets of focal somatic copy-number alteration in human cancers. Genome Biol. 2011;12(4):R41.
53. Bashashati A, Haffari G, Ding J, Ha G, Lui K, Rosner J, et al. DriverNet: uncovering the impact of somatic driver mutations on transcriptional networks in cancer. Genome Biol. 2012;13(12):R124.
54. Forbes SA, Bindal N, Bamford S, Cole C, Kok CY, Beare D, et al. COSMIC: mining complete cancer genomes in the Catalogue of Somatic Mutations in Cancer. Nucleic Acids Res. 2011;39 suppl 1:D945–50. doi:10.1093/nar/gkq929. 55. Jäättelä M. Escaping cell death: survival proteins in cancer. Exp Cell Res.
1999;248:30–43. doi:10.1006/excr.1999.4455.
56. Mani A, Gelmann EP. The ubiquitin-proteasome pathway and its role in cancer. J Clin Oncol. 2005;23:4776–89. doi:10.1200/JCO.2005.05.081. 57. Liberzon A, Subramanian A, Pinchback R, Thorvaldsdottir H, Tamayo P,
Mesirov JP. Molecular signatures database (MSigDB) 3.0. Bioinformatics. 2011;27(12):1739–40. doi:10.1093/bioinformatics/btr260.
58. Courtney KD, Corcoran RB, Engelman JA. The PI3K pathway as drug target in human cancer. J Clin Oncol. 2010;28(6):1075–83. doi:10.1200/jco.2009.25.3641.
59. Mazzoletti M, Broggini M. PI3K/AKT/mTOR inhibitors in ovarian cancer. Curr Med Chem. 2010;17(36):4433–47.
60. Kanehisa M, Goto S, Sato Y, Kawashima M, Furumichi M, Tanabe M. Data, information, knowledge and principle: back to metabolism in KEGG. Nucleic Acids Res. 2014;42(Database issue):D199–205. doi:10.1093/nar/gkt1076. 61. D’Andrilli G. Cell cycle genes in ovarian cancer: steps toward earlier
diagnosis and novel therapies. Clin Cancer Res. 2004;10(24):8132–41. doi:10.1158/1078-0432.ccr-04-0886.
62. Chang C-C, Hung C-M, Yang Y-R, Lee M-J, Hsu Y-C. Sulforaphane induced cell cycle arrest in the G2/M phase via the blockade of cyclin B1/CDC2 in human ovarian cancer cells. J Ovarian Res. 2013;6(1):41. doi:10.1186/1757-2215-6-41. 63. Sa R. Progress in human tumour immunology and immunotherapy. Nature.
2001;411:380–4. doi:10.1038/35077246.
64. Jin C, Yu W, Lou X, Zhou F, Han X, Zhao N, et al. UCHL1 is a putative tumor suppressor in ovarian cancer cells and contributes to cisplatin resistance. J Cancer. 2013;4:662–70. doi:10.7150/jca.6641.
65. Kobayashi H, Terao T, Kawashima Y. Serum sialyl Tn as an independent predictor of poor prognosis in patients with epithelial ovarian cancer. J Clin Oncol. 1992;10:95–101.
Submit your next manuscript to BioMed Central and take full advantage of:
• Convenient online submission
• Thorough peer review
• No space constraints or color figure charges
• Immediate publication on acceptance
• Inclusion in PubMed, CAS, Scopus and Google Scholar
• Research which is freely available for redistribution