90
THE EFFECT OF FINANCIAL STRUCTURE DECISIONS ON FIRMS’
PROFITABILITY: EVIDENCE FROM SELECTED TEXTILE AND GARMENT
FACTORIES IN ETHIOPIA
Arega SEYOUM
Jimma university, Ethiopia
Ganfure TAREKEGN
Jimma university, Ethiopia
Wakuma BORA
Jimma university, Ethiopia
Received: April 21, 2020 Accepted: May 26, 2020 Published: June 01, 2020
Abstract
:This study analyzed the effect of financial structure on profitability of Textile Factories in Ethiopia using panel data of eleven Textile and garment Factories. The study period covers from year 2009 to 2019. The collected panel data were analyzed using fixed effect regression on STATA 14 software and Pearson correlation to test the relationship between financial structure variables and return on asset (ROA). Again a random effect was used to test the relationship between financial structure variables and return on equity (ROE). The outcome of this research revealed that financial structure has significant and negative effect on the profitability, in terms of return on asset (ROA), while it has significant and positive effect on profitability in terms of return on equity (ROE) of sampled textile and garment firms in Ethiopia. The effect of financial structure, therefore, has brought mixed effects on the profitability of textile and garment firms in Ethiopia during the study period. Then, based on the findings the researcher recommended that management body of every sampled textile and garment firms should make financial analysis, economic condition of the nation or the region, respecting the majority of shareholders interest and take appropriate financing decision in order to remain profitable and competitive. In doing so, the firms need to strike a balance between their choice of financial structure and their effects on their profitability.
Keywords:
Financial structure, Profitability, Regression, Textile factories and Ethiopia
1.
Introduction
1.1 Background of the study
91
firm for maximizing return to the various stakeholders and also enhance firm’s ability to operate in a competitive environment. (Yitayew, 2013) investigated Capital Structure and Financial Performance on cement factories for the period 2010- 2014 and found that capital structure has significant positive relationship with return on assets (ROA) where as it has significant negative relationship with return on equity (ROE) of sampled cement companies. In recent years, researchers come up with different perspectives of their studies regarding the effect of capital structure on firms’ profitability; some revealed the positive relationship between capital structure and company profit (Safiuddin et al., 2015) while others revealed the negative relationship (Ramezanalivaloujerdi et al., 2015). These controversial results, therefore, reveals that country, industry, and firm level situation provided an opportunity for the researchers to add their knowledge by analyzing the effect of capital structure on profitability of textile and garment factories in Ethiopia.
1.2 Statement of the problem
The general economic growth and improvement of business environment determines the firm’s financial structure decision towards internal sources of financing or external sources or both at a time. According to (Kajananthan, 2012), the key elements of the firms’ financial strategy and financial performance was its successful financial sources selection criteria and financial mix decision. a study on financial structure is supposed to cover both types of financing; long term debt to equity ratio and short-term debt to equity sources. In previously conducted empirical studies report a mixed result regarding the effect of financial structure on the profitability of firms. For instance in Chinese firms, a negative correlation between leverage and performance, described by the ratio of earnings before interest and tax to total assets, was found in the (Huang & Song, 2006; Chakraborty, 2010). Similarly (Xu, 2012), addressed that profitability was negatively correlated with leverage. In contrary, a study by (Gill et al., 2011) showed that short-term debt to total assets; long-term debt to total assets; and total debt to total assets had positive impact on profitability in terms of ROA. Similarly, (Aryanto & Fransiska, 2012) showed that there is a positive relationship between short-term debt and total debt and financial performance (ROA), but a negative impact from long-term debt to profitability expressed through return on equity (ROE). There was also a study such as (Ebaid, 2009), where no significant impact was found between financial structure choices and performance.
Studies examining the effects of capital structure on the profitability of manufacturing firms specifically Textile Factories in Ethiopia appear scanty. For instance, (Yitayew, 2013) investigated Capital Structure and Financial Performance on cement factories for the period 2010- 2014 and found that capital structure has significant positive relationship with return on assets (ROA) where as it has significant negative relationship with return on equity (ROE) of sampled cement companies. Even though the investigator came up with a mixed result, his study and finding could only be used in the context of firms that use long term debt and equity financing thereby excluding short term debt to equity financing. According to (Birassa, 2016) measured Ethiopian manufacturing companies’ Profitability based on Return on Capital Employed (ROCE) which he defined as total assets or total equity of shareholders minus short term debt liabilities and finally he identified that proportions of debt to equity, debt to total asset, short-term debt and long-term debt profile have significant influence on corporate profits. Another study examined effects of financial structure decision on financial performance of Ethiopian metal and engineering industry and found out that capital structure has a significant and positive effect on financial performance as measured by debt ratio (Melese, 2013). But the researcher excluded the aspect of equity financing and therefore their paper findings could not be applicable to those firms that use equity financing in their capital structure.
These researchers’ mixed findings were not only show the complex nature of financial structure decision and its effect but also invites for further study on similar topic especially in firms like Ethiopian textile and garment factories which are at its infant stage. Moreover, the problems of variable insufficiency identified in the above studies need to be addressed. Accordingly, the general aim of this study is to investigate how far financial components structure affects the Profitability of Textile and garment factories in Ethiopia using Eleven years data starting from 2009 up to 2019.
1.3 Specific objectives
92
4. To examine the impact of long term debt to equity on the profitability of textile and garment companies.
5. To investigate the firm’s size effect on the profitability of selected textile and garment companies 6. To analysis the effect of gross domestic product growth on the profitability of selected textile and
garment companies.
2. Literature Review
Decision on financial structure decision is among the challenging issues facing companies because its decision determines the performance and survival of the company. In several studies previously conducted, there are different views with respect to the financial structures firms in order to maximize the firm’s value. The traditional model assumes that the value of the company is affected in the way it is financed and it better if firms finance decision is at a point where weighted average cost of capital is minimized (Frentzel, 2013). According to Modigliani and Miller theory as cited in (Handoo & Sharma, 2014) study, there is an advantage for corporations to be financed with debt because of the balance between the tax benefits gained by corporations and costs of bankruptcy due to the risk of taking more debts.
On other way, the pecking order theory states that companies should prioritizes their sources of financing, first preferring internal financing, then debt, lastly equity as a last resort. Similarly, (Maselle, 2016) argued that firms would prefer internal source of finance as compared to expensive or costly external finance and therefore profitable firms that generate earnings are expected to use less debt than those that do not generate earnings. Agency theory also states that leverage companies are better for their shareholders because debt level can be used as a monitoring tool for managers hence maximize company performance by lowering inefficiencies and agency costs (Chinaemerem & Anthony, 2012). (Kipesha & James, 2014) argued that business firms especially small ones are said to die or poorly perform due to different challenges facing managers on the financing decisions. Thus, which theory works for Ethiopian textile and garment factories is still questionable issue.
2.1. Empirical Literature Review
Several empirical studies have been conducted around the world to measure the relationship between capital structure and company profitability. In most cases, researchers came up with mixed results; some revealed a positive relationship between the variables, others revealed the negative relationship while other researchers revealed the contradictory results between study variables. These results show that the topic is still debatable from country to country, industry to industry and firms to firm’s characteristics.
2.1.1. Negative association between capital structure and firm profitability.
93
2.1.2. Positive associations between capital structure and firm profitability.
Another study was done by (Babalola, 2012) on the effect of optimal capital structure on manufacturing firms’ performance in Nigeria, used a sample of 10 firms from 2000 to 2009. Researcher used debt ratio as capital structure variable against company performance, and found that there is a relationship between the distribution of debt ratio and corporate performance and their main conclusion was that the manufacturing industries was consistent with trade off theory. According to (Yusuf et al., 2014) a performance variables of return on assets (ROA) and return on equity (ROE) were used and the outcomes indicated that the relationship between capital structure and return on asset is not significant across all firms and insignificant relationship was shown between return on equity and debt to asset ratio however the results showed the significant relationship between return on equity and debt to equity ratio for all firms. This justifies that a highly geared firm tend to have high profitability.
In Malaysia a research by (Ahmad et al., 2012), on a panel data of 58 firms from 2005 to 2010 results indicated that only short-term debt and total debt had a significant relationship with return on assets (ROA), other financial structure variables had a significant and positive relationship with return on equity (ROE). A study was conducted to test independent variables firm size, firm age, asset tangibility and growth opportunities against dependent variables of ROA and ROE and finally discovered a positive relationship between controlling variables and performance variables of the companies (Ahmad et al., 2012). Another study showing positive relationship was conducted by (Nirajini & Priya, 2013) who targeted listed trading companies in Sri-lanka, and analyzed variables using correlation method and come up with the conclusion that debt to asset ratio and debt to equity ratio of listed companies correlated with gross profit margin, net profit, ROCE and ROE at significant and positive relationship.
2.1.3. Mixed results relationship between financial decision and profitability
The results of (Goyal, 2013) study on listed public sector banks in India validated a strong positive dependence of short term debt to capital with all profitability measures of ROA, ROE and EPS while long term debt to capital and total debt to capital had a negative relationship with return on assets (ROA), return on equity (ROE) and Earning per share (EPS). In 2014, another Kipesha’s study on commercial banks in Tanzania, used fixed effect regression model and the results indicated the a presence of significant negative relationship between total debt to equity and long term debt to equity with bank cost efficiency and return on equity, and he also specified something which implies the presence of negative trade-off between firm leverage and firm performance. The same study indicated a causality relationship between firm leverage and return on asset.
(Pouraghajan et al., 2012) in Tehran used Pearson correlation and multiple regression models to test the relationship between independent variables of debt ratios against dependent variables of return on asset (ROA) and return on equity (ROE). He also used controlling variables of asset turnover, firm size, and asset tangibility and growth opportunity as other independent variables of the study. The results of the study indicated a negative relationship between debt ratio and financial performance. Also, results indicated a significant positive relationship between asset turnover, firm size, and asset tangibility and growth opportunity with financial performance measure. Due to this conclusion, it was not clear whether capital structure influenced performance or not, for that case the further study on this relationship has to be conducted.
3. Research Design and Methodology
94
3.1. Method of data Analysis
The researcher used the Haussman test to get an appropriate method of measuring a balanced panel data between random effect and fixed effect regression model. After testing Haussman, the researcher selected fixed effect regression. Both tests were employed to compare the fixed and random effects estimates of the coefficients. Moreover, Pearson correlation was used to measure the relationship between independent and dependent variables of the study. STATA 14 software program was used as analyzing tool.
3.2. Model Specification
Model1:
𝑅𝑂𝐴
𝑖𝑡= 𝛼
𝑖𝑡+ 𝛽
1𝑇𝐷𝑇𝐴
𝑖𝑡+ 𝛽
2𝐿𝐷𝑇𝐴
𝑖𝑡+ 𝛽
3𝑆𝐷𝑇𝐴
𝑖𝑡+ 𝛽
4𝑇𝐷𝐸𝑄
𝑖𝑡+ 𝛽
5𝐿𝐷𝐸𝑄
𝑖𝑡+
𝛽
6𝑆𝐷𝐸𝑄
𝑖𝑡+ 𝛽
7𝑆𝐼𝑍𝐸
𝑖𝑡+ 𝛽
8𝐺𝐷𝑃
𝑖𝑡+ 𝑒
𝑖𝑡Model2:
𝑅𝑂𝐸
𝑖𝑡= 𝛼
𝑖𝑡+ 𝛽
1𝑇𝐷𝑇𝐴
𝑖𝑡+ 𝛽
2𝐿𝐷𝑇𝐴
𝑖𝑡+ 𝛽
3𝑆𝐷𝑇𝐴
𝑖𝑡+ 𝛽
4𝑇𝐷𝐸𝑄
𝑖𝑡+ 𝛽
5𝐿𝐷𝐸𝑄
𝑖𝑡+
𝛽
6𝑆𝐷𝐸𝑄
𝑖𝑡+ 𝛽
7𝑆𝐼𝑍𝐸
𝑖𝑡+ 𝛽
8𝐺𝐷𝑃
𝑖𝑡+ 𝑒
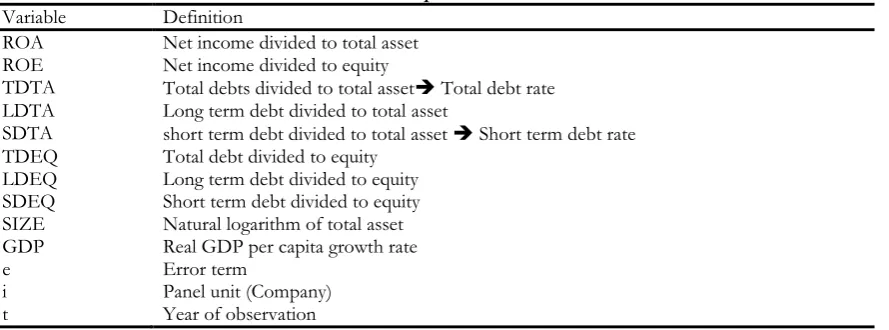
𝑖𝑡Table 1. Description of variables Variable Definition
ROA Net income divided to total asset ROE Net income divided to equity
TDTA Total debts divided to total asset Total debt rate LDTA Long term debt divided to total asset
SDTA short term debt divided to total asset Short term debt rate TDEQ Total debt divided to equity
LDEQ Long term debt divided to equity SDEQ Short term debt divided to equity SIZE Natural logarithm of total asset GDP Real GDP per capita growth rate
e Error term
i Panel unit (Company)
t Year of observation
Source; researchers Design
4. Discussions and Results
It is important to study which factors have an influence on the financial structure, as this in turn has an influence on the economic and financial performances of firms. To reduce risk and increase performances of firms and shareholders, for managers, identifying an optimal financial structure is one of the very important and pertinent decisions in corporate finance. An imbalance in loans and their ability to generate financial efficiency can lead to financial distress and finally towards insolvency. Therefore, to make a precise delineation of the capital proportions, it is vigorous to have a well-adjusted report on the use of equity and borrowed capital as sources of financing, factors that affects financial structure, and their influences.
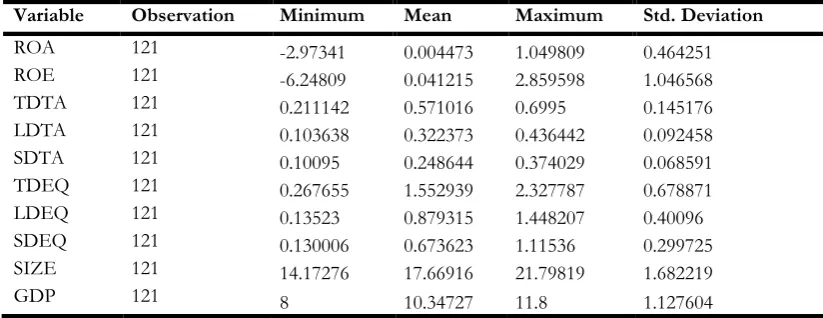
4.1. Descriptive Analysis results
The descriptive statistics result indicates the mean value of return on asset ratio (ROA) was 0.4473% measured from every ETB10000 assets employed while the return on equity ratio (ROE) was 4.1215% measured on every ETB10000 shareholders. This indicate that the sample textile and garment companies have less utilization of assets to generate profit than shareholders fund(equity) during the study period.
95
Variable Observation Minimum Mean Maximum Std. Deviation
ROA 121 -2.97341 0.004473 1.049809 0.464251
ROE 121 -6.24809 0.041215 2.859598 1.046568
TDTA 121 0.211142 0.571016 0.6995 0.145176
LDTA 121 0.103638 0.322373 0.436442 0.092458
SDTA 121 0.10095 0.248644 0.374029 0.068591
TDEQ 121 0.267655 1.552939 2.327787 0.678871
LDEQ 121 0.13523 0.879315 1.448207 0.40096
SDEQ 121 0.130006 0.673623 1.11536 0.299725
SIZE 121 14.17276 17.66916 21.79819 1.682219
GDP 121 8 10.34727 11.8 1.127604
Source: Researchers finding, 2019
The study variable total debt to total asset ratio (TDTA) 57.1 percent of the company’s assets was financed by debt while the remaining 42.9% financed by the equity. More specifically, from the debt finance ratios, the short-term finance accounts mean value of 24.86% measured by short term debt to total asset ratio (SDTA). From this, on average, the long-term debt used to finance company operations covers 32.24 percent. To strengthen the analysis once more, the study further identified a financial structure variable of total debt to equity ratio (TDEQ) has mean value of 1.552939, indicating sample selected textile and garment companies have about ETB1.60 debt for every ETB of equity with standard deviation of 0.678871. This means the greatest proportions of their resources and daily operations or current assets were financed by debt as compared to equity. The proportion of total debt arises the question of efficiency near managers. The greatest standard deviation signifies a great variation among the firms. Based on this descriptive result, if the selected textile and garment continue in this manner, the firms might face bankruptcy. The study also considered short term debt to equity ratio (SDEQ) as compared to a long term to equity ratio (LDEQ) mean was 87.93 percent and found that the sample selected textile and garment companies use less short-term debts mean was 67.36 percent with 29.97 percent standard deviation as their source of finance than long term debts.
4.2. Regression and Correlation Analysis Result 4.2.1. Correlation Analysis Result
In this study, different post-estimation diagnostic tests were performed to guarantee that the Gaussian Classical Linear Regression Models (CLRM) assumptions are not violated and the estimation results and inferences are trustworthy. Therefore, using various appropriate statistical tests and all of the tests were shown us free of multi-collinearity, Heteroskedasticity, Auto-collineaity and normality problems depends on the work of (Brooks, 2019) discussions. To perform a correlation analysis, Pearson product moment of correlation coefficient was used and presented below including the regression results of the study.
Table 2: Correlation matrix of variables used in this study
ROA ROE TDTA LDTA SDTA TDEQ LDEQ SDEQ SIZE GDP
ROA 1
ROE -0.342 1
TDTA -0.329 0.065 1
LDTA -0.647 0.224 0.737 1
SDTA -0.0508 0.0342 0.528 0.341 1
96
LDEQ -0.1551 -0.0212 0.1754 0.1654 0.073 0.0916 1
SDEQ 0.0557 -0.254 0.1091 -0.068 0.132 0.513 0.1435 1
SIZE 0.1283 0.043 -0.081 0.0119 0.0212 0.0331 -0.24 -0.095 1
GDP 0.345 -0.1624 -0.069 -0.068 0.263 -0.42 -0.176 -0.099 0.0606 1
The correlation analysis was undertaken and revealed a negative correlation between profitability in terms of return on asset ratio (ROA) and financial structure variables of total debt to total asset ratio (TDTA) and long term debt to total asset ratio (LDTA) at 5% significant level. While the remaining financial structure variables like short term debt to total asset (SDTA), total debt to equity (TDEQ), long term debt to equity (LDEQ) and short term debt to equity (SDEQ) ratios has not significant relationship with profitability in terms of return on asset ratio (ROA). The two control variables; real GDP growth rate (GDP) has positive relationship between gross domestic product (GDP) and profitability in terms of return on asset (ROA) was consistent with previous studies by (Anbar & Alper, 2011), (Alexiou & Sofoklis, 2009). And size of the company is negatively related with profitability of sample selected textile and garment companies.
The correction between profitability in terms of return on equity (ROE) and financial structure variable of long term debt to total asset ratio (LDTA) was positively correlated while short term debt to equity ratio (SDEQ) was significantly and negatively correlated. The remaining financial structure variables such as, total debt to total asset ratio (TDTA), short term debt to total asset (SDTA), total debt to equity (TDEQ), and long term debt to equity (LDEQ) ratios has not significant relationship with profitability in terms of return on equity (ROE). The Control variables; size of the companies (SIZE) and real GDP growth rate (GDP) were not statistically significant relationship with profitability measured by return on equity (ROE) of sample selected textile and garment companies.
4.2.2. Regression Analysis Result
In this study two profitability indicators were used namely return on asset (ROA) and return on equity (ROE) thus, two set of models were developed.
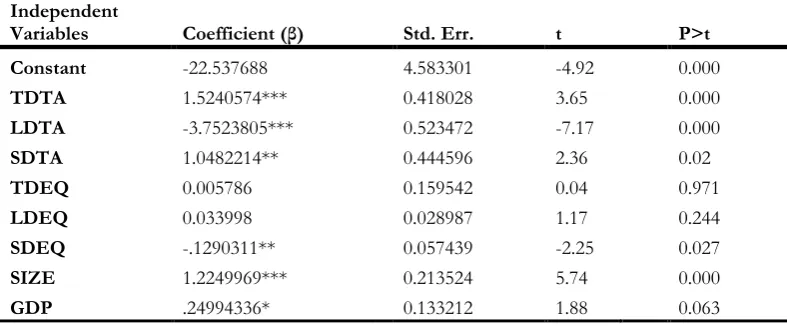
4.2.2.1. Financial Structure Effect on Profitability (ROA)
The Fixed-Effect Panel least squares result of (ROA) model1 obtained by regressing return on asset (ROA) on independent variables. The adjusted〖 R〗^2, which measures how well the regression model explains the actual variation in the dependent variable, has a value of 62.80 percent.
Table 3: Model1: Financial Structure Effect on Profitability (ROA) Independent
Variables Coefficient (β) Std. Err. t P>t
Constant -22.537688 4.583301 -4.92 0.000
TDTA 1.5240574*** 0.418028 3.65 0.000
LDTA -3.7523805*** 0.523472 -7.17 0.000
SDTA 1.0482214** 0.444596 2.36 0.02
TDEQ 0.005786 0.159542 0.04 0.971
LDEQ 0.033998 0.028987 1.17 0.244
SDEQ -.1290311** 0.057439 -2.25 0.027
SIZE 1.2249969*** 0.213524 5.74 0.000
GDP .24994336* 0.133212 1.88 0.063
97
Companies = 11 Obs. Year: 2009-2019
The parenthesis *, **, *** denoted for significant variables at 10%, 5%, and 1% respectively
The regression result revealed that total debt to total asset ratio (TDTA) is positive and statistically significant at 1 percent. It shows an increase in total debt to total asset (TDTA) by one percent, on average, influences return on asset (ROA) in positive direction by 152.41% for sample selected textile and garment companies in the study period. Long term debt to total asset ratio (LDTA) is also statistically significant at 1 percent but negatively correlated to ROA. This means, on average, an increase in long term debt to total asset ratio (LDTA) by one percent (100 birr) influences return on asset (ROA) in negative direction by 375.24 percent (37,524 birr). Short term debt to total asset ratio (SDTA), indicated when, on average, an increase in short term debt to total asset by one percent influences return on asset (ROA) in positive direction by 104.82 percent and short term debt finance is statistically significant at 5 percent significance level.
Another financial structure variable in this study was short term debt to equity ratio (SDEQ) and it was negatively correlated to ROA but statistically significant 5 percent. This shows that at average value, the one hundred Birr increase in short term debt to equity would decrease the return on asset (ROA) by Birr 12.90. Thus, financial structure in favor of debt financing measured by short term debt to equity significantly influences the profit (ROA) of selected textile and garment companies in Ethiopia. The two control variables; size of companies (SIZE) and real GDP growth rate (GDP) showed statistically significant at 1 percent and positively correlated to ROA during the study period. This indicates that when on average one ETB increase in the asset of the company would increase the return on asset (ROA) by ETB1.2249969. And, on average, an increase in GDP by one percent influences return on asset (ROA) in positive direction by 24.99 percent for sample selected textile and garment companies in the study period.
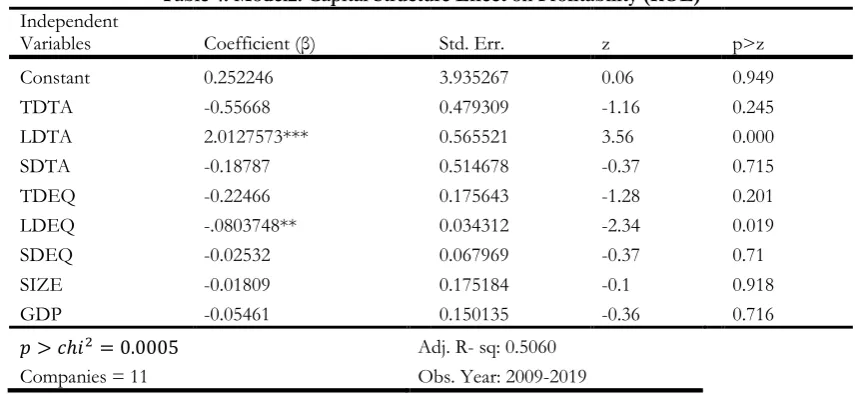
4.2.3. Capital Structure Effect on Profitability (ROE)
Table 4: Model2: Capital Structure Effect on Profitability (ROE) Independent
Variables Coefficient (β) Std. Err. z p>z
Constant 0.252246 3.935267 0.06 0.949
TDTA -0.55668 0.479309 -1.16 0.245
LDTA 2.0127573*** 0.565521 3.56 0.000
SDTA -0.18787 0.514678 -0.37 0.715
TDEQ -0.22466 0.175643 -1.28 0.201
LDEQ -.0803748** 0.034312 -2.34 0.019
SDEQ -0.02532 0.067969 -0.37 0.71
SIZE -0.01809 0.175184 -0.1 0.918
GDP -0.05461 0.150135 -0.36 0.716
𝑝 > 𝑐ℎ𝑖2= 0.0005 Adj. R- sq: 0.5060
Companies = 11 Obs. Year: 2009-2019
The parenthesis **, *** denoted for significant variables at 5%, and 1% respectively
98
Financial structure variable of long-term debt to equity ratio (LDEQ) is negative and statistically significant. It shows that on average, an increase in long term debt to equity by one ETB would decrease the profit measured by return on equity (ROE) of sample selected textile and garment companies in Ethiopia, by about ETB 0.08037 in the study period. This indicates that on average, capital structure variable of long-term debt to equity has a significant negative effect on the profit of sample selected textile and garment companies as measured by returns on equity (ROE) in the study period.
5. Conclusion and Recommendation
The descriptive and statistical regression result showed total debt rate, was the highest proportion in capital structure decision of selected textile and garment companies in Ethiopia. Even though debt is sometimes the result of growth rate of the firms, but, it statistically and negatively affected the profitability as well as optimum liquidity level of the factories’ assets. Therefore, the researchers believe that it is better to balance the factories growth rate with sources financed especially when external sources required otherwise the profitability will be negatively influenced. Similarly, the pecking order theory and agency theory also recommends similar point because high debt also affects liquidity of the factories. On the other hand, maintaining an optimal capital structure mix decision decreases the degree of the degree of future financial distress. Sometimes, it is assumed that firms will resort to indebtedness to prevent managers from spending from the available cashflow and this might affect the structure of the financial structure decision, thus, it is advisable if the shareholders of the factories protect the adverse action of the mangers. The management body of every textile and garment firms should make financial analysis, economic condition of the nation or the region, respecting the majority of shareholders interest and take appropriate financing decision in order to remain profitable and competitive.
References
Ahmad, Z., Abdullah, N. M. H., & Roslan, S. (2012). Capital structure effect on firms performance: Focusing on consumers and industrials sectors on Malaysian firms. International Review of Business Research Papers, 8(5), 137–155.
Alexiou, C., & Sofoklis, V. (2009). Determinants of bank profitability: Evidence from the Greek banking sector. Economic Annals, 54(182), 93–118.
Anbar, A., & Alper, D. (2011). Bank specific and macroeconomic determinants of commercial bank profitability: Empirical evidence from Turkey. Business and Economics Research Journal, 2(2), 139–152.
Aryanto, R., & Fransiska, M. (2012). The Role of Government Assistance to Generate Competitive Leadership, Commitment, Motivation, Innovation, Environment and its Impact on the Performance of TenunCual Union Industry Cluster in Bangka Belitung Province. Procedia - Social and Behavioral Sciences, 65, 167–172. https://doi.org/10.1016/j.sbspro.2012.11.106
Babalola, Y. A. (2012). The effects of optimal capital structure on firms’ performances in Nigeria. Journal of Emerging Trends in Economics and Management Sciences, 3(2), 131–133.
Birassa, F. (2016). corporate capital structure and its impact on profitability: Evidence from manufacturing firms in Ethiopia. Addis Ababa University.
Brooks, C. (2019). Introductory econometrics for finance. Cambridge university press.
Chinaemerem, O. C., & Anthony, O. (2012). Impact of capital structure on the financial performance of Nigerian firms. Arabian Journal of Business and Management Review (OMAN Chapter), 1(12), 43.
Ebaid, I. E. (2009). The impact of capital‐structure choice on firm performance: empirical evidence from Egypt. The Journal of Risk Finance.
Fred, S. S. (2015). The effect of capital structure on profitability of manufacturing companies in Tanzania. The Open University Of Tanzania.
Frentzel, B. (2013). Capital Structure Theory since Modigliani-Miller Development in the search for the optimal leverage of the firm.
99
Goyal, A. M. (2013). Impact of capital structure on performance of listed public sector banks in India. International Journal of Business and Management Invention, 2(10), 35–43.
Handoo, A., & Sharma, K. (2014). A study on determinants of capital structure in India. IIMB Management Review, 26(3), 170–182. https://doi.org/10.1016/j.iimb.2014.07.009
Iwaki, H. (2019). The effect of debt market imperfection on capital structure and investment: Evidence from the 2008 global financial crisis in Japan. The Quarterly Review of Economics and Finance, 74, 251–266.
Kajananthan, R. (2012). Effect of corporate governance on capital structure: case of the Srilankan listed manufacturing companies. Researchers World, 3(4), 63.
Kipesha, E. F., & James, J. M. (2014). Capital structure and firm performance: Evidence from commercial banks in Tanzania. Research Journal of Finance and Accounting, 5(14), 168–178.
Lavorskyi, M. (2013). The impact of capital structure on firm performance. Thesis MA in financial economics. Kyiv School of Economics. Ukraine.
Leon, S. A. J. (2013). The impact of Capital Structure on Financial Performance of the listed manufacturing firms in Sri Lanka. Global Journal of Commerce & Management Perspective, 2(5), 56–62.
Maselle, R. (2016). The Effect of Capital Structure on Profitability of Listed Manufacturing Companies in Tanzania. The Open University of Tanzania.
Masnoon, M., & Saeed, A. (2014). Capital Structure Determinants of KSE Listed Automobile Companies. Masnoon & Saeed (2014)" Capital Structure Determinants of KSE Listed Automobile Companies" European Scientific Journal, May Edition, 10(13), 451–461.
Melese, A. (2013). The Effect of Capital Structure on Financial Performance: Ethiopia’s Metal and Engineering Industry. Addis Ababa University.
Moradi, A., & Paulet, E. (2019). The firm-specific determinants of capital structure–An empirical analysis of firms before and during the Euro Crisis. Research in International Business and Finance, 47, 150–161.
Nirajini, A., & Priya, K. B. (2013). Impact of capital structure on financial performance of the listed trading companies in Sri Lanka. International Journal of Scientific and Research Publications, 3(5), 1–9.
Pouraghajan, A., Malekian, E., Emamgholipour, M., Lotfollahpour, V., & Bagheri, M. M. (2012). The relationship between capital structure and firm performance evaluation measures: Evidence from the Tehran Stock Exchange. International Journal of Business and Commerce, 1(9), 166–181.
Ramezanalivaloujerdi, R., Rasiah, D., & Narayanasamy, K. (2015). Corporate capital structure and performance of listed construction companies in Malaysia from 2005-2009. International Business Management, 9(3), 191–199. Safiuddin, M., Islam, M. M., & Anisuzzaman, M. (2015). Impact of financial structure on firm’s performance: A
study on financial and nonfinancial sector in Bangladesh. European Journal of Business and Management, 7(3), 30–38.
Sarkar, R. (2017). Reviewing Theoretical and Empirical Literatures on Capital Structure and Firm Performance Relationship-An Exploratory Study. Journal Homepage: International Journal of Research in Social Sciences, 7(10), 2249–2496.
Shubita, M. F., & Alsawalhah, J. M. (2012). The relationship between capital structure and profitability. International Journal of Business and Social Science, 3(16), 104–112.
Tailab, M. (2014). The effect of capital structure on profitability of energy American firms. International Journal of Business and Management Invention, 3(12).
Xu, J. (2012). Profitability and capital structure: Evidence from import penetration. Journal of Financial Economics, 106(2), 427–446. https://doi.org/10.1016/j.jfineco.2012.05.015
Yitayew, A. P. (2013). Capital Structure and Financial Performance: Evidence from Ethiopian Cement Companies. Yusuf, B., Onafalujo, A., Idowu, K., & Soyebo, Y. (2014). Capital Structure and Profitability of quoted firms: The