www.ann-geophys.net/27/4491/2009/
© Author(s) 2009. This work is distributed under the Creative Commons Attribution 3.0 License.
Annales
Geophysicae
STEREO observations of interplanetary coronal mass ejections and
prominence deflection during solar minimum period
E. K. J. Kilpua1, J. Pomoell1, A. Vourlidas3, R. Vainio1, J. Luhmann2, Y. Li2, P. Schroeder2, A. B. Galvin4, and K. Simunac4
1Department of Physics, Division of atmospheric sciences and geophysics, University of Helsinki, Finland 2Space Sciences Laboratory, University of California, Berkeley, CA, USA
3Solar Physics Branch, Naval Research Laboratory, Washington, D.C. 20375, USA
4Institute for the Study of Earth, Oceans, and Space, University of New Hampshire, Durham, NH 03824, USA
Received: 1 June 2009 – Revised: 13 October 2009 – Accepted: 30 November 2009 – Published: 10 December 2009
Abstract. In this paper we study the occurrence rate and so-lar origin of interplanetary coronal mass ejections (ICMEs) using data from the two Solar TErrestrial RElation Obser-vatory (STEREO) and the Wind spacecraft. We perform a statistical survey of ICMEs during the late declining phase of solar cycle 23. Observations by multiple, well-separated spacecraft show that even at the time of extremely weak so-lar activity a considerable number of ICMEs were present in the interplanetary medium. Soon after the beginning of the STEREO science mission in January 2007 the number of ICMEs declined to less than one ICME per month, but in late 2008 the ICME rate clearly increased at each spacecraft al-though no apparent increase in the number of coronal mass ejections (CMEs) occurred. We suggest that the near-ecliptic ICME rate can increase due to CMEs that have been guided towards the equator from their high-latitude source regions by the magnetic fields in the polar coronal holes.
We consider two case studies to highlight the effects of the polar magnetic fields and CME deflection taking advantage of STEREO observations when the two spacecraft were in the quadrature configuration (i.e. separated by about 90 de-grees). We study in detail the solar and interplanetary conse-quences of two CMEs that both originated from high-latitude source regions on 2 November 2008. The first CME was slow (radial speed 298 km/s) and associated with a huge lar crown prominence eruption. The CME was guided by po-lar coronal hole fields to the equator and it produced a clear flux rope ICME in the near-ecliptic solar wind. The second CME (radial speed 438 km/s) originated from an active re-gion 11007 at latitude 35◦N. This CME propagated clearly north of the first CME and no interplanetary consequences
Correspondence to: E. K. J. Kilpua ([email protected])
were identified. The two case studies suggest that slow and elongated CMEs have difficulties overcoming the straining effect of the overlying field and as a consequence they are guided by the polar coronal fields and cause in-situ effects close to the ecliptic plane. The 3-D propagation directions and CME widths obtained by using the forward modelling technique were consistent with the solar and in-situ observa-tions.
Keywords. Interplanetary physics (Interplanetary magnetic fields; Solar wind plasma) – Solar physics, astrophysics, and astronomy (Flares and mass ejections)
1 Introduction
Coronal mass ejections (CMEs) and their interplanetary counterparts (ICMEs) are one of the most studied mani-festations of solar activity. The importance of CMEs and ICMEs for the solar terrestrial research is wide-spread. Inter-planetary shocks driven by fast CMEs accelerate solar ener-getic particles (e.g., Reames, 1999) and ICMEs are the main causes of large magnetic storms in the Earths magnetosphere (e.g., Tsurutani et al., 1988; Gosling et al., 1991; Huttunen et al., 2002; Zhang et al., 2007). In addition, it has been sug-gested that CMEs might play an important role in the solar cycle evolution by releasing closed magnetic flux from the Sun (Owens et al., 2007).
was observed. Cane and Richardson (2003) and Richardson and Cane (2004) also indicated that at solar minimum the fraction of ICMEs that had organized, flux-rope like mag-netic field structure (Burlaga et al., 1981) was clearly larger near solar minimum than at solar maximum.
Spacecraft that are observing the Sun close to the eclip-tic plane are most likely to encounter CMEs that have their source region close to the solar disk center (e.g., Webb et al., 2000). However, CMEs originating from high-latitude source regions sometimes deflect towards the equator while propagating away from the Sun. This deflection is presum-ably caused by the strong magnetic fields in the polar coro-nal holes, which push the CME material towards the equator (e.g., Plunkett et al., 2001; Cremades et al., 2005). CME deflection is an important factor that should be taken into ac-count when comparing the CME rate at the Sun with the near-ecliptic ICME rate. The deflected CME population can also cause geomagnetic storms as indicated by Zhou et al. (2006) who showed that 28% of the Earth-encountering CMEs asso-ciated with high-latitude polar crown filament eruptions pro-duced geomagnetic disturbances withKp≥5+.
Observations by two spacecraft, which are separated by about 90 degrees, allow remote and in-situ observations to be combined in an effective way. In such configuration, called “quadrature”, one spacecraft can observe a CME at the solar limb, thus being able to determine its true radial speed and angular extent while the other spacecraft, ∼90◦ away, ob-serves the in-situ characteristics of the same CME and can also make observations of the source region at the solar disk (e.g., Patsourakos and Vourlidas, 2009).
Solar TErrestrial RElations Observatory (STEREO) (Kaiser et al., 2007), launched in October 2006, consists of two functionally identical spacecraft, one that leads the Earth (STEREO A; STA) and one that lags the Earth (STEREO B; STB) on its orbit around the Sun. The angular separation between STA and STB increases by about 45◦each year. Af-ter about two years in orbit the STEREO spacecraft reached 90 degree separation on January 2009. Thus, from late 2008 the STEREO spacecraft have been in a position suitable for quadrature observations. STEREO observations can be com-bined with measurements from the spacecraft in orbits close to the Lagrangian point L1 (SOHO, Wind, ACE), approxi-mately between the two STEREO spacecraft.
In this paper we study the ICME occurrence rate during so-lar minimum conditions and the CME deflection using obser-vations from the two STEREO and Wind spacecraft. Wind is located at the Lagrangian point L1, more than 200 Earth radii (RE) upstream from the Earth. Combining STEREO and
Wind observations provide data from multiple vantage points and, thus, offer a more reliable estimate of the near-ecliptic ICME rate for the present solar minimum than has been avail-able during the previous solar minima. The ICME rate in-creased in late 2008 although no corresponding increase in the number of active regions and sunspots occurred. We sug-gest that deflection of high-latitude CMEs, either
originat-ing from new solar cycle 24 regions or polar crown promi-nence eruptions, could explain this increase. CME deflection is possible at all phases of solar activity cycle, but because of the dominance of coronal holes in the polar regions the de-flection towards the equator is more likely at solar minimum than at solar maximum. This suggests that the relative con-tribution of deflecting CMEs to the near-ecliptic CME rate could be significant at solar minimum conditions. To demon-strate that a high-latitude CME can produce a clear ICME near the ecliptic plane and to study in detail the CME deflec-tion we investigate solar observadeflec-tions of two high-latitude CMEs that erupted from the Sun on 2 November 2008 as well as their interplanetary consequences. Both CMEs originated from high-latitude source regions, but only the first CME was strongly deflected to the equator and observed by the spacecraft monitoring the near-ecliptic solar wind. STEREO quadrature observations enabled us to combine effectively the white-light, solar disk and interplanetary observations.
In Sect. 2 we present statistical results of the ICMEs ob-served from the start of the STEREO science mission (Jan-uary 2007) through to Jan(Jan-uary 2009 and discuss the associ-ated solar activity. In Sect. 3 we describe solar and interplan-etary observations related to two slow CMEs on 2 November 2008. Finally in Sect. 4 we discuss the observations and in Sect. 5 summarize the results.
2 ICMEs at solar activity minimum
The ICME encounters were searched from the 10-min av-eraged solar wind measurements obtained by the STEREO and Wind spacecraft from the start of the STEREO science mission (January 2007) through to January 2009.
ICME
STA+10
STB WIND+5
(a)
(b)
(c)
(d)
(e)
angle (deg)
HCS tilt (deg)
AR/da
y
CME/da
y
Jan07 Jun07 Nov07 Apr08 Sep08 cycle 23
[image:3.595.75.260.63.393.2]cycle 24
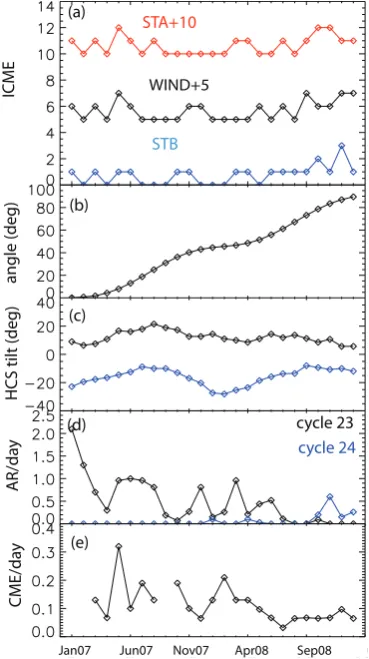
Fig. 1. Comparison of monthly ICME rate and solar activity from
January 2007 to January 2009. The panels show (a) number of ICMEs each month, (red) STA, (blue) STB, (black) Wind, (b) an-gular separation between the STEREO spacecraft, (c) the maximum northern (black) and southern (blue) extent of HCS from Wilcox Solar Observatory, (d) the average number of solar cycle 23 active regions (black) and solar cycle 24 active regions (blue) visible at the Sun per day as reported in NOAA/USAF Active Region Sum-maries, and (e) the monthly average of the STA daily CME rate for events with angular width>50◦from the CACTus catalogue.
in identifying very weak and small events (Moldwin et al., 2000), we required that the selected ICMEs must have a mag-netic field maximum above 5 nT and a duration of at least three hours. The time intervals of the identified events and some of their key characteristics are summarized in Table 1. In total we identified 43 separate ICMEs during 25 months of observations. Part of the listed ICMEs are also found from the UCLA level 3 event list at http://www-ssc.igpp. ucla.edu/forms/stereo/stereo level 3.html. Only a few events with clear multi-spacecraft encounters have been identified during the STEREO mission this far (see Table 1 and e.g., Kilpua et al., 2009).
On average the maximum magnetic field of identified ICMEs was 11.2 nT and the average radial width 0.15 AU.
These values are lower than the corresponding values of 13.9 nT and 0.27 AU reported by Jian et al. (2006) for the ICMEs during the solar cycle 23 minimum.
Only three ICMEs (events 15, 18 and 30) were embedded in the high speed solar wind (>500 km/s). The other ICMEs were divided into two populations: ICMEs compressed in the leading edges of the high speed streams (Group 1) and ICMEs surrounded by the slow solar wind (Group 2). For Group 1 ICME we required that the solar wind speed should rise above 500 km/s within 12 h after the leading edge of the ICME. Group 1 ICMEs were characterized by significantly enhanced magnetic fields (average maximum magnetic field of 13.8 nT) and short radial dimensions (average 0.09 AU) when compared to the typical radial dimensions of ICMEs. Group 2 ICMEs had clearly larger radial widths (average width 0.19 AU), but lower magnetic fields (average 8.7 nT) than ICMEs in Group 1. ICMEs in Group 2 were primar-ily identified based on the prolonged and distinct rotation of the magnetic field direction. However, the level of magnetic field fluctuations was not depressed significantly relative to the ambient solar wind.
Figure 1 shows the monthly number of ICMEs at each spacecraft, the angular separation between the STEREO spacecraft, the maximum northern (black) and southern (blue) extent of the heliospheric current sheet (HCS) from Wilcox Solar Observatory (http://wso.stanford.edu/), the av-erage number of solar cycle 23 active regions (black) and cycle 24 active regions (blue) visible at the Sun per day as reported in NOAA/USAF Active Region Summaries, and monthly average of the daily CME rate of events with an-gular width larger than 50◦ from the CACTus catalogue at
http://www.sidc.be/cactus. The CACTus catalogue is based on automated CME detection (Robbrecht and Berghmans, 2004) and thus provides an objective estimate of the CME rate. The CACTus catalogue has significantly more narrow CMEs than the LASCO CME catalogue at http://cdaw.gsfc. nasa.gov/CME list/, which is based on the visual selection. To get a better agreement with the LASCO catalogue and the automated CACTUS catalogue the identification criteria have changed in the LASCO CME catalog in the latter years to include smaller events. For CMEs with angular width greater than few tens of degrees the CME rate matches much better (Yashiro et al., 2008). The choice of angular width
>50◦is based on these concerns. The HCS tilt is calculated with the PFSS model that uses radial boundary condition at the photosphere, and requires no polar field correction.
Table 1. ICMEs identified from the solar wind measurements by STA (A), STB (B) and Wind (W). Columns give the event number (N), spacecraft that observed the ICME (S/C), start and end times of the ICME (time given at the S/C indicated first in the second column), magnetic field maximum value (Bmax), average solar wind speed (Vave), and the radial diameter (d) calculated as the product of average speed and the ICME duration. The last column indicates the group of the ICME belongs, 1: in front of the high speed stream, 2: embedded in the slow solar wind, h: high speed solar wind.
N S/C Start Stop Bmax(nT) Vave(km/s) d(AU) type
2007
1 W,A,B 1/14 11:45 1/15 07:45 15.2 345 0.16 1
2 W,A,B 3/24 05:15 3/24 12:30 12.2 364 0.06 1
3 B,W,A? 5/22 04:45 5/22 22:00 17.6 447 0.19 1
4 W,A 5/23 01:00 5/23 12:30 11.8 497 0.14 1
5 W,A,B 6/8 05:45 6/9 05:15 10.1 364 0.21 2
6 A 8/25 23:45 8/26 15:45 14.8 357 0.14 1
7 B 10/23 16:45 10/23 23:45 10.3 377 0.06 1
8 W,B 11/20 00:45 11/20 09:26 14.6 479 0.010 1
9 W 12/25 15:15 12/26 10:00 6.2 360 0.16 2
10 B,W 12/30 06:15 1/01 02:30 11.9 314 0.35 2
2008
11 B 3/6 12:15 3/6 17:00 16.5 430 0.04 1
12 W 3/8 17:45 3/9 00:45 14.0 390 0.07 1
13 A 3/21 08:05 3/21 18:45 8.5 485 0.12 2
14 A 5/11 11:00 5/12 06:00 14.5 – – –
15 W 5/22 23:00 5/23 13:00 5.9 520 0.18 h
16 B 6/6 22:00 6/7 12:15 14.9 413 0.13 2
17 A 7/4 05:30 7/6 18:15 10.1 333 0.29 2
18 B 7/10 22:45 7/11 07:30 11.9 562 0.12 h
19 W 7/25 13:25 7/25 23:30 5.9 420 0.10 2
20 B 8/15 11:30 8/16 01:00 9.4 351 0.11 1
21 W 9/3 16:30 9/4 02:30 13.5 433 0.10 1
22 A 9/4 13:15 9/5 12:15 10.1 325 0.18 2
23 W 9/17 04:00 9/18 08:00 7.2 410 0.28 2
24 B 9/28 02:30 9/28 14:00 9.3 368 0.10 1
25 W 10/08 04:45 10/08 20:15 5.5 360 0.14 2
26 A 10/14 18:45 10/15 13:45 8.3 421 0.19 2
27 B 10/17 10:00 10/17 05:45 8.0 317 0.15 2
28 B 10/19 01:30 10/20 11:40 9.5 319 0.26 2
29 A 10/31 12:00 10/31 16:30 16.2 362 0.04 1
30 W 11/01 07:30 11/01 15:30 6.1 510 0.09 h
31 A 11/07 02:00 11/08 01:15 7.1 344 0.23 2
32 B 11/16 20:45 11/17 13:30 6.2 314 0.13 2
33 A 11/28 07:45 11/28 18:25 7.8 287 0.07 1
34 A 11/28 21:45 11/29 02:00 19.8 363 0.04 1
35 W 12/04 18:15 12/05 12:00 7.3 410 0.15 2
36 B 12/08 17:00 12/08 20:30 18.2 340 0.03 1
37 B 12/16 09:30 12/17 06:15 9.3 315 0.16 2
38 W 12/17 03:30 12/17 14:30 9.8 335 0.09 2
39 B 12/31 02:00 1/01 01:35 9.5 403 0.23 2
2009
40 B 1/13 06:00 1/13 21:45 11.2 320 0.12 2
41 W 1/14 12:10 1/15 06:15 8.1 342 0.15 2
42 W 1/19 01:25 1/19 05:10 13.4 426 0.04 1
The number of ICMEs at each observing spacecraft (Fig. 1a) declined soon after the start of the STEREO sci-ence mission. During the one year period form July 2007 to June 2008 on average one ICME in every three months per spacecraft was identified, while towards the end of 2008, when the STEREO spacecraft reached the quadrature con-figuration, the ICME rate increased to 1.3 events per month. During the 19 month period from January 2007 to July 2008 20 ICMEs in total were observed, while during the last six months of the study 23 events were identified.
Figure 1 illustrates that in late 2008 some remarkable changes took place at the Sun: In September 2008 the cy-cle 24 regions outnumbered the cycy-cle 23 regions for the first time. In addition, the HCS was evolving to a flatter state as both the southern and northern latitudinal extent of the HCS was decreasing at that time. The comparison of panels (a) and (e) of Fig. 1 show an apparent divergence in the ICME and CME rates. Towards late 2008 the CME rate was slightly increasing after a decline in mid 2008, but the CME rate was still lower than in 2007 and early 2008.
There were also differences in the ICME population dur-ing the early mission phase and the quadrature phase. As seen from Table 1, in 2007 and early 2008 half of the 20 ICMEs identified during that time occurred in the lead-ing edges of high speed streams (Group 1) and only 35% were embedded in the slow solar wind (Group 2). Between September 2008–January 2009 60% of ICMEs belonged to Group 2 while the fraction of ICMEs in Group 1 had de-creased to 30%.
In the following two sections we will discuss in detail the solar and interplanetary measurements during 2–8 November 2008 when two high latitude CMEs erupted from the Sun. The first CME deflected towards the equator and produced an ICME at STA (Event 29 in Table 1). The motivation for this case study stems from the observed increase in the ICME rate in late 2008 that occurred without an apparent increase in the overall solar activity. However, during this period solar activity was concentrated primarily at high-latitudes imply-ing that CMEs deflectimply-ing from high-latitude source regions might significantly add to the near-ecliptic ICME rate.
3 2 November 2008 CMEs 3.1 Solar observations
On 2 November 2008 two CMEs erupted from the Sun. At this time STB and STA were separated by 83◦in
heliolongi-tude, thus perfectly located to make quadrature observations (Fig. 2). Both CMEs were best visible in the STB corona-graph observations leaving from the west limb of the Sun.
STB white-light observations (Howard et al., 2008) during 1–3 November 2008 are gathered in movies 1 and 2 (see sup-plementary online material: http://www.ann-geophys.net/27/ 4491/2009/angeo-27-4491-2009-supplement.zip). Movie 1
STA
STB
ACE,WIND
Y (AU)
X (
AU)
1.0 0.5 0.0 -0.5 -1.0 1.2
1.0
0.8
0.6
0.4
0.2
0.0
-0.2
FM: CME2 FM: CME1
[image:5.595.314.541.60.211.2]MVA: CME1
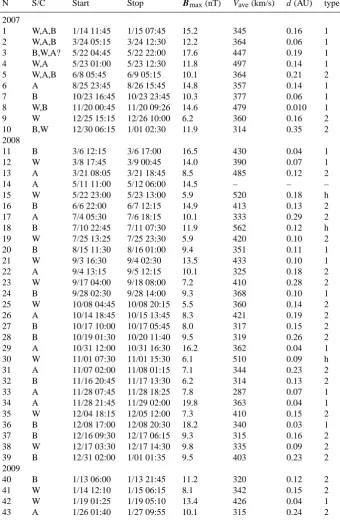
Fig. 2. STEREO/Wind/ACE positions on 2 November 2008. STA
and STB were separated by 82.5◦ in longitude. Two of the ar-rows indicate the direction of propagation for CME1 and CME2 obtained from the forward modelling (FM), and one arrow the lon-gitude angle of the flux rope axis from the minimum variance analy-sis. See Sect. 3.1 for details about the forward modelling technique and Sect. 3.2 for details about the minimum variance analysis.
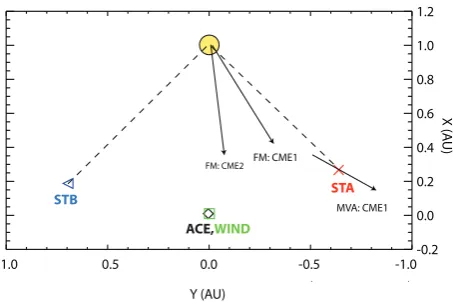
shows observations made by the inner coronagraph COR1, whose field of view extends from 1.5 to 4 solar radii (R)
(Thompson et al., 2003). The leading edge of the first CME (“CME1”) first appeared in the COR1 field of view at 01:21 UT on 2 November 2008, and the leading edge of the second CME (“CME2”) at 23:21 UT. In movie 2 we have combined the outer coronagraph (COR2), and the inner he-liospheric imager (HI-1) observations (EUV and COR1 ob-servations are also shown). COR2 is an externally occulted coronagraph with field of view between 2.5 and 15Rwhile
HI-1 is a wide-angle imager with field of view from 4 to 24 degree elongation from the Sun. Figures 3 and 4 also show a few snapshot images of the CMEs.
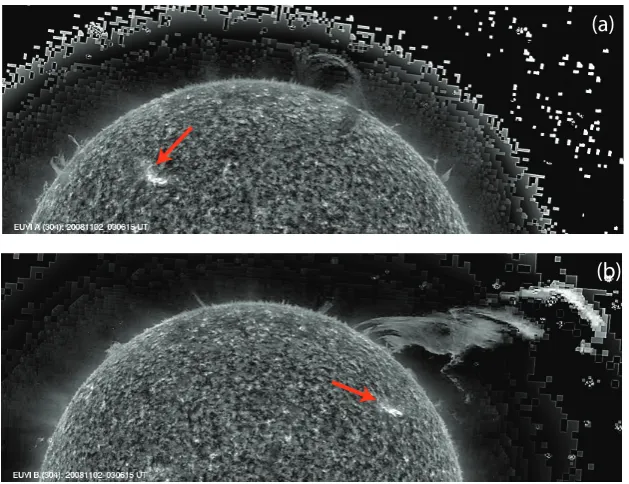
In early November 2008 a single active region, AR 11007, was visible at the solar disk (Fig. 5). The solar latitude of AR 11007 was 35◦N and its solar longitude in STA
about 30◦E, while in STB the active region was well away
from the disk center to the western direction (53◦W).
Fig-ure 6 shows the Global Oscillation Network Group (GONG) magnetogram-based PFSS model with simulated line-of-sight views from STB, Earth and STA (http://gong.nso.edu). A large extension of the northern coronal hole close to the solar equator is visible in the STA viewpoint. AR 11007 was located east of this coronal hole. NOAA reported four B class X-ray flares on 2 November 2008 from AR 11007. These flares peaked at 13:28 UT (B2.7), 14:44 UT (B1.5), 15:05 UT (B7.2) and 20:17 UT (B5.7). The last flare could be related to the eruption of CME2. No flares were reported on the previous day, 1 November 2008.
(a)
(b)
(d)
(e)
Fig. 3. Snapshot images by STB/SECCHI/COR1 of (a) CME1 on 2 November 2008 and (b) CME2 launched late 2 November 2008.
online material, movies 3 and 4: http://www.ann-geophys. net/27/4491/2009/angeo-27-4491-2009-supplement.zip). The wavelet enhanced (Stenborg et al., 2008) EUV 304
˚
[image:6.595.142.454.64.221.2]A images by STA and STB are also shown in Fig. 5. Figure 7 illustrates a sketch of the prominence and the overlying coronal fields in the STA view based on the EUV observations. The boundaries of two coronal holes visible in the right panel of Fig. 6 are also indicated. Both the timing and the location of the prominence imply that it was related to CME1. Figure 7 also shows the location of AR 11007 where CME2 originated, indicating that the source regions of CME1 and CME2 were well-separated in longitude. Unfortunately, no vector magnetogram observations by the Solar Optical Telescope (SOT) onboard the Hinode spacecraft (Kosugi et al., 2007) were available from the region surrounding the prominence and thus, we could not determine the direction of the prominence axial magnetic field. However, as the EUV observations indicate, the western leg of the prominence was anchored in the vicinity of the northern polar coronal hole. At the time of this study, the magnetic field lines in the Northern Hemisphere point inward to the Sun, and thus, it seems plausible that the axial field of the prominence was directed from east to west as indicated in Fig. 7.
The EUV images show that the prominence unfolds from its southern flank as it erupts. The northern flank does not expand northwards but remains stationary along the coronal hole boundary (Fig. 5b). The white light CME (movie 2) is following the same behavior as seen in the COR1 images (Fig. 3a and movie 1). CME1 has a clear southward asymme-try. This erupting behavior strongly suggests that the coronal hole is influencing the eruption and trajectory of CME1 con-straining it towards the solar equator. Also, CME1 is visible as a faint halo in A, but as a three-part CME in COR2-B. This suggests that CME1 is heading towards STA.
In contrast, the white light observations (movies 1 and 2) of CME2 show a bubble-like CME erupting more or less
ra-dially from AR11007 in a north-western direction. CME2 has similar morphology and appears in opposite limbs of the COR2-A and COR2-B coronagraphs which immediately demonstrates that CME2 propagates somewhere along the Sun-Earth line.
We also estimated the 3-D properties of the CMEs using the forward modelling method described in Thernisien et al. (2009). Using a geometric model flux rope and stereoscopic observations the technique gives estimates of the CME 3-dimensional direction and spatial extent. The spatial width is described by the aspect ratio (Chen et al., 1997), which is the ratio of the width between the upper and lower CME envelopes and the height of the CME centroid. The signa-ture of CME1 in STA/COR2 is very weak and thus, the pa-rameters obtained for CME1 should be treated with caution. The aspect ratios were 0.35 and 0.22 for CME1 and CME2, respectively, indicating that CME1 was wider than CME2. The results of the modelling, consistent with the white-light observations, suggest that CME1 (latitude+7◦) propagated
south of CME2 (latitude+18◦).
The obtained longitude angles with respect to the Sun-Earth lines were+32◦ and+7◦ for CME1 and CME2
re-spectively, and they are indicated in Fig. 2 by arrows. The longitudinal difference between the modelled CME propaga-tion direcpropaga-tions was 25◦, consistent with the imaging obser-vations, and imply that CME2 had a much larger component toward STB than CME1. Using the directions of the CMEs one can deproject their speeds. We obtained 289 km/s for CME1 and 438 km/s for CME2.
3.2 In-situ observations
(a)
(b)
(a)
[image:7.595.99.497.63.359.2](b)
Fig. 4. Snapshot images by STB/SECCHI COR2 and HI-1 instruments featuring (a) CME1 in COR2 on 3 November 2008 05:38:19 UT and
(a)
[image:8.595.141.456.61.303.2](b)
Fig. 5. Wavelet enhanced extreme ultraviolet images at 304 ˚A on 2 November 2008 at 03:06:15 UT by (a) STA/SECCHI/EUVI and by
(b) STB/SECCHI/EUVI. The AR 11007 that produced four B-class flares and CME2 is indicated by a red arrow.
STEREO-B
Earth
STEREO-A
Fig. 6. Potential-field source-surface models of simulated line-of-sight views from (left) STB, (middle) Earth, and (right) STA from Global
Oscillation Network Group (GONG). Closed streamer belt field lines are shown blue. Positive and negative coronal hole open field regions are indicated by green and red, respectively.
signatures from Wind and STB data, but found no evidence of ICME related material in a suitable time window. The magnetic field magnitude during this ICME was less than 7 nT, only slightly enhanced with respect to the ambient so-lar wind value. The event was clearly identifiable from the ambient solar wind due to a prolonged and clear magnetic field rotation. In addition, the level of magnetic field fluctua-tion within the ICME was depressed with respect to the am-bient solar wind. A declining speed profile and a magnetic field magnitude that peaks towards the leading edge shows that the ICME was expanding. The speed of the expansion is defined as a half of the difference between the speeds at the leading and trailing edges of the ICME. For the studied ICME, the measured speeds were 367 km/s and 338 km/s at the leading and trailing edges, yielding an expansion speed
of 14.5 km/s. The average speed of the ICME was 344 km/s, giving an estimated ICME radial width of 0.23 AU.
[image:8.595.90.508.366.466.2]Fig. 7. Sketch of the prominence and the overlying coronal fields
from the STA viewpoint based on the PFFS model in Fig. 6 and the wavelet enhanced EUV images (Fig. 7). The black and blue thick curves denote the prominence axial field and the red curves the open magnetic field lines to the northern coronal hole. The red thin curves outline the boundaries of the large polar coronal holes and the dashed curve shows the upper edge of the streamer belt. The dark red area to the left shows the location of AR 11007.
interplanetary propagation. This is consistent with Gopal-swamy et al. (2001) who found that slow CMEs accelerate and fast CMEs decelerate approximately to the speed of the ambient solar wind. As shown by Fig. 8d the ICME was sandwiched in the toward magnetic sector, i.e. magnetic field lines were directed toward the Sun, consistent with Fig. 6 where in STA view a large northern polar coronal hole is seen to extend close to the solar equator.
We applied the minimum variance analysis (MVA) (Son-nerup and Cahill, 1967) to estimate the orientation of the ICME. MVA can estimate quite well the orientation of the magnetic cloud when the observing spacecraft traverses the flux rope close to the center, but if the distance between the axis and spacecraft trajectory is large the results can be questionable (Gulisano et al., 2007). The obtained longitude and latitude of the flux rope axis in RTN wereφFR= +19◦
andθFR= +1◦, respectively, implying that the flux rope was
lying in the ecliptic plane, and its axis was rather closely aligned with the Sun-STA line. The ratio between the inter-mediate and minimum eigenvalues was 4.2, fulfilling the cri-teria>2 by Burlaga and Behannon (1982) for a well-defined MVA direction.
It should be noted that the CME direction angles were determined based on the COR2 observations, while the MVA orientation represent the interplanetary value at about 0.97 AU. The difference between the longitude angle of CME1 obtained by the forward modelling (∼10◦east of the Sun-STA line) and longitude of the flux rope axis obtained by the MVA (19◦ west from the Sun-STA line) are like due to
Bmag (nT)
Brtn (nT)
Bn
theta (deg)
phi (deg)
Vp (km/s)
beta
date (UT) Br Bt
(a)
(b)
(c)
(d)
(e)
(f )
(g) Tp (K)
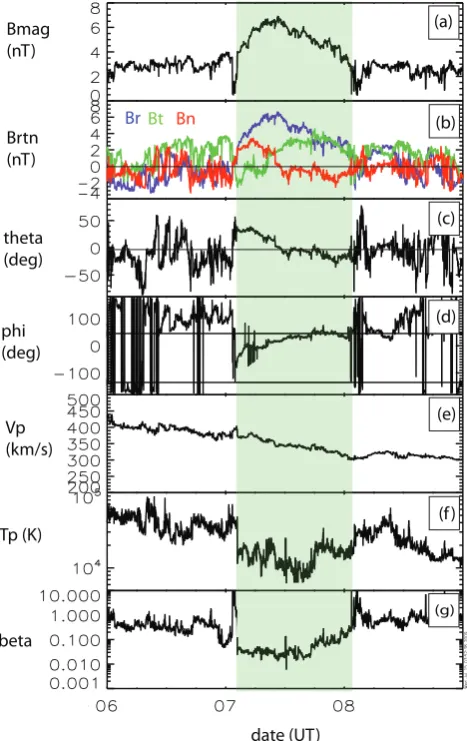
Fig. 8. STA in-situ observations on 6–9 November 2008. The
green-hatched area shows the ICME interval. The panels show:
(a) magnetic field magnitude, (b) RTN components of the
mag-netic field, (c) magmag-netic field latitude, and (d) longitude in RTN,
(e) solar wind speed, (f) proton temperature and (g) plasma beta.
Two horizontal lines (φ=45◦andφ= −135◦) in panel (d) indicate the division to away (φwithin−135◦−45◦) and toward magnetic sectors.
CME1 deflecting west during its interplanetary propagation (see discussion below).
The MVA result that the flux rope axis was somewhat west from the Sun-STA line is consistent with the behaviour of the magnetic field components (Fig. 8): both tangential (BT)
and radial (BR) magnetic field components are positive at the
center of the flux rope and the radial component shows the maximum variance as theBRcomponent rotates from zero
at the leading edge to a maximum value of 6.8 nT and back to zero at the trailing edge.
[image:9.595.67.272.68.236.2]STA
Earth
T
[image:10.595.50.281.62.266.2]R
Fig. 9. A possible configuration of the flux rope ICME encountered
by STA on 7–8 November 2008. Green arrows show the direction of the axial magnetic field.
into consideration that the prominence eruption associated with CME1 was located in the Western Hemisphere and that slow CMEs have a tendency to deflect west (Wang et al., 2004) it seems likely that STA traversed through the east-ern leg of the CME as indicated in Fig. 9. The behaviour of the magnetic field components are consistent with the sce-nario shown in the sketch if one assumes that the flux rope axis was crossed from below and that the prominence field was east-west directed as discussed in Sect. 3.1 (Fig. 9).
CME2 was somewhat faster than CME1 and using its COR2 speed 438 km/s the estimated arrival time at 1 AU would be early on 7 November 2008. In the STA obser-vations we found signatures of only one ICME that as de-duced above, was prode-duced by CME1. Since CME2 prop-agated closer to the Sun-Earth line than the Sun-STA line, we searched signatures of CME2 from Wind measurements. However, no indication of the ICME related material was identified at Wind. As suggested by the remote observations the bulk of CME2 seems to have propagated above the eclip-tic and thus no clear ICME signatures at the near-eclipeclip-tic solar wind are expected. In addition, even if there would have been an imprint of CME2 in near ecliptic solar wind, due to the large longitudinal separation between Wind and STA (40◦) the ICME could have travelled between these two spacecraft.
4 Discussion
As discussed in Sect. 2 the ICME rate at each spacecraft in consideration increased in late 2008, the average rate at this time being two ICMEs per month. The observed rate is
higher than one ICME in every three months as reported by Cane and Richardson (2003) for 1996, the minimum year of cycle 23. The same number of events is also reported in the Wind magnetic cloud list at http://lepmfi.gsfc.nasa.gov/mfi/ mag cloud pub1.html.
Care needs to be taken in comparing our study with the above mentioned studies due to the different selection crite-ria used. We used organized magnetic field behaviour and de-creased level of magnetic field fluctuations as the main crite-ria to identify ICMEs. On the contrary the Cane and Richard-son (2003) survey used the depressed proton temperature as the initial search criterion. Although all selected events in our study were easily discerned from the ambient solar wind data our study includes weaker (i.e. low magnetic field) and smaller ICMEs than are typically reported in the ICME lists. In addition, it should be noted that the comparison be-tween the present and the previous solar minima is not straightforward due to exceptionally long and deep declin-ing phase of cycle 23. The average sunspot number (http: //sidc.oma.be/) was 7.5 and 2.9 in 2007 and 2008, respec-tively. These values are lower than the sunspot number in 1996 when the yearly average was 8.6. Although sunspot numbers were in typical solar minimum values both in 2007 and 2008, it seems that the solar minimum was not yet reached by the end of 2008. For instance, during the con-sidered period of time, the tilt angle of the HCS was not yet as low as is typically observed at solar minimum periods.
Riley et al. (2006) found that the CME and ICME rates tracked each other well at the solar cycle 23 minimum, but di-verged during the ascending phase of the solar cycle. Signif-icantly more CMEs were detected in the remote observations than their interplanetary counterparts in the near-Earth solar wind. The divergence coincided with the appearance of mid-latitude active regions and polar crown filaments. Our study demonstrates an increase in the near-ecliptic ICME rate from August 2008 to January 2008 without an associated increase in the solar activity and number of CMEs. During this time, the main solar activity took place at high latitudes, where new cycle active regions appeared. In contrast to the ascend-ing activity phase when the polar field strength weakens, at solar minimum strong polar field can guide a significant frac-tion of high latitude CMEs to low latitudes. This suggests that CMEs deflecting from high-latitude cycle 24 active re-gions and polar crown filament eruptions could account for the observed increase in the ICME rate.
Another factor that might contribute to the increased ICME rate in the ecliptic plane is the decreased tilt of the HCS. During solar minimum a large fraction of ICMEs are slow streamer blow-out events (e.g., Bravo et al., 1998). However, as discussed above the tilt angle of the HCS was not yet particularly small in late 2008.
obvious solar surface signatures and a CME eruption can also occur without a clear disk signature (e.g., Robbrecht et al. 2009). We leave the detailed analysis of the source regions of the listed ICMEs for future work.
An example event linking a high-latitude CME eruption to a flux rope ICME at STA was studied in detail in Sect. 3. On the same day another CME was also launched, originating from slightly lower latitude than CME1. The source regions of the two CMEs were also separated by several tens of de-grees in longitude. CME1 was associated with an impressive eruption of a huge polar crown filament while CME2 orig-inated from an active region and was related to a weak B-class flare. Taking advantage of STEREO quadrature obser-vations a reliable association could be made with CME1 and an ICME at STA. CME1 quickly deflected from the north-ern latitude of about 50◦almost to the equator while CME2
continued close to its original trajectory. It should be noted that with only STA observations available it would have been difficult to make the correct association between the ICME at STA and CME1; only a very weak halo signature of CME1 could be detected in STA, but CME2 was clearly visible in STA COR2.
In general the remote sensing and in-situ observations as well as the results from the forward modelling technique were in good agreement. All the methods suggest that CME2 propagated north of CME1 and that CME2 travelled several tens of degrees east of CME1, close to the Sun-Earth line. In addition, the forward modelling technique yielded larger size for CME1 than for CME2, also in agreement with solar observations; CME1 was associated with a huge prominence eruption, while CME2 originated from an active region. No signatures of CME2 could be detected in the near-ecliptic in-terplanetary medium. It is possible that the bulk of CME2 travelled north of the ecliptic and in between STA and Wind, thus not able to produce clear signatures at either spacecraft. The studied CME events illustrate that the spatial dimen-sions of the erupting CME might play an important role in determining whether a CME will be deflected towards the equator. Presumably due to its wide longitudinal extent and slow speed CME1 could not penetrate through the overlying open coronal fields, but was channelled towards the equator by magnetic fields in the polar coronal holes. On the contrary the narrower and faster CME2 propagated radially from the active region along the overlying streamer in the northward direction. The studied events will provide an excellent base for modelling purposes and we intend to perform MHD mod-elling of flux ropes with different sizes and orientations to study the critical parameters of the CME deflection as an ex-tension of work done by Filippov et al. (2001).
5 Conclusions
We have studied the ICME rate during the solar minimum pe-riod from January 2007 through January 2009 as well as the
propagation and interplanetary consequences of two high lat-itude CMEs that erupted from the Sun on 2 November, 2008 taking advantage of the STEREO quadrature observations. A clear ICME was observed at STA embedded in the slow so-lar wind on 7–8 November 2008. The ICME was associated with the first CME of 2 November that was quickly guided towards the equator by the magnetic fields of the polar coro-nal hole while the second CME continued its propagation above the ecliptic plane and hence was not identified in near-ecliptic in-situ observations. The 3-D propagation directions and sizes were estimated for both CMEs using the forward modelling technique. In general, the obtained results were in good agreement with solar and in-situ observations. The analysis of the two CMEs suggests that large and slow CME eruptions are more likely to be deflected towards the equator than smaller CMEs.
Our statistics from multiple well-separated spacecraft show that even at the quietest solar cycle phase, the Sun can produce a substantial number of ICMEs in the ecliptic plane. The results show that the increased ICME rate does not nec-essarily reflect the increase in the overall solar activity. The ICME rate near the ecliptic plane can also increase due to the flattened heliospheric current sheet or due to deflection of high-latitude CMEs. At the time when the ICME rate in-creased the solar activity was concentrated at high latitudes, but the tilt of the streamer belt was still relatively high. This suggests that the deflection of high-latitude CMEs is the main contributor to the increased near-ecliptic ICME rate observed in this study. The large number of ICMEs identified at the quadrature phase provides a good selection of events for fu-ture studies.
Acknowledgements. The sunspot dates were archived through
SIDC-team, World Data Center for the Sunspot Index, Royal Obser-vatory of Belgium. This work utilizes data obtained by the Global Oscillation Network Group (GONG) Program, managed by the Na-tional Solar Observatory, which is operated by AURA, Inc. un-der a cooperative agreement with the National Science Foundation. We thank R. Lepping for the WIND Magnetic Field Investigation data, R. P. Lin for the WIND 3-D-plasma data and K. W. Ogilvie for the WIND SWE data. Support for the STEREO mission in-situ data processing and analysis was provided through NASA contracts to the IMPACT, PLASTIC and SECCHI teams (the IM-PACT contract to University of California Berkeley NAS5-03131, the PLASTIC contract to University of New Hampshire NAS5-00132, and the SECCHI contract to Naval Research Laboratory DPRS-13631-Y). STEREO magnetic field and plasma data were achieved through UCLA Space Physics Center. Academy of Fin-land (projects 121650, 124837, 130298) and V¨ais¨al¨a Foundation are thanked for financial support.
References
Bravo, S., Blanco Cano, X., and Nikiforova, E.: Different types of coronal mass ejections at minimum and maximum of solar ac-tivity and their relation to magnetic field evolution, Solar Phys., 180, 461–471, 1998.
Burlaga, L., Sittler, E., Mariani, F., and Schwenn, R.: Magnetic loop behind an interplanetary shock Voyager, Helios, and IMP 8 observations, J. Geophys. Res., 86, 6673–6684, 1981.
Burlaga, L. F. and Behannon, K. W.: Magnetic clouds: Voyager ob-servations between 2 and 4 AU, Solar Phys., 81, 182–192, 1982. Cane, H. V. and Richardson, I. G.: Interplanetary coronal mass ejec-tions in the near-Earth solar wind during 1996–2002, J. Geophys. Res., 108, A4, doi:10.1029/2002JA009817, 2003.
Chen, J., Howard, R. A., Brueckner, G. E., Santoro, R., Krall, J., Paswaters, S. E., St. Cyr, O. C., Schwenn, R., Lamy, P., and Simnett, G. M.: 1997, Evidence of an Erupting Magnetic Flux Rope: LASCO Coronal Mass Ejection of 1997 April 13, ApJ Lett., 490, 191, doi:10.1086/311029, 1997.
Cremades, H., Bothmer, V., and Tripathi, D.: Properties of struc-tured coronal mass ejections in solar cycle 23, Adv. Space Res., 38, 461–465, doi:10.1016/j.asr.2005.01.095, 2005.
Filippov, B. P., Gopalswamy, N., and Lozhechkin, A. V.: Non-radial motion of eruptive filament, Solar Phys., 203, 119–130, 2001. Gopalswamy, N., Lara, A., Yashiro, S., Kaiser, M. L., and Howard,
R. A.: Predicting the 1-AU arrival times of coronal mass ejec-tions, J. Geophys. Res., 106, 29207–29217, 2001.
Gosling, J. T.: Coronal mass ejections and magnetic flux ropes in interplanetary space, in: Physics of Magnetic Flux Ropes, Geo-phys. Monogr., 58, edited by: Priest, E. R., Lee, L. C., and Rus-sell, C. T., 343–364, 1990.
Gosling, J. T.: in Coronal Mass Ejections, Geophys. Monogr., 99, edited by: Crooker, N., Joselyn, J. A., and Feynman, J., AGU, 245, 1997.
Gosling, J. T., McComas, D. J., Phillips, J. L., and Bame, S. J.: Geo-magnetic activity associated with earth passage of interplanetary shock disturbances and coronal mass ejections, J. Geophys. Res., 96, 7831–7839, 1991.
Gulisano, A. M., Dasso, S., Mandrini, C. H., and, Demoulin, P.: Es-timation of the bias of the minimum variance technique in the de-termination of magnetic clouds global quantities and orientation, Adv. Space Res., 40, 1881–1890, doi:10.1016/j.asr.2007.09.001, 2007.
Howard, R. A., Moses, J. D., Vourlidas, A., Newmark, J. S., Socker, D. G., Plunkett, S. P., Korendyke, C. M., Cook, J. W., Hurley, A., Davila, J. M., Thompson, W. T., St Cyr, O. C., Mentzell, E., Mehalick, K., Lemen, J. R., Wuelser, J. P., Duncan, D. W., Tarbell, T. D., Wolfson, C. J., Moore, A., Harrison, R. A., Waltham, N. R., Lang, J., Davis, C. J., Eyles, C. J., Mapson-Menard, H., Simnett, G. M., Halain, J. P., Dese, J. M., Mazy, E., Rochus, P., Mercier, R., Ravet, M. F., Delmotte, F., Auchere, F., Delaboudiniere, J. P., Bothmer, V., Deutsch, W., Wang, D., Rich, N., Cooper, S., Stephens, V., Maahs, G., Baugh, R., Mc-Mullin, D., and Carter, T.: Sun Earth Connection Coronal and Heliospheric Investigation (SECCHI), Space Sci. Rev., 136, 115, doi:10.1007/s11214-008-9341-4, 2008.
Huttunen, K. E. J, Koskinen, H. E. J., and Schwenn,
R.: Variability of magnetospheric storms driven by differ-ent solar wind perturbations, J. Geophys. Res., 107, A47, doi:10.1029/2001JA900171, 2002.
Jian, L., Russell, C. T., Luhmann, J. G., and Skoug, R. M.: Prop-erties of interplanetary coronal mass ejections at one AU during 1995–2004, Solar Phys., 239, 393–436, 2006.
Kaiser, M., Kucera, T. A., Davila, J. M., St. Cyr, O. C., Guhathakurta, M., and Christian, E.: The STEREO mission: an introduction, Space Sci. Rev., 136, 1–4, doi:10.1007/s11214-007-9277-0, 2007.
Kilpua, E. K. J., Liewer, P. C., Farrugia, C., Luhmann, J. G., M¨ostl, C., Li, Y., Liu, Y., Lynch, B. J., Russell, C. T., Vourlidas, A., Acuna, M. H., Galvin, A. B., Larson, D., and Sauvaud, J. A.: Multispacecraft observations of magnetic clouds and their solar origins between 19 and 23 May 2007, Solar Phys., 254, 325–344, 2009.
Kosugi, T., Matsuzaki, K., Sakao, T., Shimizu, T., Sone, Y., Tachikawa, S., Hashimoto, T., Minesugi, K., Ohnishi, A., Ya-mada, T., Tsuneta, S., Hara, H., Ichimoto, K., Suematsu, Y., Shimojo, M., Watanabe, T., Shimada, S., Davis, J. M., Hill, L. D., Owens, J. K., Title, A. M., Culhane, J. L., Harra, L. K., Doschek, G. A., and Golub, L.: The Hinode (Solar-B) Mission: An overview, Solar Phys., 243, 3–17, 2007.
Moldwin, M. B., Ford, S., Lepping, R., Slavin, J., and Szabo, A.: Small-scale magnetic flux ropes in the solar wind, Geophys. Res. Lett., 27, 57–60, 2000.
Neugebauer, M. and Goldstein, R.: Particle and field signatures of coronal mass ejections in the solar wind, in: Coronal Mass Ejec-tions, Geophys. Monogr. 99, edited by: Crooker, N., Joselyn, J. A., Feynman, J., AGU, 245, 1997.
Owens, M. J., Schwadron, N. A., Crooker, N. U., Hughes, W. J., and Spence, H. E.: Role of coronal mass ejections in the heliospheric Hale cycle, Geophys. Res. Lett., 34, L06104, doi:10.1029/2006GL028795, 2007.
Patsourakos, S. and Vourlidas, A.: Extreme Ultraviolet Waves are Waves: First Quadrature Observations of an Extreme Ultraviolet Wave from STEREO, Astrophys. J., 700, L182, doi:10.1088/0004-637X/700/2/L182, 2009.
Plunkett, S. P., Thompson, B. J., St. Cyr, O. C., and Howard, R. A.: Solar source regions of coronal mass ejections and their geomag-netic effects, J. Geophys. Res., 63, 389–402, doi:10.1016/S1364-6826(00)00166-8, 2001.
Reames, D. V.: Particle acceleration at the Sun and in the helio-sphere, Space Sci. Rev., 90, 413–491, 1999.
Richardson, I. G. and Cane, H. V.: Regions of abnormally low pro-ton temperature in the solar wind (1965–1991) and their asso-ciation with ejecta, J. Geophys. Res., 100(A12), 23397–23412, 1995.
Richardson, I. G. and Cane, H. V.: The fraction of interplane-tary coronal mass ejections that are magnetic clouds: Evidence for a solar cycle variation, Geophys. Res. Lett., 31, L18804, doi:10.1029/2004GL020958, 2004.
Riley, P., Schatzman, C., Cane, H. V., Richardson, I. G., and Gopal-swamy, N.: On the Rates of Coronal Mass Ejections: Remote So-lar and In Situ Observations, Astrophys. J., 647, 648–653, 2006. Robbrecht, E. and Berghmans, D.: Automated recognition of coro-nal mass ejections (CMEs) in near-real-time data, Astron. Astro-phys., 425, 1098–1106, 2004.
and altitude from Explorer 12 observations, J. Geophys. Res., 72, 171–183, 1967.
Steinberg, J. T., Gosling, J. T., Skoug, R. M., and Wiens, R. C.: Suprathermal electrons in high-speed streams from coronal holes: Counterstreaming on open field lines at 1 AU, J. Geophys. Res., 110, A06103, doi:10.1029/2005JA011027, 2005
Stenborg, G., Vourlidas, A., and Howard, R. A.: Fresh view of the extreme-ultraviolet corona from the application of a new image-processing technique, Astrophys. J., 674, 2101–1206, 2008. Thernisien, A., Vourlidas, A., and Howard, A.: Forward modeling
of coronal mass ejections using STEREO-SECCHI data, Solar Phys., 256, 130, 2009.
Thompson, W. T., Davila, J. M., Fisher, R. R., Orwig, L. E., Mentzell, J. E., Hetherington, S. E., Derro, R. J., Federline, R. E., Clark, D. C., Chen, P. T. C., Tveekrem, J. L., Martino, A. J., Novello, J., Wesenberg, R. P., St Cyr, O. C., Reginald, N. L., Howard, R. A., Mehalick, K. I., Hersh, M. J., Newman, M. D., Thomas, D. L., Card, G. L., and Elmore, D. F.: COR1 inner coronagraph for STEREO-SECCHI, SPIE, 4853, 2003. Tsurutani, B. T., Smith, E. J., Gonzalez, W. D., Tang, F., and
Aka-sofu, S. I.: Origin of interplanetary southward magnetic fields re-sponsible for major magnetic storms near solar maximum (1978– 1979), J. Geophys. Res., 93, 8519, 1988.
Wang, Y., Chenglong, S., Wang, S., and Pinzhong, Y.: Deflection of coronal mass ejection in the interplanetary medium, Solar Phys., 222, 329–343, 2004.
Webb, D. F., Cliver, E. W., Crooker, N. U., Cry, O. C. St., and Thompson, B. J.: Relationship of halo coronal mass ejections, magnetic clouds, and magnetic storms, J. Geophys. Res., 105, 7491–7508, doi:10.1029/1999JA000275, 2000.
Yashiro, S., Michalek, G., and Gopalswamy, N.: A comparison of coronal mass ejections identified by manual and automatic meth-ods, Ann. Geophys., 26, 3103–3112, 2008,
http://www.ann-geophys.net/26/3103/2008/.
Zhang, J., Richardson, I. G., Webb, D. F., Gopalswamy, N., Hut-tunen, E., Kasper, J. C., Nitta, N. V., Poomvises, W., Thomp-son, B. J., Wu, C.-C., Yashiro, S., and Zhukov, A. N.: So-lar and interplanetary sources of major geomagnetic storms (Dst<−100 nT) during 1996–2005, J. Geophys. Res., 112, A10, doi:10.1029/2997JA012321, 2007.
Zhou, G., Wang, Y., and Jingxiu, W.: Coronal mass ejections asso-ciated with polar crown filaments, Adv. Space Res., 38, 466–469, dioi:10.1016/j.asr.2005.03.110, 2006.