DOI: 10.14738/abr.512.3165.
Ongeri, J. M., & Ongeri, B. O. (2017). Export Promotion Schemes and Export Performance in the East African Community: A Comparative Analysis. Archives of Business Research, 5(12), 245-260.
Export Promotion Schemes and Export Performance in the East
African Community: A Comparative Analysis
Jutine Mogendi Ongeri University of Dar Es Salaam Box 35091. Dar Es Salaam, Tanzania
Benedicto Onkoba Ongeri School of Economics, University of Nairobi, Kenya
ABSTRACT
This study analyzed the impact of various fiscal incentives (export promotion schemes) in the East African Community on promoting exports in the region. The schemes in place are; the manufacturing under bond scheme, export processing zones and duty remission facility for Kenya; Duty draw back scheme, excise duty relief, export processing zones and VAT exemption scheme for Tanzania; for Uganda it has duty drawback, manufacturing under bond and foreign exchange liberalization schemes. These schemes are stated in the East African Community customs union protocol, 2005. Effectively, this study was to investigate the actual impact of these schemes for each country and carry out a comparison on which ones have performed better than which ones (if actually there is any performance). Using an augmented gravity model, results showed that duty drawback scheme was the most significant export promotion scheme in promoting export volumes in EAC partner states. The results showed that duty drawback scheme boosted the volumes of exports in both Uganda and Tanzania. In Kenya duty remission facility and export processing zones were the most effective export promotion schemes in promoting the volumes of exports. Export processing zones though effective for Kenya, the results showed opposite impact for Tanzania. Manufacturing under bond scheme, though being in existent in Kenya and Uganda for a very long time, was not effective in promoting volumes of exports in both countries according to the study results. Also, Value added tax remission and excise duty relief schemes are not effective in promoting the volumes of exports in Uganda and Tanzania respectively.
Key words: Manufacturing under bond, export processing zone and duty remission facility
INTRODUCTION
This study examines and compares the different approaches used by the East African community (EAC) member states to promote exports in the region. The study is motivated by the fact that the EAC countries have established various Export promotion schemes (EPS)1, but
their volumes of exports and manufacturing sector growth rates are still lagging behind. The study tries to bring out an in depth understanding of the EPS used in the EAC partner states, and how they are performing in terms of promoting exports of the manufacturing sector and economic performance.
The study covered the initial co-founders of the EAC, i.e Tanzania, Uganda and Kenya 2 for the
periods 1980 to 2013. This is because their respective export schemes have been in existences
1 The schemes are set out in part F, article 25, 26, 27,28,29 and 30 of the EAC customs union protocol
2 Kenya, Uganda and Tanzania signed a treaty on 30th November 1999, of forming the EAC, later in July 2007 is
URL: http://dx.doi.org/10.14738/abr.512.3165. 246
for a longer period as compared to Burundi and Rwanda, and as such providing a good base for a study of their performances3. The period under study captures both the periods when the
schemes were not established and when they were formed, so as to study clearly the changes brought about.
Article 25, part F of the EAC customs union protocol indicates that the member countries came into an agreement of supporting export promotion schemes in order to accelerate export related investments in the region(EACCU, 1999)1. For the region agreeing to have EPS it means
that 100% of the products manufactured under any EPS are expected to be sold outside the EAC region but in case they are sold in EAC region then only 20% of annual production will be allowed, provided that full duties, levies and other charges are paid.4Currently the export
promotion schemes (EPS) in each member states are still different. They have not established all the schemes as stated in the protocol, but each has taken into various schemes. In Kenya, they have in place a Duty Remission facility; Manufacture under Bond; and an Export Processing Zone (EPZ) program5. Tanzania has a Duty Draw-Back scheme; Excise duty relief;
VAT exemption on exports and an EPZ7. In Uganda the VAT exemption on exports; foreign
exchange liberalization that entitles exporters to retain 100 percent of their foreign exchange earnings; duty draw back; and manufacturing under bond are used as the main export promotion schemes7
Though all these schemes were set in different circumstances of each country, their main common purpose is captured by the EAC protocol, of increasing the level of exports.
All the member states agreed to support the following as their export promotion schemes6:
Duty Drawback schemes
The scheme pertains refunding of the excise paid for an input that has been used in the manufacture of a good for export. The member states agreed that, upon exportation to a foreign country, drawback of import duties may be allowed in such amounts and on such conditions as may be prescribed by the competent authority7. The duty draw back scheme is a
special type of subsidy that governments give to exporters (UNCTAD & WTO, 2012). According to WTO rules on duty draw backs the scheme can be used if the amount of duty reimbursed does not exceed the amount of duties paid, and verification has to be made that the duties have actually been paid on imports. It came into place for Uganda in 1995 and offers a duty refund to goods/inputs that have been used in the manufacture of the final goods for exports. The refunded amount is calculated as a percentage of value it has added on exports. The scheme though coming into place in 1995; it was effectively implemented from 2000 after the enactment of the finance Act in 1999. In Tanzania the scheme is managed by the Tanzania
3 Burundi and Rwanda’s export promotion schemes are not well documented to facilitate an analysis, but the
results from can as well be proposed for the two nations, given they signed an agreement of the EAC protocol to support the same EPS in the region.
4 The rule of goods enjoying EPS having to be of exports only; is stated in Part F, Article 25, section 2, sub-section b
of the EAC customs union protocol 2005.
5 There are more schemes in Kenya, amongst them the export promotion council, but this study only limits itself to
the EPS stated in the EAC customs union protocol (the ones that all the partner states agreed to support). Tanzania and Uganda also have export promotion councils to oversee promotion of exports in their countries
6 Special economic zones is a facility that is supported by the EAC partners to promote trade in the region, but
categorically it is not in the list of export promotion schemes.
7 Duty draw-back rule is stated in part F, section 138 sub-section 2b (i) and 3(a) of the East African community
Copyright © Society for Science and Education, United Kingdom 247
Revenue Authority (TRA)8. Under this scheme in Tanzania, exporters receive a relief of duties
on their inputs for as long as the inputs are used in the manufacture of those particular goods for exports. The inputs can be raw materials or other components of the manufactured goods that are exported, the relief is also on materials that are used in packing of those manufactured goods.
Duty and value added tax remission
This scheme advocates for wavering of duties. Part X, sections138-140 of EAC Customs Management Act (EAC, 2004) provides for duty remission for industrial inputs imported for manufacture goods. In the EAC context it is carried out through EAC Customs Management (Duty Remission) Regulations which became effective from 1st May 2008. The Regulations provide for administration of imported industrial inputs for manufacture of goods for both export and home use. In Kenya duty remission facility was introduced in 1990 that gave incentives to manufactures of goods for exports. The program later became fully operational in 1993. The program provided for VAT exemption from those inputs that were used in the manufacturing of a good for export.
Manufacturing under bond schemes
The scheme gives manufacturers a freedom of importing raw materials of outputs, plant and machinery without paying taxes, but restrict that the goods have to be for exports only (Glenday & Ndii, July, 2000). These schemes generally require the manufacturers to carry out their activities in a bonded warehouse or factory which ought to be licensed by a customs authority of a given country (EAC, 2005)9.One main disadvantage of an MUB is the
administrative cost of administering it, though this is a challenge, an advantage of it is for businesses which assemble goods that import dutiable inputs which have high imported dutiable inputs. In Kenya It exempts from Duty and VAT for those exporters who import machinery and raw material in manufacturing goods for export. The scheme came in to place in Uganda as from 2001. The scheme allowed manufactures to import raw materials and intermediate goods at zero rates, for as long as they were used to manufacture goods for exports. A manufacturer in Uganda is required to establish security in the form of a bond for availing himself of this facility. Approved manufacturers are required to construct a bonded warehouse at their manufacturing site (subject to prior customs approval). As a requirement, the government has ensured that there is a customs officer on the ground to monitor the goods that are imported.
Export processing zones
They are usually designated areas where interested people are allowed to import machinery and resources (inputs) tax free where they are required to use to produce goods that are only for exports. The taxes can be domestic taxes such as income tax and company tax; they also have other exemptions like from labor regulations and foreign exchange regulations. Kenya’s EPZs are administered by the Export Processing Zones Authority (EPZA). The zones are known to be special purpose corporations that are required to carry out business only in a designated location. The location can be an industrial EPZ park or a single factory which in both or either case are supervised by an EPZ authority, which is also mandated to license them. They were established in the EPZ Act, 1990. Among some special packages that were advocated by EPZs
8 The duty drawback is conferred upon by Part III, Section 17 (1-8) of Tanzania Investment Act, 1997.
9 The provisions governing manufacturing under bond scheme are in the EAC customs management ACT part XIII,
URL: http://dx.doi.org/10.14738/abr.512.3165. 248
were; corporate tax exemption for 10 years since the start of the business and a rate not exceeding 25% for the rest of the years.
VAT exemptions on exports
The scheme was proposed by the Investment Code Act in 1991 (Uganda, 1991), the scheme provided an exemption regime of tax; this tax incentive was transplanted in the laws of Uganda (CAP 349 of laws of Uganda).
The scheme allowed a reimbursement of VAT that was levied the rate of 17% on imported goods. According to the authorities; the value added tax is reimbursed to exporters within a month of lodging in the required documents.
Excise duty relief in Tanzania
The scheme allows for exemption of payment of any tax for goods that are exported. It provides for non-charging of export products, but charges the raw materials that are used in the manufacture of these products. Exemptions on raw materials are managed by the duty draw back scheme.
Manufacturing export performance in the EAC partner states to African states
EAC manufactured goods have relatively remained stagnant, since the early 80s, but there was a trigger of the performance of exports in the 1990s. Particularly in Kenya, there was a sharp improvement in the performance of exports in 1990, and 1992, these conformed to the periods when most export promotion schemes were brought into place10. The same upward trigger
was seen for Uganda and Tanzania in the years 1997 -1998, when most EPS were coming into place in these countries.
Figure 1: EAC Performance of manufactures exports
Source: Authors computation
Effectively considerable improvements are noted and especially after 2005 with the year 2006 being the year that the customs union was properly in place, and all the partner states had agreed to support the same export promotion schemes (EACCU, 1999).
These three nations have embarked on measures to promote growth within the region (EAC) amongst the measures are promoting exports within their respective nations through export
10 The act of forming EPZ in Kenya was passed in 1990, duty remission was also passed in 1990 but came into full
operation in 1993
0 20 40
1980 1981 1982 1983 1984 1985 1986 1987 1988 1989 1990 1991 1992 1993 1994 1995 1996 1997 1998 1999 2000 2001 2002 2003 2004 2005 2006 2007 2008 2009 2010 2011 2012 2013 Aver
…
EAC Perfomance of Manufactures exports
Copyright © Society for Science and Education, United Kingdom 249
promotion schemes (EACCU, 1999). Though theoretically, these schemes are expected to lower the cost of production for the exportable goods. They either hinge on removing or refunding the duty paid on importable inputs used in production of the exportable goods. As such hypothetically it is expected that the exports of the EAC partner states should have as well increased or been triggered amongst other factors in place, since their costs of production have well been decreased.
The success stories of these schemes is not clear on how they are contributing to exports and the manufacturing sector of the respective countries in order to achieve the targets set out on the EAC protocol. It is worth noting that statistical evidence reveals a strong positive association between export development especially for manufactures and accelerated growth in incomes (Helleiner& Gerald, 2002).
Various empirical studies have been carried out on the determinants of exports of manufactured goods in Kenya, Uganda and Tanzania many touching conventionally on the macroeconomic factors like the real exchange rate, GDPs and investments as the main determinants of exports, Such studies have evidently illustrated why the manufacturing sector in the region is either growing in a low pace or stagnant in some countries. Within this framework, the principal objective of this study was premised on making a regional comparison of performance of exports and the manufacturing sector of the EAC countries under the different export promotion schemes.
Consequently, the objective of this study was to analyze the impact of various fiscal incentives (export promotion schemes) in the East African Community on promoting exports in the region determine the relationship between the economic value and accounting value measures of company performance in Kenyan commercial banking sector. The study in achieving this objective examined the impact of three accounting measures (Return on Equity, Return on Assets and Earning per Share) on the economic value in the industry.
Organization of the Study
This study is presented in five sections with section one being the foregoing introduction with section two being the literature review. Section three deals with the methodology and data used for the study while study findings are given in section four with the subsequent conclusions out of the study findings and conclusions being provided in section five.
LITERATURE REVIEW Theoretical review
Generally theories relating to volume of exports basically rely on the demand and supply relationships of exports and imports. For instance, an approach taken by Faini(1988)to explain the determinants of exports assumes that an individual exporter is faced by two constraints in making a decision to export, one is the constraint of the quantity demanded by the foreigners, and the other constraint is the amount the firm is willing and able to supply. As such the quantity exported will rely on these two constraints. These two constraints form the backbone of the demand and supply factors of exports11.
Another approach taken by Goldstein &. Khan(1978), considers two separate simultaneous equations, one for export demand and the other for export supply. In both cases of supply and
11 The two aspects of (Faini, 1988) and (Goldstein & Khan, 1978) are important in this study, because they try
URL: http://dx.doi.org/10.14738/abr.512.3165. 250
demand they estimated an equilibrium and disequilibrium model, using the price of exports and the weighted domestic prices of the same goods. They suggested that the forces of demand and supply are very significant in determining the volumes of exports in Nations24.
Comparative advantage theory states that each country should specialize in producing particular products for which it possess absolute advantage, then it can exchange those products for goods which are produced cheaper in other countries (Dornbusch, Fischer, & Samuelson, 1977). This theory provides a basis for explaining and justifying why international trade occurs and why particular, countries are most suitable for exports of particular goods and services. A nation’s export is induced by its owing distinct advantages in production, such as cheap labor cost, high technology, etc. in comparison with other countries12.
In terms of integration; EAC partner states are countries which have integrated to foster trade amongst themselves and also to the world in general. This is portrayed by their agreement on having common EPS amongst themselves. An important reason why governments integrate in trade perspective is to try to equalize prices amongst their respective countries and have a free trade area. This borrows a leaf from the Hecksher-Ohlin and Samuelson theories of factor-price equalization.
According to (Heckscher, Eli, & Ohlin, 1991) prices of factors of production between countries will always tend to equalize if the prices of the final goods tend to equalize. In autarky, those countries have different prices for the output goods. Once free trade is allowed in outputs, output prices will become equal in the involved countries13. Thus free trade will equalize goods
prices and wage and rental rates. Since the two countries face the same wage and rental rates they will also produce each good using the same capital-labor ratio. However, because the countries continue to have different quantities of factor endowments, they will produce different quantities of the two goods.
Empirical review
Literature on exports performance in countries is mixed up, in terms of policies involved. But theory supports the aspect of making exports to be competitive in the world markets by reducing their production costs. Exports are consumable goods and services; as such many studies tend to explain their variations in countries to being caused by the supply factors of countries exporting those exports and the demand factors of those importing those goods and services (Goldstein & Khan, 1978). Studies done by (Hogan, Keesing, & Singer, 1992; deWulf, 2001; Hogan, 1991) show that EPA are not effective in developing countries, either due to poorly trained civil servants, or over protection of imports or even lack of funding.
Studies conducted by (Togan, 1993; Ianchovichina, 2005; Seringhaus & Rosson, 1990; Gencturk & Kotabe, 2001) show the effectiveness of EPA in countries. The studies have shown success of EPS in form of either increasing export values in countries, exports of manufactured goods increasing or in some instances increase in profits of exports in some countries. A study by (Gencturk & Kotabe, 2001) shows some ambiguity on the performance of EPS where they have increased profits but have not increased sales.
12 The reduction of costs in countries can as well be related to how EPS are operating, because most of them tend
to reduce production costs. Countries can be attributed to follow this theory in adjusting their costs of production in order to encourage production and become more competitive in trade.
13 This is justified as well by the way EAC members have come together and removed tariffs amongst themselves
Copyright © Society for Science and Education, United Kingdom 251
Using gravity model studies done by (Eita & Jordaan, 2007; Lehmann & Zarzoso, 2003; Lwanow & Kirkpatrick, 2007; Taegi & Mahona, 2014; Makau, 2013) have identified other factors which are affecting exports amongst them GDP of the exporting and importing countries, prices of exports, distance between the trading countries and regional integration. Only a study done by (Lwanow & Kirkpatrick, 2007) has augmented trade facilitation in the gravity model to check its impact on trade in African countries.
Apart from empirical studies which have integrated demand and supply factors with duty draw back variable to evaluate the impact of duty drawback(an export promotion scheme), other studies have not done much on the same in trying to explain factors affecting export performance in countries. The studies as well are not clear14 of the success or failure of the EPS
in promoting exports. Studies done for the EAC countries on manufactured exports have also not touched on the integration of EPS with the supply and demand factors to explain performance of exports in these countries.
In the circumstance, this study focused on combining the supply and demand factors of export performance together with the export promotion schemes variables to explain export performance using an augmented gravity model. Effectively the study findings do illustrate the probable best EPS to be applied in the EAC partner states. Since the gravity model has proven15
to be the best tool in analyzing exports and trade volumes, this study combines the standard variables in the gravity model taken as control variables16 with the specific focus on the EPS in
Kenya, Uganda, and Tanzania to carry out a comparison of export performance in the region.
STUDY METHODOLOGY
The study looked at the following specific theories on the subject matter;
Theoretical framework on Export promotion schemes work
The aim of EPS is to offer the inputs that are used to manufacture exports at world prices, those who export earn world or boarder prices. Thus lowering costs of trade-able inputs at least to their world or boarder price level is important. As such the main aim of EPS is to reduce any negative trade fortification on exports. Import-competing yields acceptable constructive trade protection or net subsidies from import tariff, but on the other side exports typically suffer from a disincentive from trade protection through import tariffs. Trade-able imports used as inputs of production of exports are reduced by import tariff, and as such they as well reduce the volumes of exports which is largely a theoretical argument. Essentially the net subsidy of trade-able goods through import tariff is the basis for the EPS argument as discussed by (Ianchovichina, 2005)17 and (Glenday& Ndii, 2000).
Theory begins by assuming an existence of an hypothetical firm Y, whose Profits (Pr0) after
producing an amount X, at a price inclusive of import tariffs of P(1+tX) while incurring: labor
and other non-tradable costs (wL), tradable variable input costs inclusive of imports of mM(1+tM) and capital rental costs, gross of taxes on the capital income or on the capital assets
inclusive of import tariffs(r+δ+TK)K(1+tK) which is presented as:
14 Other studies advocate on EPS in developing countries to promote exports, but others are against it, the ones
against them are basing on the weakness of the agencies which are overseeing these schemes.
15 Many studies have used this model to explain the performance of trade, amongst them being Eita & Jordaan,
2007; Lehmann & Zarzoso, 2003; Lwanow & Kirkpatrick, March 2007; Taegi & Mahona, 2014; Makau, 2013)
16 They are taken as the control variables, because the objective of the study was to estimate the effects of the EPS,
in the midst of these factors affecting exports.
17 In the model, he only focused on duty draw back scheme as the main export promotion scheme, but for Glenday
URL: http://dx.doi.org/10.14738/abr.512.3165. 252
Pr0 = PX (1+tX) – { wL + mM(1+tM) + (r+δ+TK)K(1+tK)}……….………. 1
Where P in the model is the world price, X is the quantity imported and m, M, tM, tX, r, δ, TK, K
are the world price of inputs, world quantity inputs, world tariff rate of inputs, tariff rate, rental rate, depreciation rate, tax rate and capital value of capital assets respectively. The world prices are expressed in domestic currency at current market exchange rates.
At world prices, excluding import tariffs, profit Pr would be:
Pr1 = PX – {wL + mM + (r+δ+TK)K}……….. 2
As such the subsidy (Pr0 – Pr1) from the firm is given by:
S = PX tX– {mMtM + (r+δ+TK)KtK}………...………...….. 3
The net subsidy can be expressed relative to the value of the product sales at world prices as:
S = tX – {ωMtM+ (ωK+ ωT) tK}……….………... 4
Where ωM, ωK and ωT are the shares of the costs of tradable inputs, net-of-tax, capital rental
cost and capital taxes respectively.
When the good produced is exported or imported duty free; the subsidy will always be negative mathematically, and tx becomes zero as shown in equation 5 below:
S = – {ωMtM+ (ωK+ ωT) tK}………... 5
To avoid this negative protection, EPS make tariff import on tradable inputs to zero, some schemes can reduce the capital equipment to be zero. The administration of the scheme also adds an extra cost in the economy18.
Theoretical framework on determinants of exports and the gravity model
Deriving from (Goldstein & Khan, 1978) and (Mah, 2007) approaches of determinants of exports, the main factors affecting exports mainly comprise of the supply and demand factors. Theoretically demand and supply cannot be expressed explicitly without involving prices. Both (Goldstein & Khan, 1978) specifies that:
Xt=f (Rt,YFt)………..6
Where Xt is exports, Rt is competitiveness and YFt is foreign economic activity. Their analyses
are in line with those of (Faini, 1988) and (Milner & Zgovu, 2003), who by assuming away unexpected shocks in the economy, suggested that export supply in the economy depends primarily on the export price and the economy’s productive capacity to support export production.
18 Apart from the government suffering the costs of administrations, it can as well suffer from revenue losses if it
Copyright © Society for Science and Education, United Kingdom 253
The gravity model is a standard model which relates bilateral trade with economic mass of two countries, and the distance between them. The model derived from (Tinbergen, 1962; Linnemann, 1966) has a general multiplicative form where trade is directly related to the economic mass of countries and inversely related to distance between the trading countries, with a combination of the derivation by (UNCTAD and WTO, 2012) the multiplicative form of the model which is presented as:
Xij=WXYZ[ƟY[]
^_ ………..………7
This is transformed logarithmically to interpret elasticity as:
lnXij= lnG + lnSi +lnMj +lnƟij- lnDij………..……….8
Where Xij is the value of exports from nation i to nation j, Sj is the exporter specific factors that
make up the supply factors, Mj is the importer specific factors that make up the demand for
exports factors, G is a value that does not depend on country i or j for instance world liberalization, Ɵij is the ease of exporter i to access of market j, and Di j is the distance variable,
which measures the transport cost of trade. Various studies19 have transformed this standard
expression to include other variables assuming that the volume of trade between two countries is positively related to the size of these economies as measured by GDP and negatively related to the trade costs between them.
Model specification
Evidently from the two sides of the theories of exports factors; the general augmented gravity model which was used for variable estimation, utilized the gravity model as specified by (Tinbergen, 1962; Linnemann, 1966) and the augmented model by (Eita & Jordaan, 2007; Lehmann & Zarzoso, 2003; Lwanow & Kirkpatrick, 2007; Taegi & Mahona, 2014; Makau, 2013). Effectively this study derived and utilized an augmented gravity model of the form:
Xijt=f(GDPVc)GDPdc+ExchVcEFRIVckDISTVcnToVcDPVT$)……….……9
Transforming it to a log linear function, it becomes:
lnXijt = β0 + β1lnGDPi+ β2lnGDPj + β3lnExchi+ β4lnFRIi + β5lnDISTij + β6lnToi+ Dikt +
μit………...10
Where Xijt is export volumes from country i to country j, GDPi is the gross domestic product of
the exporting country, GDPj is the gross domestic product of the importing country, Exchi is the
official exchange rate variable of exporting country, FRIi is the foreign income variable of the
exporting country, DISTijis the distance from country i to j, Toi is trade openness of the
exporting country, Diktare the dummy variables capturing the effects of particular export
promotion schemes in country i20, t is the time variable(1980 -2013) and μ is the error term.
19(Eita & Jordaan, 2007; Lehmann & Zarzoso, 2003; Lwanow & Kirkpatrick, March 2007; Taegi & Mahona, 2014;
Makau, 2013) All these studies have used the augmented gravity model in their analysis of exports and trade performance.
20 As mentioned earlier, the schemes considered in this study are the ones in the EAC protocol, but others like
URL: http://dx.doi.org/10.14738/abr.512.3165. 254
Country specific models are: Kenya:
LnXKjt = a0 + a1lnGDPK+ a2lnGDPj + a3lnExchK+ a4lnFRIi + a5lnDISTKj+ a6lnToK+ D2DRFK +
D3MUBK + D4EPZK + λit……….…...11
Uganda:
LnXUjt = b0 + b1lnGDPU+ b2lnGDPj + b3lnExchU+ b4lnFRIi + b5lnDISTUj+ b6lnToU+ D2VATXU+
D3DDSU + D4MUBU + ηi………..………..…….12
Tanzania:
LnXTjt = c0 + c1lnGDPT+ c2lnGDPj + c3lnExchT+ c4lnFRIj + c5lnDISTTj+ c6lnToT+ D2EPZT +
D3EDRT+ D4DDST +δTt……….……….……….13
Where XKjt are the export volumes from Kenya to country j at time t, XUjt are the export
volumes from Uganda to country j at time t, and XTjt are export volumes from Tanzania to
country j at time t.
In Kenya: D2DRFK is the duty remission facility variable (where 1=period when duty remission
facility was in place, and 0= otherwise), D3MUBK is the manufacturing under bond scheme
variable (where 1=period when manufacturing under bond scheme was in place and 0=otherwise), D4EPZK is the export processing zones variable (1=period when export
processing zones were in place, 0=otherwise).
In Uganda: D2VATXU is the value added tax remission facility variable (1=period when value
added tax remission was in place, and 0= otherwise), D3DDSU is the duty drawback scheme
variable (where 1=period when duty drawback scheme was in place, 0=otherwise), D4MUBU is
the manufacturing under bond scheme variable (where 1=period when manufacturing under bond scheme was in place and 0=otherwise)
In Tanzania: D4DDST is the duty drawback scheme variable (where 1=period when duty
drawback scheme was in place, and 0= otherwise), D3EDRT is the exercise duty relief facility
variable (where 1=period when exercise duty relief was in place and 0=otherwise), D2EPZT is
the export processing zones variable(where 1=period when export processing zones were in place, 0=otherwise), and the bases a0, b0, c0 for each respective country will capture the effects
of all the EPS being in place such that 1 = period when all the EPS were in operation, and 0 = otherwise (either one scheme in place, or none in place).
Data and tests
Secondary panel data was used in the study for a period ranging from 1980 to 2013, for Kenya, Uganda and Tanzania. Appropriate tests were carried out to validate the use of the specified model of estimation. Effectively, Hausman specification test and the Breusch-Pagan Lagrange multiplier(LM) test for random effects were carried out to determine the choice between the Fixed Effect Model and the Random Effect Mode. The results of these tests confirmed that a Fixed Effect model was appropriate for eestimation.
DATA ANALYSIS Summary of the results
Copyright © Society for Science and Education, United Kingdom 255
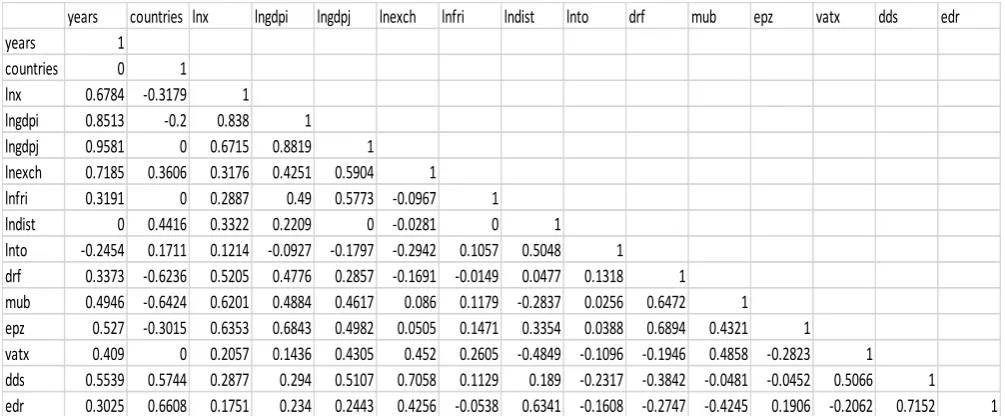
to export and import more. The results also do suggest that there is significant strong positive correlations between volumes of exports and duty remission facility; manufacturing under bond scheme and export processing zones schemes. Indeed the other schemes tested have positive correlations which are not quite strong which may largely be attributed to their existence in shorter periods.
Table 4.1: Correlation Matrix
Source: Authors computation
Fixed effects model
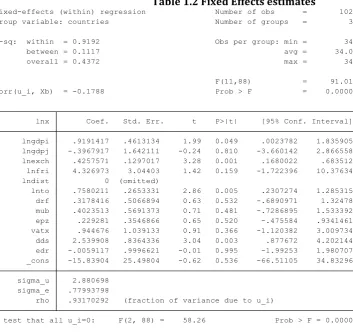
The variable distance was dropped from the analysis because of showing a high degree of collinearity. From the fixed effect model estimated in table 4.3; the most statitical significant variables in explaining the volumes of manufactured exports in EAC were exchange rates, terms of trade and duty draw back scheme variables.
The results showed that duty drawback schemes increased the volumes of exports by close to 2.5%, in the years it was introduced. Notably among the variables, though statistically insignificant; a 1% increment in the foreign income (GDP per capita of sub saharan Africa countries) led to a 4.3% increment in the volumes of manufactured exports in EAC. The other export promotion schemes have a positive influence on the levels of exports of EAC but most (all of them apart from duty drawback schemes) are statistically insignificant in explaining the volumes of manufatured exports in EAC.
Exchange rates for the three countries has shown a statistically significant impact at 1% confidence level, with a 1% increment in the exchange rates of the EAC leading to 0.43% increment in the levels of exports, implying exporters increased their levels of exports as the dollar value appreciated against the local currencies of the EAC partner states.
From table 4.2 below; the constant coefficient is negative, implying all the export promotion schemes could not spur any much growth on the exports in unison.
years countries lnx lngdpi lngdpj lnexch lnfri lndist lnto drf mub epz vatx dds edr
years 1
countries 0 1
lnx 0.6784 -0.3179 1
lngdpi 0.8513 -0.2 0.838 1
lngdpj 0.9581 0 0.6715 0.8819 1
lnexch 0.7185 0.3606 0.3176 0.4251 0.5904 1
lnfri 0.3191 0 0.2887 0.49 0.5773 -0.0967 1
lndist 0 0.4416 0.3322 0.2209 0 -0.0281 0 1
URL: http://dx.doi.org/10.14738/abr.512.3165. 256
Table 1.2 Fixed Effects estimates
Source: Authors computation
The random effects results in table 4.3 are generalized results of the EAC partner states, in terms of the export promotion schemes which are in place for them. To carry out a comparative analysis of country individual effects, individual analysis of the results was in order.
Individual country performance of EPS
Evidently the relatively high collinearity amongst value added tax remission (vatx), excise duty relief (edr) and average distance between EAC partner states did not allow us to use the variables. Consequently the results relating to the effect of the Export Promotion Schemes visa avis manufacturing for exports for the individual EAC countries is as follows;
Performance of manufactures for exports in Kenya under the established EPS
Duty remission facility and export processing zones have a significant impact on the volumes of manufactured exports in Kenya, from the results; exports volumes have increased by 1.37% and 0.9% in the introduction of duty remission facility and export processing zones respectively.
Though manufacturing under bond scheme was introduced in Kenya in earlier periods than duty remission facility and export processing zones, in this study it has revealed insignificant results, with export volumes increasing by only 0.17%.
On the control variables; GDP of the foreign countries (Sub-Saharan African Countries) has produced the highest results, with a 1% increment in the GDP of these countries leading to a 5.22% increment in the volumes of manufactures exports in Kenya. Whilst this is the case it is
F test that all u_i=0: F(2, 88) = 58.26 Prob > F = 0.0000 rho .93170292 (fraction of variance due to u_i)
sigma_e .77993798 sigma_u 2.880698
_cons -15.83904 25.49804 -0.62 0.536 -66.51105 34.83296 edr -.0059117 .9996621 -0.01 0.995 -1.99253 1.980707 dds 2.539908 .8364336 3.04 0.003 .877672 4.202144 vatx .944676 1.039133 0.91 0.366 -1.120382 3.009734 epz .229281 .3546866 0.65 0.520 -.475584 .9341461 mub .4023513 .5691373 0.71 0.481 -.7286895 1.533392 drf .3178416 .5066894 0.63 0.532 -.6890971 1.32478 lnto .7580211 .2653331 2.86 0.005 .2307274 1.285315 lndist 0 (omitted)
Copyright © Society for Science and Education, United Kingdom 257
still not significant in explaining the levels of exports at 5% confidence level, all the other control variables of explaining the volumes of manufactures exports are not statistically significant.
Performance of manufactures exports in Uganda under the established EPS
In Uganda, the duty drawback scheme is very significant in explaining the volumes of manufactured exports, with export volumes increasing by 1.72% since the introduction of the duty draw back scheme in 1995.
Manufacturing under bond scheme has had a 0.78% increment in the volumes of exports in Uganda but it is statistically insignificant, value added tax remission was omitted due to collinearity.
The other variables are not statistically significant in explaining the volumes of exports at 5% significance level, but GDP of Uganda and Terms of trade are statistically significant at 10%, with a 1% increment in the levels of GDP and terms of trade of Uganda leading to a 1.13% and 0.067% increment in the levels of exports respectively.
Performance of manufactures exports in Tanzania under the established EPS
Exports volumes have increased by 2.94% with the introduction of the duty drawback scheme in Tanzania, the variable is as well statistically significant at 5% confidence level. Export processing zones has a negative impact but it is statistically insignificant in explaining the volumes of exports in Tanzania.
Excise duty relief was dropped from the model due to its collinearity. In terms of the other control variables; Terms of trade had a negative impact on the volumes of exports for Tanzania, with its worsening causing a 1.1% decrease in the volumes of exports.
The exchange rate variable was a significant variable in explaining the volumes of exports in Tanzania, with a 1% increment in the exchange rates level, resulting to a reduction of volumes of exports by 1.52%.
CONCLUSIONS AND POLICY RECOMMENDATION
The main objective of this study was to analyze the performance of manufactured exports under the existing export promotion schemes in EAC, and suggest policy recommendations. The study used an augmented gravity model to capture the effects of the EPS in the presence of other control variables which affect export volumes in countries.
The EAC partner states in their EAC customs union protocol agreed to support Export processing zones, manufacturing under bond scheme, duty drawback schemes, and duty and value added tax remission for enhanced export trade amongst the partner states.
Using the augmented gravity model, the study results illustrated that duty drawback scheme was the most significant EPS in promoting export volumes. The results further suggested that duty drawback scheme boosted the volumes of exports in both Uganda and Tanzania. In Kenya duty remission facility and export processing zones were the most effective export promotion schemes in promoting the volumes of exports.
URL: http://dx.doi.org/10.14738/abr.512.3165. 258
very long time, it was not been effective in promoting volumes of exports in both countries. Also the study findings indicate that value added tax remission and excise duty relief schemes are not effective in promoting the volumes of exports in Uganda and Tanzania respectively.
Therefore in conclusion, choice of the EPS in EAC partner states has mixed results and notably manufacturing under bond scheme is not an effective EPS in promoting the volumes of exports in these EAC Countries which were the focus of the study.
The consequential policy recommendation out of the study findings include; possible application of duty drawback and duty remission as appropriate export promotion schemes for all the EAC partner states as a means of promoting increased exports volumes of manufactures amongst the countries.
Possible further area of research
It however should be noted that this study only focused on the broad performance of the EPS in promoting exports in EAC. It did not examine what happens at the micro level in terms of why the various schemes have not worked for some countries. Evidently there is need for further investigation unto the critical aspect of the performance of export promotion schemes in EAC partner states at the individual country level.
References
Balassa, B. (1978). Export incentives and export perfomance in developing countries: A comparative analysis.
Weltwirtschaftliches Archiv, 1, 24-61.
Bauerschmist, A., Sullivan, D., & Gillespie, K. (1990). Common factors underlying barriers to export: A comparative study in the U.S paper industry. International business studies, 16(3), 111-123.
deWulf, L. (2001). Why have trade promotion organisation failed and how can they be revitalised? World Bank(WPS 24843), 57.
Dornbusch, R., Fischer, S., & Samuelson, P. (1977). Comparative Advantage, Trade and Payments in a Ricardian Model with a Continuum of Goods. American Economic Review , 67, 823–839.
EAC, E. A. (2004). The East African Community customs management ACT. Revised edition 2009. Government Printer Nairobi.
EACCU, E. A. (1999, November 30th). Protocol on the establishment of the East African customs union. EAC. Eita, J., & Jordaan, A. (2007). South Africa Exports of Metals and Articles of Base Metal: A gravity Model Approach.
Journal for Studies in Economics and Econometrics, 31(3), 81-95.
Faini, R. (1988). Export supply, capacity and relative prices. Policy, planning and research working papers, WPS 123, 3-21.
Frankel, J., & Wei, S. (1995). European Integration and the Regionalization of World Trade and. The Economics and
the Politics, Center for International and Development Economics, Working Papers C95-053.
Gencturk, E., & Kotabe, M. (2001). The effect of export assistance program usage on export perfomance: A contigency explanation. International Marketing, 9(No. 2), 51-72.
Glenday, G., & Ndii, D. (July, 2000). Export platforms in Kenya. African Economic Policy Discussion Paper . Goldstein, M., & Khan, M. s. (1978). The supply and demand for exports: A simultaneous approach. The review of economics and statistics, 60(2), 275-286.
Görg, H., Henry, M., & Strobl, E. (2008). Grant support and exporting activity. Developing economies, 90(No.1), 168-174.
Greene, W. (2003). Econometric Analysis. New York : Prentice Hall. Gujarati, D. (2004). Basic Econometrics (4th ed.). McGraw-Hill Companies.
Copyright © Society for Science and Education, United Kingdom 259
Helleiner, & Gerald, K. (2002). Non-traditional export promotion in Africa. Economic issues, 12-56.
Hinkle, L. E., Aragon, A. H., & Kubota, K. (2003, June). How far did Africa's first generation trade reforms go? An intermediate methodology for comparative analysis of trade policies. Africa region working paper series, 2, NO. 58b.
Hogan, P. (1991). Some institution aspects of export promotion in developing countries: The role of support services in expanding manufactured exports in developing countries. (P. Hogan, D. Keesing, & A. Singer, Eds.)
Economic development institute of World Bank, 39-56.
Hogan, P., Keesing, D. B., & Singer, A. (1992). The role of support services in expanding Manufactured exports in Developing countries. Economic development institute of the World Bank(No 9928), 19-38.
Ianchovichina, E. (2005). Duty drawbacks, competitiveness and growth: Should China reform its Drawback system? World Bank policy research working papers, No. 3498.
Janniffer, N. (October 2013). The role of export promotion in increasing export volume in . Research paper Makerere University.
Kedia, B., & Chhokar, J. (1986). Factors inhibiting export perfomance of firms: An empirical investigation.
Management Review, 26(4), 33-43.
Krugman, P. (1980). Scale economies, product differentiation and the pattern of trade. American Economic Review,, 12-45.
Lederman, D., Olarreaga, M., & Payton, L. (2008). Export Promotion Agencies: What works and what doesn't. Policy
Research working papers, WPS 5125.
Lehmann, N., & Zarzoso, M. (2003). Augmented gravity model: An empirical application to Mercosur-European Union. Apllied Economics, 6(2), 291-316.
Linnemann, H. (1966). An Econometrics study of International Trade Flows. Amsterdam North-Holland. Lwanow, T., & Kirkpatrick, C. (March 2007). Trade Facilitation and Manufacturing Exports: Is Africa Different?
Economic Development in Africa (pp. 1-32). University of oxford UK: Impact Assessment Research Centre Institute
for Development Policy and Management University of Manchester.
Mah, J. (2007). Duty draback and export promotion in China. Developing Areas, 40(No. 2), 133-140. Mah, J. (February 2006). Export Promotion and Economic Development of Korea. Journal of World trade. Makau, F. N. (2013). Kenya's Manufactured exports perfomance and competitiveness. Nairobi, Kenya: School of Economics: University of Nairobi.
Marianna, B., & Michele, D. (2011). Survey of the literature on successful strategies and practices for export promotion by developing countries. International Growth Centre London School of Economics and Political Science, 34, 1-57.
Milner, C., & Zgovu, E. (2003, march). Export response to trade liberalisation in the presense of high trade costs: Evidence for a landlocked african economy. CREDIT Research Papers, NO 03/04.
Niringiye , A., Luvanda , E., & Shitundu , J. (2010). Determinants of Export Participation in East African Manufacturing Firms. Current Research Journal of Economic Theory, 2, 55-61.
Radelet, S., & Sachs, J. (1998). Shipping Costs, Manufactured Exports, and Economic Growth.
Seringhaus, F., & Botschen, G. (1991). Cross-National comparison of export promotion services: The views of Canadian and Australian companies. International business studies, 22(No 1), 115-133.
Seringhaus, F., & Rosson, P. J. (1990). Government export promotion: A global perspective. International business studies, 21(No 3), 514-516.
Shamsuddoha, A., & Ali, M. (2006). Mediated effects of export promotion program on firm export perfomance. Asia pacific journal of Marketing and logistics, 18(2), 93-110.
Taegi , K., & Mahona, B. (2014). Determinants of Trade Patterns and Comparative Advantage of Tanzania Trade 1981-2009. Developing countries studies, 4(3), 2-17.
Tinbergen. (1962). Shaping the world economy. Newyork: Suggestions for an International Economic Policy. Togan, S. (1993). How to assess the significance of export incentives: An application to Turkey.
URL: http://dx.doi.org/10.14738/abr.512.3165. 260
Uganda. (1991). Uganda Investement Code ACT – 1991.