ISSN: 2231-5381
http://www.ijettjournal.org
Page 284Effect of Stabilization Using Flyash and GGBS
in Soil Characteristics
1
Oormila.T.R & 2T.V.Preethi
1
Graduate Student, Department of Civil Engineering, Geotechnical Engineering, SRM University, Kattankulathur-603203,
Tamil Nadu, India
2
Assistant professor, Department of Civil Engineering, SRM University, Kattankulathur-603203, Tamil Nadu, India
ABSTRACT
Expansive soils are a worldwide problem that poses
several challenges for civil engineers. They are considered a
potential natural hazard, which can cause extensive damage to
structures if not adequately treated. Such soils swell when
given an access to water and shrink when they dry out.
Utilization of industrial waste materials in the improvement of
soils is a cost efficient and environmental friendly method.
Stabilisation of the soil is studied by using flyash and ground
granulated blast furnace slag. This paper includes the
evaluation of soil properties like unconfined compressive
strength test and California bearing ratio test. The soil sample
was collected from Palur, Tamil Nadu and addition to that,
different percentages of flyash (5, 10%, 15% and 20%) and
GGBS (15%, 20%, 25%) was added to find the variation in its
original strength. Based on these results CBR test was
performed with the optimum flyash, optimum GGBS and
combination of optimum flyash with varying GGBS
percentages (15%, 20%, and 25%). From these results, it was
found that optimum GGBS (20%) gives the maximum
increment in the CBR value compared with all the other
combinations.
Keywords: California bearing ratio test, Clay Soil, fly ash,
ground granulated blast furnace slag, soils, unconfined
compressive strength test
I. INTRODUCTION
In developing countries like India, the biggest handicap is to provide a complete network of road system in the limited furnaces available to build road by conventional method. Therefore there is a need to go for suitable method of low cost road construction followed
by a process of stage development of the roads, to meet the growing needs of road traffic. The construction can be considerably decreased by selecting local materials including local soils for the construction of the lower layers of the pavement such as the sub-base course and subgrade soil. If the stability of the local soil is not adequate for supporting the wheel loads, the properties are improved by soil stabilization techniques (Pankaj.R.Modak et al. 2012). The soil stabilization means the improvement of stability or bearing power of the soil by the use of controlled compaction, proportioning and/or the addition of suitable admixture or stabilizer. It can be used to treat a wide range of sub-grade materials from expansive clay to granular materials (Krishna Gudi et al. 2013).
ISSN: 2231-5381
http://www.ijettjournal.org
Page 285sufficient amount of soil of required quality is not available easily. These industrial wastes which are used as a substitute for natural soil in the construction not only solve the problems of disposal and environmental pollution but also help to preserve the natural soil. Bidula Bose (2012) studied the geo-engineering properties of the virgin soil and flyash treated soil and it was found that there was 55% increment in the CBR value when compared with the virgin soil. Erdal Cokca (2008) studied the effect of ground granulated blast furnace slag (GGBS) and GBS-cement with a view to decrease the construction cost and It was found that there was 62% decrement in the swelling potential with GGBS treated soil from the virgin soil. Anil K.S & P.V.Sivapullaiah (2011) studied the effectiveness of flyash with ground granulated blast furnace slag in the soil and it was found that the UCS of flyash- GGBS mixture increases with the increase in the GGBS content. And also it was observed that the strength increases with the curing period.
II. MATERIALS USED
The soil sample for this study was collected from Athipattu, Thiruvallur distric, Tamil Nadu in India. It was collected from a depth of 40m below the natural ground level by open excavation. The soil was dried and pulverized to perform the various experimental studies.
Flyash is fine, glass powder recovered from the gases of burning coal during the production of electricity. These micron-sized earth elements consist primarily of silica, alumina and iron. When mixed with water, the flyash forms a cementitious compound with properties very similar to that of Portland cement. The flyash used in the experimental studies was collected from Ennore thermal power plant which is in the Chennai district of Tamil Nadu, India.
Blast furnace slag is produced as a by-product during the manufacture of iron in a blast furnace. Molten blast furnace slag has a temperature of 1300-1600ᵒC and is chilled very rapidly to prevent crystallization. The granulated material thus produced is known as granulated blast furnace slag. Blast furnace slag has a
glassy, disordered, crystalline structure which can be seen by microscopic examination which is responsible for producing a cementing effect. The GGBS used in this study was collected from Visakhapatnam in Andhra Pradesh, India.
III.METHODS OF TESTING
The laboratory tests carried out on the natural soil include Sieve analysis, Atterberg limits, Specific gravity, Free swell test, Standard Proctor test, Unconfined Compressive strength test and California Bearing Ratio test.
Unconfined compressive strength test (UCS)
The shearing strength is commonly investigated by means of compression tests in which an axial load is applied to the specimen and increased until failure occurs. The unconfined compressive strength is the load per unit area at which and unconfined cylindrical specimen of soil will fail in a simple compression test. If the unit axial compression force per unit area has not reached a maximum value up to 20 percent axial strain, unconfined compressive strength shall be considered the value obtained at 20 percent axial strength. This test was conducted as per IS 2720 (Part10): 1973.
California Bearing Ratio test (CBR)
ISSN: 2231-5381
http://www.ijettjournal.org
Page 286IV.RESULTS AND DISCUSSIONS
The physical properties of the soil used in this study before the addition of stabilizers are shown in Table 1.From this, it can be said that the soil is clay of intermediate compressibility.
Table 1: Physical properties of the soil
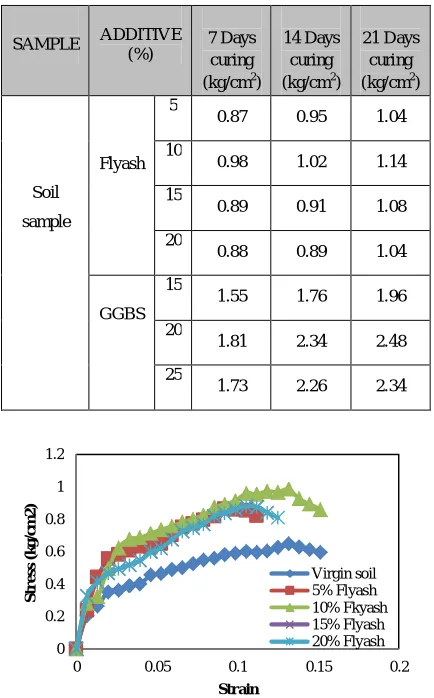
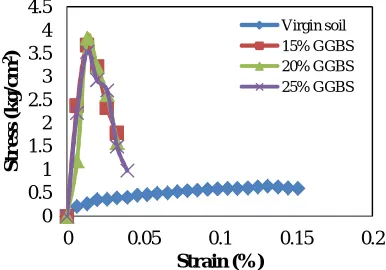
For performing the UCC test the soils were prepared by adding the optimum moisture content obtained by conducting the Standard Proctor test. The admixtures were added at varying percentages of Flyash (5%, 10%, 15% & 20%) and GGBS (15%, 20% & 25%) for 7, 14 & 21days of curing. The variation in the strength can be observed in Figure 1 and 2 with varying percentages of flyash alone and GGBS alone respectively for 7days curing. The UCS value for different percentages of flyash and GGBS are given in Table 2.
Table 2: UCS value for different percentages of flyash and GGBS
SAMPLE ADDITIVE
(%) 7 Days curing
(kg/cm2)
14 Days curing (kg/cm2)
21 Days curing (kg/cm2)
Soil
sample
Flyash 5
0.87 0.95 1.04
10
0.98 1.02 1.14
15
0.89 0.91 1.08
20
0.88 0.89 1.04
GGBS 15
1.55 1.76 1.96
20
1.81 2.34 2.48
25
1.73 2.26 2.34
Figure 1: UCS value for different percentages of flyash by curing for
7days
Figure 2: UCS value for different percentages of GGBS by curing for
7days
Similarly the variation in the strength was determined for 14days as well as for 21days and is shown in Figure 3, 4, 5 & 6.
0 0.2 0.4 0.6 0.8 1 1.2
0 0.05 0.1 0.15 0.2
S
tr
e
ss
(
k
g
/c
m
2
)
Strain
Virgin soil 5% Flyash 10% Fkyash 15% Flyash 20% Flyash
0 0.2 0.4 0.6 0.8 1 1.2 1.4 1.6 1.8 2
0 0.05 0.1 0.15 0.2
S
tr
e
ss
(
k
g
/c
m
2
)
Strain (%)
Virgin soil 15% GGBS 20% GGBS 25% GGBS
Test Parameters Symbo
l
Description
Sieve Analysis Sand S 14.66%
Silt & Clay M & C
85.34%
Atterberg
Limits
Liquid Limit WL 74%
Plastic Limit WP 22.7%
Shrinkage Limit WS 5.06%
Plasti
city
Index
IP = WL-WP
IP
51.3%
A-line
Equation* 39.42%
Classification
of soil CH
Specific
Gravity
G
2.15
Free swell test 53.85%
Standard
proctor test
ᵞd max
1.44
OMC 26.13%
UCC UCS value qu 0.65
ISSN: 2231-5381
http://www.ijettjournal.org
Page 287Figure 3: UCS value for different percentages of flyash by curing for
14days
Figure 4: UCS value for different percentages of GGBS by curing for
14days
Figure 5: UCS value for different percentages of flyash by curing for
21days
Figure 6: UCS value for different percentages of GGBS by curing for
21days
From the UCC test the optimum Flyash and optimum GGBS percentages were determined as 15% and 20%, respectively.
Figure 7: Failure pattern in Flyash alone & GGBS alone treated soil
sample
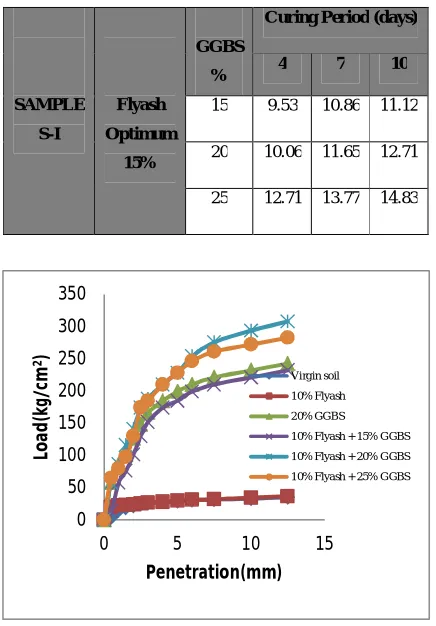
Based on the above results, samples were prepared for CBR test i.e., with optimum Flyash (15%), optimum GGBS (20%) and combination of optimum Flyash with varying GGBS percentages (15%, 20% & 25%) and were tested after curing for 4, 7 & 10days. For the CBR test a graph will be plotted for penetration Vs loads. The 4 days curing results are shown in Figure 8. The CBR values of these are shown in Table 3 and 4.
Table 3: CBR value for optimum percentages of flyash and GGBS
SAMPLE
S-I
Additive (%)
Curing period (days)
4 7 10
Flyash
Optimum 15%
1.86 2.15 3.22
GGBS
Optimum 20%
10.86 11.12 12.18
0 0.2 0.4 0.6 0.8 1 1.2
0 0.05 0.1 0.15 0.2
S
tr
es
s
(k
g
/c
m
2
)
Strain (%)
Virgin soil 5% Flyash 10% Fkyash 15% Flyash 20% Flyash
0 0.5 1 1.5 2 2.5 3
0 0.05 0.1 0.15 0.2
S
tr
es
s
(k
g
/c
m
2
)
Strain (%)
Virgin soil 15% GGBS 20% GGBS 25% GGBS
0 0.5 1 1.5 2 2.5
0 0.05 0.1 0.15 0.2
S
tr
es
s
(k
g
/c
m
2)
Strain (%)
Virgin soil 5% Flyash 10% Fkyash 15% Flyash 20% Flyash
0 0.5 1 1.5 2 2.5 3 3.5 4 4.5
0 0.05 0.1 0.15 0.2
S
tr
e
ss
(
k
g
/c
m
2)
Strain (%)
ISSN: 2231-5381
http://www.ijettjournal.org
Page 288Table 4: CBR for optimum flyash with varying GGBS percentages
SAMPLE
S-I
Flyash
Optimum
15%
GGBS
%
Curing Period (days)
4 7 10
15 9.53 10.86 11.12
20 10.06 11.65 12.71
25 12.71 13.77 14.83
Figure 8: CBR value for different percentages after curing for
4days
Similarly, Figure 9 and 10 shows the variation in the CBR value after curing for 7 and 10days.
Figure 9: CBR value for different percentages after curing for
7days
Figure 9: CBR value for different percentages after curing for 10days
V. CONCLUSION
From the results of this study, the following conclusions can be made:
By conducting the UCC test for virgin and treated soil (5%, 10%, 15% and 20% of flyash), it was found that the soil treated with 10% of flyash gives the optimum strength when compared with the virgin soil at an increment of 42.98% for 21days of curing.
Soil was treated with various percentages of GGBS (15%, 20% and 25%) and UCC test was performed. From the UCS value it was found that soil treated with 20% of GGBS gives the optimum strength when compared with the virgin soil with an increment of 73.79% for 21days of curing.
Based on the UCC test results, the CBR test was performed with the optimum flyash (10%), optimum GGBS (20%) and also for combinations of optimum flyash with varying GGBS percentages (15%, 20% and 25%).
By conducting the CBR tests, it was found that among the combinations of optimum flyash with varying GGBS percentages (15%, 20% and 25%), 10% flyash with 25% of GGBS gives an increment of 78.29% in the CBR value with curing period of 10days when compared with the CBR value of the virgin soil.
0 50 100 150 200 250 300 350
0 5 10 15
Lo
a
d
(k
g/c
m
2)
Penetration(mm) Virgin soil
10% Flyash
20% GGBS
10% Flyash + 15% GGBS
10% Flyash + 20% GGBS
10% Flyash + 25% GGBS
0 50 100 150 200 250 300 350
0 10 20
Lo
a
d
(k
g/c
m
2)
Penetration(mm) Virgin soil
10% Flyash
20% GGBS
10% Flyash + 15%GGBS
10% Flyash + 20% GGBS
10% Flyash + 25% GGBS
0 50 100 150 200 250 300 350 400
0 5 10 15
Lo
a
d
(k
g/c
m
2)
Penetration(mm)
Virgin soil 10% Flyash 20% GGBS
ISSN: 2231-5381
http://www.ijettjournal.org
Page 289 When the period of curing increases, the strength of soil with the above mentioned combination will improve.
VI. REFERENCES
1. Anil Kumar Sharma, Sivapullaiah, P.V., (2011). “Soil
stabilization with waste materials based binder”,
Proceedings of Indian Geotechnical Conference.
2. Bidula Bose., (2012). “Geo-Engineering properties of
expansive soil stabilized with flyash”, Electronic Journal of
Geotechnical Engineering, Vol. 17, pp 1339-1353.
3. Erdal Cockca., (2001). “Use of class C flyashes for the
stabilization of an expansive soil “, Journal of Geotechnical
and Geoenvironmental Engineering, pp 568-573.
4. Erdal Cokca et al., (2009). “Stabilization of Expansive clays
using Granulated Blast furnace slag (GBFS) and GBFS-
Cement”,Geotech Geol Eng 27: 489-499.
5. Gyanen Takhelmayum, Savitha,A.L, Krishna Gudi., (2013).
“Laboratory study on soil stabilization using Flyash
admixtures”, International Journal of Engineering Science
and Innovative Technology, Vol. 2, Issue 1.
6. IS: 2720 -Part 3-1980,” Determination of Specific gravity”.
7. IS: 2720 -Part 40-1977,” Determination of free swell index
of soil”.
8. IS: 2720 -Part 10-1973,” Determination of unconfined
compressive strength test”.
9. IS: 2720 -Part 16-1987,” Laboratory determination of
CBR”.
10. Kumar, BRP.,Sharma, RS., (2004). “Effect of flyash on
engineering properties of expansive soils”, J Geotech
Geoenivronmental Engineering ASCE 130(7): pp 764-767.
11. Laxmikant Yadu, Tripathi, R.K.., (2013). “Stabilization of
soft soil with granulated blast furnace slag and flyash”,
International Journal of Research in Engineering and
Technology, vol. 2, Issue 2, pp115-119.
12. Pandian, N.S., (2004). “Flyash characterization with
reference to geotechnical applications”, Journal of Indian
Institution of Science, pp 189-216.
13. Pankaj,R.Modak, Prakash, B.Nangare, Sanjay, D.nagrale,
Ravindra, D. Nalawade, Vivek, S.Chavhan., (2012).
“Stabilisation of black cotton soil using admixtures”,
International Journal of Engineering and Innovative
Technology, Vol. 1, Issue 5.
14. Phani kumar, B.R., and Sharma, R.S., (2004). “Volume
change behaviour of flyash stabilized clays”, Journal of
Materials in Civil Engineering, pp 67-74.
15. Sharma,A.K. and Shivapulliah, P.V., (2012). “Improvement
of strength of expansive soil with waste granulated blast