Declining Orangutans Population in the Unprotected Forest of Batang Toru
1Arfah Nasution*, 1,2Dyah Perwitasari-Farajallah and 3Sri Suci Utami-Atmoko
1Faculty of Mathematics and Natural Sciences, Bogor Agricultural University (IPB), Bogor 16680, West Java, Indonesia
2Primate Research Center, Bogor Agricultural University, Bogor, West Java, Indonesia 3Faculty of Biology, Universitas Nasional, Jakarta 12520, Indonesia
Published Online: 6 July 2018
To cite this article: Arfah Nasution, Dyah Perwitasari-Farajallah and Sri Suci Utami-Atmoko. (2018). Declining orangutans population in the unprotected forest of Batang Toru. Tropical Life Sciences Research 29(2): 77–87. https://doi.org/10.21315/tlsr2018.29.2.6 To link to this article: https://doi.org/10.21315/tlsr2018.29.2.6
Abstract: Habitat loss and hunting are major threats to the long-term survival of the viable orangutan population in Batang Toru. East Batang Toru Forest Block (EBTFB) is the most threatened area due to low forest cover and high encroachment. Based on a preliminary survey in 2008, Hopong forest which is located in EBTFB, had the highest orangutan density (0.7 ind/km2). However illegal logging and hunting of protected species were occuring in this unprotected forest. Since this location has been gazetted as unprotected forest from the first survey until this study was conducted, it is important to assess orangutans population trends. This study aims to provide an updated density of orangutan in Hopong forest. The study included the location of the original survey but covered a wider overall area. The line transect method was used to record orangutan nests, ficus and trees bearing fruits. A quadrat method was used to record vegetation. The encounter rate of orangutan declined from 0.7 ind/km2 to 0.4 ind/km2 between 2008 and 2015. Forest cover has also changed in the seven years between surveys and this has influenced orangutan and orangutan nest encounter rates in Hopong. Since unprotected forest is at more risk in comparison with protected forest, allocation status of the Hopong forest is critical to reduce the threats it faces.
Keywords: Batang Toru, Declining Orangutan, East Batang Toru, Unprotected Forest, Pongo tapanuliensis
INTRODUCTION
The Tapanuli orangutan (Pongo tapanuliensis) is the third species of orangutan that discovered recently. This newly great ape is isolated in small numbers of fragments forest in Tapanuli – a district in North Sumatera (Nater et al. 2017) and the last population remaining to the south of Lake Toba (Wich et al. 2008). Since 2011, Nater et al. (2011) found that compared to the north of Lake Toba population, mtDNA of the Batang Toru population is more similar to Bornean orangutan.
Batang Toru forest is the last habitat units for this “rediscovered” orangutans (Meijaard 1997) in southernmost of Sumatra. The forest is divided into a western and an eastern forest block and administratively covers three districts of North Sumatra (North, Central and South Tapanuli). The Tapanuli orangutan is estimated to consist of 400 individuals in the west and 150 individuals in the east/ East Sarulla (Wich et al. 2008). This estimation is based on a preliminary survey in the western forest block, while a guesstimate was made for the eastern forest block (Singleton
et al. 2004). The first systematic survey of the orangutan population in East Batang Toru Forest Block (EBTFB) was carried out by Sumatran Orangutan Conservation Program (SOCP) – Batang Toru Program in 2008 (Fredriksson 2008).
Habitat availability in East Batang Toru is inadequate to harbour a large population of orangutan due to habitat loss and land conversion for settlement, geothermal and agriculture have caused the observed habitat loss (Onrizal & Perbatakusuma 2011). Another threat for long term survival of orangutan in Batang Toru is hunting (Wich et al. 2011). Hunting pressure has tended to be common in north-west of Batang Toru – including in East Sarulla, where human population is predominantly non-muslim (Wich et al. 2014). Combination of human population and hunting history have negative impact for orangutan population (Wich et al. 2016).
Higher number of orangutans in East Sarulla are found in Hopong. The forest in this area is relatively good with high level of food availability (Susanto
et al. 2008). Unfortunately, this area is gazetted as unprotected forest which the deforestation rate is higher than in protected forest (Gregory et al. 2012). We assumed that orangutan population trend in unprotected forest tend to be decreasing due to high potential encroachment. This study aimed at determining an updated population density of orangutan in Hopong forest. We compare the condition of Hopong forest during the first survey (2008) with the present survey (2015) to find out the population trends in this area. These data are important as the guideline and basic data to improve the protected area of Batang Toru and establish protective management measures.
METHODS
Study Site
Data Collection
The population density was measured by nest count using the line transect method following van Schaik et al. (1995). The transect design used systematic random sampling based on landsat image using Distance 5.0 and ArcGIS 9.3 (California, United States). Twelve transects were selected, each being 500 m in length and 500 m apart from each other which laid paralelly. The number and characteristics of detected nests was recorded. Recorded characteristics included: nest stage, nest position, nest height, nesting tree height, nesting tree diameter, nesting tree species, nest position from line transects and perpendicular distance (PPD). Nest stage was categorised into a four-class system: (a) fresh, some leaves still green; (b) nest is brown but remains intact; (c) leaves missing and holes appearing in nest; (d) leaves are gone, only branch structure of nest remains (van Schaik et al. 1995). Nest position was distinguished in five basic patterns which differ with respect to how the main platform is created (Prasetyo et al. 2009).
The distribution of orangutans was identified by recording the waypoint of the nest and overlaying these on a map of the study area. Threat level was estimated by measuring the distance between an encountered nest and the nearest road, settlement and agricultural area. Food availability as well as vegetation data were recorded during the survey. Food availability was recorded by measuring fruiting tree abundance and ficus density using fruit trail method (van Schaik et al.
1995). The ficus trees and the host trees of fallen fruits along the transects were recorded. The ficus were classified into two classes: Class I (ficus tree with living host), Class II (ficus tree with death host). Vegetation data was recoerded based on direct observation in the field using a sampling quadrat method. A total of 25 plots of 10 m × 10 m and 20 m × 20 m were chosen randomly. The tree’s diameter breast height in each plot was measured.
DATA ANAlySIS
Following van Schaik et al. (1995), the basic equation for calculating nest density (D) from line transect surveys is: D = N/2wL, with nest density translated into orangutan density (d) using addition parameters: d = D/p × r × t in which: D = nest density (nest/ km2), N = number of nest observed along transect, d = orangutan
density (ind/ km2), L = length of transect covered (km), p = proportion of nest
builders in the population (0.9/day, van Schaik et al. 1995), r = rate at which nests are produced (1.22/day, SOCP 2016), t = time during which a nest remains visible (501.5 days, Wich et al. 2016), w = estimated width of the strip of habitat actually censused (km). w value is obtained from perpendicular distance which analysed using the computer package DistanceTM 5.0 (Buckland et al. 1993). Besides the
The spatial distribution map of orangutan nests was created using GPS waypoints which were overlayed on a basic map using the computer package ArcGIS 9.3. Fruit abundance was calculated with the formula: d = N/L, while ficus density was calculated with the formula: d = N/2wL. Habitat quality was analysed quantitatively for density, relative density, frequency, relative frequency, dominancy, relative dominancy, species importance value (SIV), Shannon-Wiener Diversity Index, and an orangutan food list.
RESUlTS
Orangutan Distribution and Estimated Population Size
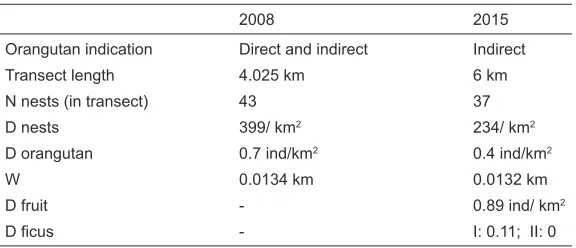
A total of 78 nests were recorded, of which 37 nests were found along a transect. This result was different from the first survey which detected orangutan directly and indirectly with 43 nests along a transects and 35 nests out of a transect (Susanto et al. 2008). Even though survey effort was improved by increasing the transects length (first survey: 4.025 km, updated survey: 6 km), number of nest encounters was less than in the first survey. This study showed a downward trend of orangutan population in Hopong. Orangutan population was declining from 0.7 ind/km2 (Susanto et al. 2008) to 0.4 ind/km2 in the past seven years. High numbers
of nests were encountered beyond the transects at the edge of a ravine. A total of 42 nesting trees were detected, some of which consisted of two and three old nests. Fruit and ficus densities relatively low during this study; the previous study did not record these densities (Table 1).
Table 1: Result of first survey (2008) and updated survey (2015).
2008 2015
Orangutan indication Direct and indirect Indirect
Transect length 4.025 km 6 km
N nests (in transect) 43 37
D nests 399/ km2 234/ km2
D orangutan 0.7 ind/km2 0.4 ind/km2
W 0.0134 km 0.0132 km
D fruit - 0.89 ind/ km2
D ficus - I: 0.11; II: 0
Threats
The nest distance to settlement, main road, and local agriculture was also changed in past seven years. The nest was found further from settlement, main road, and local agriculture, compared to nest distance in 2008. Result of Susanto et al.
(2008), the nearest nest found from settlement and main road was at 0.1 km and 0 km respectively. On the other hand, the nearest nest found from settlement, main road, and local agriculture in the survey was 1.51 km, 1.14 km and 1.45 km.
Vegetation Composition
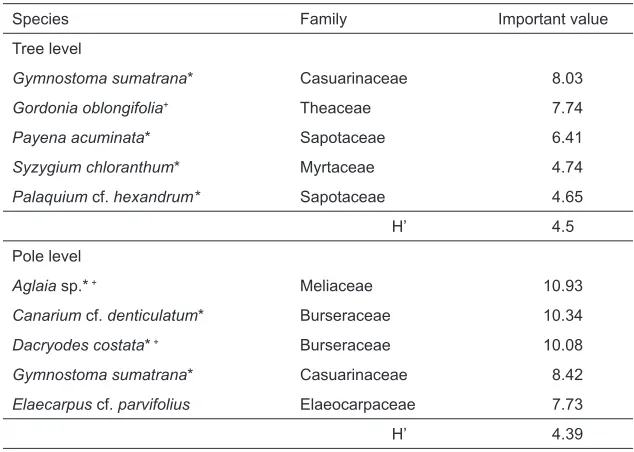
In total, 178 tree species were recorded in this study. Of these, 90 species were potential feeding trees for orangutan, and 39 species were potential nesting tree species. The species important value (SIV) were relatively low for each species (Table 2). The Shannon-Wiener diversity index of Hopong forest area is 4.6 for tree and 4.191 for pole. It means that this area was a high species richness1 of
vegetation which potentially serve food and nest tree for orangutans.Hopong forest also serve hosts trees in all diameter classes with the most abundant class at 5 cm – 9.9 cm. The distribution of class diameters showed an exponential descending L curve (Fig. 2).
Table 2: Vegetation in Hopong.
Species Family Important value
Tree level
Gymnostoma sumatrana* Casuarinaceae 8.03
Gordonia oblongifolia+ Theaceae 7.74
Payena acuminata* Sapotaceae 6.41
Syzygium chloranthum* Myrtaceae 4.74
Palaquium cf. hexandrum* Sapotaceae 4.65
H’ 4.5
Pole level
Aglaia sp.* + Meliaceae 10.93
Canarium cf. denticulatum* Burseraceae 10.34
Dacryodes costata* + Burseraceae 10.08
Gymnostoma sumatrana* Casuarinaceae 8.42 Elaecarpus cf. parvifolius Elaeocarpaceae 7.73
H’ 4.39
Figure 2: The distribution of class diameters in Hopong forests.
DISCUSSION
This study confirmed that whilst orangutan are still present in Hopong, the population has declined in the past seven years. This downward trend might be due to human encroachment towards the forest area. Human encroachment leads habitat loss that threats the long-term survival of orangutan. Like most other primate species, orangutan populations are declining over time due to habitat loss and hunting (Estrada et al. 2017).
There was significant changing of Hopong forest from 2008 to 2015. Some of the forested areas in 2008 were cleared and converted into settlement, road construction, and agriculture. Along with this, the declining of orangutan and nest encountered was occurred. It shows that orangutan leave areas with high levels of human activity and migrate to the remaining undisturbed forest in Hopong2.
Reduction of forest cover will reduce fruit availability for orangutans, which can impact the behaviour (Carne et al. 2015), in this case, orangutans migrate away from the disturbance area.
was cleared. The villagers cleared the land to establish an ownership claim to it which is indicated from the land that did not managed yet (Sugesty Muhammad Arif, personal communication). The land clearing is estimated to have occured about 1–1.5 years ago.
Hopong forest is a corridor which connects Dolok Sipirok nature reserve and EBTFB. The gazettment as unprotected forest will facilitate land conversion which could cause fragmentation and intrusion into the orangutan home ranges. If it continues like this, the population will disappear by 2030 (Wich et al. 2016).
Human-orangutan conflict in Hopong usually occured during the petai
and durian season (Iman Siagian, personal communication). Primates which live neighbouring with agriculture land raid crops when the food availability in their natural habitat is low (Strum 1994). Human-orangutan conflicts will increase as people expand their agricultural activity and encroach orangutan habitat (Campbell-Smith et al. 2010). Crop-raiding is one of the human-orangutan conflict that frequently increased caused by land conversion (Campbell-Smith et al. 2011). The villagers consider orangutan a pest species within agricultural areas. Conflict occured because some agricultural crops are overlapped with the orangutan feeding trees, such as durian, petai, palm sugar and damar.
The deep forest of Hopong is relatively good forest with natural tree cover. Although some land was cleared at the forest edge, there has been no clearence within the forest. However, we are still concern that land clearing will occur within the forest interior. Hopong forest serve various species vegetation which very important for the orangutan sustainability. The vegetation provide a food source, nesting tree and media for arboreal locomotion for orangutan. Logging will reduce the number of fruits tree which impacted to reduction of fruit availability (Johns & Johns 1995) which at the end will reduced the orangutan density (Rao & van Schaik 1997).
The density of fruit tree and ficus tree are quite low during the study. Five species of fruiting trees were identified in study area, but none of them were fleshy-pulp fruits. Fruit density is seasonal, and varies between species. Most orangutan feed on flushy-pulp fruits, the variation of fruit density influences orangutan density in the short term (Rijksen 1978). This could be one reason why orangutan were not encountered in Hopong. Few ficus trees are present in Hopong. A cluster of big strangler ficus was found away from the transects, but they were not bearing fruits during the sampling time and no orangutan nests were encountered nearby. The trend of fruit and ficus density in this area during the first survey and this study cannot be compared because there were no data for fruit and ficus density collected during the previous survey. On the other hand, the distribution of class diameters showed an exponential descending L curve which means that Hopong potentially being balanced and sustainable forest
CONClUSION
Orangutan population in unprotected forest tends to follow the downward trend. This indication was shown in the orangutan population of Hopong that has declined in the last seven years. The declining was primarily due to habitat encroachment and land conversion for settlement, road construction, and local agriculture. Hopong forest still has pristine forest that provides a suitable habitat for orangutans. The gazzetment of this forest is extremely required to reduce the threats facing the orangutan population at Hopong.
ACKNOWlEDGEMENTS
We thank Gabriella Fredriksson (SOCP-YEL Batang Toru Programme) for facilitating this study and providing the previous data, and also thank you to Matthew G Nowak for the discussion. We also thank the previous team of Wahyu Susanto, Fitriah Basalamah and Iman which carried out the first survey. Thank you to the orangutan survey team: Sugesty Muhammad Arif, Ronald Andreas Paja Siagian and Hermansyah. Thank you to Nurainas and Rezi Rahmi Amolia from Andalas University for vegetation sampling and identification. Thank you to Fitriah Basalamah and Sugesty Muhammad Arif for the discussion to improve the content of the manuscript. Thank you to Tom Squires for the review in improving the English and the content of manuscript.
NOTES
1. Based on Shannon index: H’<1: low diversity, 1<H’<3: diversity is moderate, H’>3: high diversity (Odum, 1993)
2. Based on interview with the local people, they know that orangutan is protected under the Indonesia Law. First survey also showed that local in this area did not hunting/ poaching the orangutans.
REFERENCES
Buckland S T, Anderson D R, Burnham K P and Laake J L. (1993). Distance sampling: Estimating abundance of biological populations. London: Chapman and Hall. Campbell-Smith G, Simanjorang H V, Leader-Williams N and Linkie M. (2010). Local
attitudes and perceptions towards crop-raiding by orangutans (Pongo abelii) and other non-human primates in northern Sumatra, Indonesia. American Journal of Primatology 72: 866–876. https://doi.org/10.1002/ajp.20822
Carne C, Semple S and Lehmann J. (2015). Investigating constraints on the survival of orangutans across Borneo and Sumatra. Tropical Conservation Science 8(4): 940–954. https://doi.org/10.1177/194008291500800405
Estrada A, Garber P A, Rylands A B, Roos C, Fernandez-Duque E, Di Fiore A, Nekaris K A et al. (2017). Impending extinction crisis of the world’s primates: Why primates matter. Science Advances 3: 1–16. https://doi.org/10.1126/sciadv.1600946 Fredriksson G. (2008). Orangutan and mammal surveys of the East Batang Toru Forest
Block, Tapanuli, North Sumatra, Indonesia (Unpublished report). Yayasan Ekosistem Lestari - Sumatran orang-utan Conservation Project, Medan, Indonesia. Gaveau D L A, Curran L M, Paoli G D, Carlson K M, Wells P, Besse-Rimba A, Ratnasari
D and Leader-Williams N. (2012). Examining protected area evectiveness in Sumatra: importance regulations governing unprotected land. Conservation Letters 5(2): 142–148. https://doi.org/10.1111/j.1755-263X.2012.00220.x
Gregory S D, Brook B W, Goossens B, Ancrenaz M, Alfred R, Ambu L N and Fordham D A. (2012). Long-term field data and climate-habitat models show that orangutan persistence depends on effective forest management and greenhouse gas mitigation. PLoS ONE 7(9): e43846. https://doi.org/10.1371/journal.pone.0043846 Johns A G and Johns B G. (1995). Tropical forest primates and logging: Long-term
co-existence? Oryx 29(3): 205–211. https://doi.org/10.1017/S0030605300021141 Meijaard E. (1997). A survey of some forested areas in south and central Tapanuli, North
Sumatra; New chances for orangutan conservation. Bogor, Indonesia: The International MOF Tropenbos Kalimantan Project and The Golden Ark Foundation. Nater A, Nietlisbach P, Arora N, van Schaik C P, van Noordwijk M A, Willems E P, Singleton I
et al. (2011). Sex-biased dispersal and volcanic activities shaped phylogeographic patterns of extant orangutans (genus: Pongo). Molecular Biology and Evolution 28(8): 2275–2288. https://doi.org/10.1093/molbev/msr042
Nater A, Mattle-Greminger M P, Nurcahyo A, Nowak M G, de Manuel M, Desai T, Groves C et al. (2017). Morphometric, behavioral, and genomic evidence for a new orangutan species. Current Biology 27: 1–12. https://doi.org/10.1016/j.cub.2017.09.047 Onrizal and Perbatakusuma E A. (2011). Potensi pohon sumber pakan orangutan Sumatera
untuk kegiatan rehabilitasi di Blok Barat dan Blok Timur Hutan Batang Toru, khususnya kawasan koridor orangutan Batang Toru, Sumatera Utara (Unpublished Report). Conservation International Indonesia, Medan, Indonesia.
Odum E P. (1993). Dasar-dasar ekologi. (Translated from Tjahjono Samingan). 3rd ed. Yogjakarta: Gadjah Mada University Press.
Prasetyo D, Ancrenaz M, Bernard H M, Utami-Atmoko S S, Wich S A and van Schaik C P. (2009). Nest building orangutans. In Wich S A, Utami S S U, Setia T M and van Schaik C P (eds.). Orangutans: Geographic variation in behavioral ecology and conservation. New York: Oxford University Press, 226–227.
Rao M and van Schaik C P. (1997). The behavioral ecology of Sumatran orangutans in logged and unlogged forest. Tropical Biodiversity 4(2): 173–185.
Rijksen H D. (1978). A field study of Sumatran orangutans (Pongo pygmaeus abelii, Lesson 1827). PhD dissertation, Wageningen University, the Netherlands.
Singleton I, Wich S A, Husson S, Stephens S, Utami-Atmoko S S, Leighton M, Rosen N, Traylor-Holzer K, Lacy R and Byers O. (eds). (2004). Orangutan population and habitat viability assessment: Final report. Apple Valley, MN: IUCN/SSC Conservation Breeding Specialist Group.
Susanto T W, Basalamah F and Siswanto I. (2008). Survei mamalia dan orangutan di kawasan Hutan Batang Toru Blok Timur, Sumatera Utara (Unpublished Report). Yayasan Ekosistem Lestari - Sumatran orang-utan Conservation Project, Medan (ID).
van Schaik C P, Azwar and Priatna A. (1995). Population estimates and habitat preferences of orangutans based on line transects of nests. In Nadler R D, Galdikas B M F, Sheeran L K and Rosen N. (eds.). The neglected ape. New York: Plenum Pr. Wich S A, Meijaard E, Marshall A J, Husson S, Ancrenaz M, Lacy R C, van Schaik C
P, Sugardjito J, Simorangkir T, Taylor-Holzer K et al. (2008). Distribution and conservation status of the orangutan (Pongo spp.) on Borneo and Sumatra: How many remain? Oryx 42(3): 329–339. https://doi.org/10.1017/S003060530800197X Wich S A, Fredriksson G M, Usher G, Peters H H, Priatna D, Basalamah F and Susanto
W. (2011). Hunting of Sumatran orang-utans and its importance in determining distribution and density. Biology Conservation 146: 163–169. https://doi. org/10.1016/j.biocon.2011.12.006
Wich S A, Usher G, Peters H H, Khakim M F R, Nowak M G and Fredriksson G M. (2014). Preliminary data on the highland Sumatran orangutan (Pongo abelii) of Batang Toru. In NB Grow et al. (ed.). High altitude primates, development in primatology: Progress and perspective. New York: Springer Science+Business Media, 265– 283. https://doi.org/10.1007/978-1-4614-8175-1_15