Published online July 20, 2013 (http://www.sciencepublishinggroup.com/j/sjcm) doi: 10.11648/j.sjcm.20130204.13
Prediction of postoperative lung function and chronic
dyspnea in lung cancer patients by using quantitative
computed tomography
CV Papageorgiou
1, Dimosthenis Antoniou
2, Georgios Kaltsakas
1, Foteini Karakontaki
1,
Panagiotis Misthos
3, Iris Tsangaridou
4, Loukas Thanos
4, NG Koulouris
11Respiratory Function Laboratories, National University of Athens Medical School, “Sotiria” Hospital for Chest Diseases, Athens, Greece
2Department of Respiratory Medicine, “Sotiria” Hospital for Chest Diseases, Athens, Greece
3Department of Thoracic Surgery, “Sotiria” Hospital for Chest Diseases, Athens, Greece
4Departmentof Medical Imaging and Interventional Radiology, “Sotiria” Hospital for Chest Diseases, Athens, Greece
Email address:
[email protected](CV Papageorgiou), [email protected](NG Koulouris)
To cite this article:
CV Papageorgiou, Dimosthenis Antoniou, Georgios Kaltsakas, Foteini Karakontaki, Panagiotis Misthos, Iris Tsangaridou, Loukas Thanos, NG Koulouris. Prediction of Postoperative Lung Function and Chronic Dyspnea in Lung Cancer Patients by Using Quantitative Computed Tomography. Science Journal of Clinical Medicine. Vol. 2, No. 4, 2012, pp. 134-140. doi: 10.11648/j.sjcm.20130204.13
Abstract:
Background-Aim: Prediction of postoperative FEV1 and diffusion capacity of the lung for carbon monoxide (DLCO) has a key role in the preoperative evaluation of lung resection candidates with impaired lung function. Additionally, dyspnea is a symptom which significantly affects patients’ quality of life. The aim of our study is to evaluate the role of quantitative Computed Tomography (CT) in predicting postoperative FEV1, DLCO, and chronic dyspnea in lung cancer patients undergoing lung resection. Methods: Thirty lung cancer patients were evaluated. Pulmonary function tests (PFTs) and low-dose chest CT scan were performed preoperatively. Fifteen patients (group A) had normal PFTs and fifteen patients (group B) had impaired lung function. Quantitative evaluation of CT using dual threshold of -910 to -500 Hounsfield Units estimated functional lung volumes. Dyspnea was evaluated using the modified Medical Research Council (mMRC) scale. Patients were reevaluated 3 months after surgery. Results: Predicted values of FEV1 and DLCO correlate significantly with the actual postoperative measurements in both groups. DLCO is the lung function index that demonstrates the highest correlation with postoperative dyspnea (r= -0.755, p<0.001). Predicted volume loss correlates well with the postoperative mMRC (r=0.662, p<0.001). Dyspnea score increases by one mMRC score unit per 21% of functional lung parenchyma resected during surgery. Conclusion: Quantitative CT is a valuable tool in the preoperative evaluation of lung cancer patients since it can simultaneously be used for staging, prediction of postoperative lung function, and prediction of postoperative chronic dyspnea.Keywords:
Computed Tomography, Respiratory Function Tests, Pneumonectomy1. Introduction
Lung resection is the choice of treatment in patients with early stage non-small cell lung cancer. However, most patients suffer from comorbidities that impair the cardiorespiratory reserve, leading to increased risk of perioperative and postoperative complications. According to current guidelines, lung function testing has a key role in the preoperative evaluation of lung resection candidates. Forced expiratory volume in 1 second (FEV1) and diffusing capacity
of the lung for carbon monoxide (DLCO) should be routinely measured in all patients and if both
are >80%predicted resection up to pneumonectomy can be performed. If either value is <80%predicted, further investigation with cardiopulmonary exercise testing and prediction of postoperative lung function are necessary [1].
Perfusion radionuclide lung scanning is the most widespread method to predict postoperative lung function in lung resection candidates. Predicted postoperative FEV1
(ppoFEV1) and DLCO (ppoDLCO) are estimated by
Science Journal of Clinical Medicine 2013; 2(4): 134-140 135
calculated extent can be performed. Otherwise, postoperative maximal oxygen consumption (VO2max)
should be predicted and values <10 ml/kg/min or <35%predicted indicate that standard surgery should be avoided and other treatment modalities should be chosen.
Apart from perfusion scintigraphy, several other imaging techniques have been tested in order to evaluate their capability to predict postoperative lung function. Quantitative Computed Tomography (CT) of the chest, dynamic perfusion magnetic resonance imaging (MRI), single photon emission computed tomography (SPECT), are methods under investigation [5-12]. However, a CT scan is in any case available since it is commonly required for staging. Other imaging techniques, including perfusion scintigraphy, add to the discomfort of the patient and increase the cost as they require special equipment not always available. In contrast, quantitative CT can predict postoperative lung function by processing the already available data using the system’s software. The volume of each lobe can be estimated via quantitative analysis and postoperative lung function is predicted by reducing the preoperative values by the fraction that the part to be resected contributes to the total volume of both lungs [13].
Predicted postoperative FEV1 and DLCO are the most
widely used lung function indices in order to evaluate the respiratory efficacy of lung resection candidates with impaired lung function. However, lung function tests alone cannot reflect the degree of chronic dyspnea. Lung cancer patients treated with curative surgery suffer postoperatively from a higher degree of dyspnea than the general population, especially in the presence of respiratory comorbidity [14]. Dyspnea ratings influence and predict general health status to a greater extent than do physiologic measurements [15,16]. In COPD patients, dyspnea is a better predictor of 5-year survival than airway obstruction [17]. For this reason it is useful to investigate whether quantitative CT volumetric measurements correlate with the degree of postoperative dyspnea in lung resection candidates.
The aim of our study is to investigate the role of quantitative CT in predicting postoperative FEV1, DLCO,
and the degree of chronic dyspnea in lung cancer patients undergoing lung resection.
2. Methods
2.1. Patients
Forty consecutive patients referred to our respiratory function laboratory for assessment of their respiratory reserves prior to lung resection were enrolled. All patients met the following inclusion criteria: 1) histologically confirmed non-small cell lung cancer 2) stage of disease Ia to IIb 3) low cardiological risk or with an optimized cardiological treatment 4) no other severe comorbidity that prohibits surgery. Patients were excluded if surgery was indicated for reasons other than lung cancer or if surgery was prohibited due to severe functional impairment.
All patients met the eligibility criteria and were included in the study. Pulmonary function tests (PFTs) were performed preoperatively and patients were divided into two groups. Group A had normal PFTs (FEV1 and
DLCO>80%predicted), whereas group B patients had impaired lung function (FEV1 and/or
DLCO<80%predicted), thus requiring further testing, according to current guidelines. One patient died six days after surgery due to pneumonia, two were found to be anatomically unresectable during surgery and seven patients were lost to follow up. Thirty patients were finally evaluated, 15 in group A (2 pneumonectomies, 1 bilobectomy, 11 lobectomies, 1 segmentectomy) and 15 in group B (3 pneumonectomies, 1 bilobectomy, 10 lobectomies, 1 segmentectomy). The study was approved by our institutional ethical review board and all patients gave their informed consent. Patient characteristics are summarized in table 1.
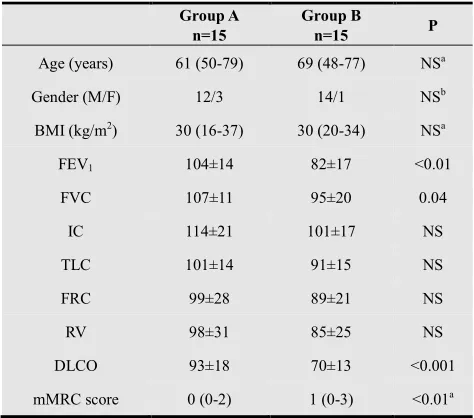
Table 1. Anthropometric characteristics, preoperative routine respiratory function data and preoperative dyspnea of the evaluated patients
Group A n=15
Group B
n=15 P
Age (years) 61 (50-79) 69 (48-77) NSa
Gender (M/F) 12/3 14/1 NSb
BMI (kg/m2) 30 (16-37) 30 (20-34) NSa
FEV1 104±14 82±17 <0.01
FVC 107±11 95±20 0.04
IC 114±21 101±17 NS
TLC 101±14 91±15 NS
FRC 99±28 89±21 NS
RV 98±31 85±25 NS
DLCO 93±18 70±13 <0.001
mMRC score 0 (0-2) 1 (0-3) <0.01a
Values are means ± SD for normally distributed data and medians (range) for not normally distributed data. Unless otherwise specified, values are expressed as % of predicted. Explanation of abbreviations: n: number of subjects; M: male; F: female; BMI: body mass index; FVC: forced vital capacity; FEV1: forced expiratory volume in one second; TLC: total lung
capacity; FRC: functional residual capacity; RV: residual volume; DLCO: diffusing capacity for carbon monoxide; mMRC: modified Medical Research Council. Statistical significance tested with Student’s t-test between group A and group B. a Mann-Whitney rank sum test was used, b
Fischer’s exact test was used. NS: Non-significant
2.2. Pulmonary Function Testing and Dyspnea Evaluation
Society/American Thoracic Society
guidelines [18,19]. Patients (group A and group B) underwent the following lung function tests: spirometry, measurement of static lung volumes and diffusing capacity. In 10 patients (5 in group A and 5 in group B) who received adjuvant chemotherapy due to disease stage IIa
efficacy of quantitative CT to predict p
was not evaluated, due to the possible negative effect of chemotherapy to diffusion capacity [20], so in these patients quantitative CT was performed in order to calculate only ppoFEV1. The patients’ degree of chronic
dyspnea was evaluated by using the modified Medical Research Council (mMRC) dyspnea scale [21] (Table
Table 2. The modified Medical Research Council (mMRC) dyspnea scale
for breathlessness during daily activities (Jones, 1999)
Grade 0 No breathlessness
Grade 1 Breathless with strenuous exercise
Grade 2 Short of breath when hurrying on the level or walking up a slight hill
Grade 3 Walk slower than people of the same age on the level or stop for breath while walking at own pace on the level
Grade 4 Stop for breath after walking about 100 yards or after a few minutes on the level
Grade 5 Too breathless to leave the house or breathless when dressing or undressing
2.3. CT analysis
All patients underwent a chest CT scan in our institution’s Somatom Emotion Unit (Siemens, Erlangen, Germany), before and after the intravenous administration of contrast medium (Iopromide; Bayer, Berlin, Germany). Scanning was performed with low-dose technique, at full inspiration from the lung apex to the diaphragm using the followi parameters: 110-130 kVp, 40 effective mAs, pitch 2 with 5mm slice width and 3mm reconstruction increment. Contrast medium was administered in order to delineate the boundaries of the tumor and the mediastinal structures for accurate staging. Images, acquired before the contrast administration, were then analyzed using the system’s software (Volume, Siemens). Lung parenchyma was isolated from the mediastinum and the chest wall and then segmented in three areas according to the attenuation of each voxel, using the dual threshold of -500 to
Units (HU). The assessment method has been described elsewhere in detail [5, 7]. Attenuation levels <
indicative of emphysema, areas >-500HU denote tumor, postobstructive atelectasis or pneumonitis, whereas areas between -500 and -910 HU correspond to functional lung parenchyma. The volume of the functional lung parenchyma of both lungs can be automatically calculated (Figure 1). Additionally, guided by the fissures between the different lobes and by delineating the region of interest (that is the boundaries of the part to be resected) in every slice with the cursor, functional lung volume of the part to be resected can be estimated (Figure 2). Postoperative lung function can be predicted by using the following formulas:
clinical practice 19]. Patients (group A and group B) llowing lung function tests: spirometry, measurement of static lung volumes and diffusing capacity. In 10 patients (5 in group A and 5 in group B) who received adjuvant chemotherapy due to disease stage IIa-IIb, the efficacy of quantitative CT to predict postoperative DLCO was not evaluated, due to the possible negative effect of chemotherapy to diffusion capacity [20], so in these patients quantitative CT was performed in order to . The patients’ degree of chronic d by using the modified Medical Research Council (mMRC) dyspnea scale [21] (Table 2).
The modified Medical Research Council (mMRC) dyspnea scale for breathlessness during daily activities (Jones, 1999)
Short of breath when hurrying on the level or walking up a
Walk slower than people of the same age on the level or stop for breath while walking at own pace on the level
breath after walking about 100 yards or after a
Too breathless to leave the house or breathless when
All patients underwent a chest CT scan in our institution’s (Siemens, Erlangen, Germany), before and after the intravenous administration of contrast medium (Iopromide; Bayer, Berlin, Germany). Scanning dose technique, at full inspiration from the lung apex to the diaphragm using the following 130 kVp, 40 effective mAs, pitch 2 with 5mm slice width and 3mm reconstruction increment. Contrast medium was administered in order to delineate the boundaries of the tumor and the mediastinal structures for uired before the contrast were then analyzed using the system’s software (Volume, Siemens). Lung parenchyma was isolated from the mediastinum and the chest wall and then areas according to the attenuation of each 500 to -910 Hounsfield Units (HU). The assessment method has been described 7]. Attenuation levels <-910HU are 500HU denote tumor, pneumonitis, whereas areas 910 HU correspond to functional lung parenchyma. The volume of the functional lung parenchyma of both lungs can be automatically calculated (Figure 1). Additionally, guided by the fissures between the different lobes and by delineating the region of interest (that is the boundaries of the part to be resected) in every slice with the cursor, functional lung volume of the part to be resected can be estimated (Figure 2). Postoperative lung function can be
by using the following formulas:
Figure 1: Quantitative CT volume estimations: (a) Chest CT scan of a patient with a tumor in the left upper lobe, (b) Quantitative analysis of functional lung parenchyma of both lungs, using the dual threshold of to -910 HU. Areas in purple correspond to voxels within these attenuation limits. Total functional lung volume of both lungs is estimated to be 3779ml.
Figure 2: Volumetric analysis of the resected lobe (same patient as in figure 1): (a) Fissure identification between left upper and lower lobe, (b) Delineation of the region of interest (limits of the lobe to be resected) with
the cursor, in all transaxial images, (c) and (d) Volumetric analysis of the left upper lobe. Regional functional lung volume is es
2.4. Procedure
All patients referred to our laboratory for preoperative assessment of lung function, underwent pulmonary function testing, dyspnea evaluation and chest CT scan with volumetric analysis within a week prior to surgery. eligible for lung resection were operated in our institution through a posterolateral thoracotomy. The postoperative course of evaluated patients was uneventful, with mean duration of hospital stay 7±2 days. Pulmonary function tests and the degree of dyspnea were reevaluated 3 months after surgery, using the same equipment. All patients were in stable condition and had no sign of recurrence or metastasis of the neoplasm.
: Quantitative CT volume estimations: (a) Chest CT scan of a patient with a tumor in the left upper lobe, (b) Quantitative analysis of functional lung parenchyma of both lungs, using the dual threshold of -500 910 HU. Areas in purple correspond to voxels within these attenuation limits. Total functional lung volume of both lungs is estimated to be 3779ml.
: Volumetric analysis of the resected lobe (same patient as in figure cation between left upper and lower lobe, (b) Delineation of the region of interest (limits of the lobe to be resected) with
the cursor, in all transaxial images, (c) and (d) Volumetric analysis of the left upper lobe. Regional functional lung volume is estimated to be 761mL
Science Journal of Clinical Medicine 2013; 2(4): 134-140 137
2.5. Statistical analysis
Normality was tested using Smirnov-Kolmogorov test. Variables are reported as mean±SD for normally distributed data and as median (range) for not normally distributed data. For comparisons between groups Student’s t-test, Mann-Whitney rank sum test and Fischer’s exact testwere used. Student’s t-test and Mann-Whitney rank sum test were used for normally and not normally distributed data respectively. Comparisons within subject were made by using Wilcoxon signed rank test. Pearson and Spearman correlation coefficients with linear regression analysis were used where appropriate. The limits of agreement between predicted values and the actual postoperative measurements were analyzed by means of Bland-Altman analysis. A p≤0.05 value was considered as significant. In previous studies, Pearson’s r between predicted and actual postoperative measurements was estimated to be 0.9 and 0.8 for FEV1 and DLCO respectively. In order to detect a
relevant correlation on a a-level of 0.05 with a power of 0.8, a sample size of 10 was calculated. To compensate for possible dropouts and be able to stratify in 2 groups (normal vs abnormal preoperative lung function), the sample size was decided to be increased up to 40. Statistical analysis was performed using SigmaStat V3.5 and SigmaPlot V10.0 statistical software (Jandel Scientific, CA, USA).
3. Results
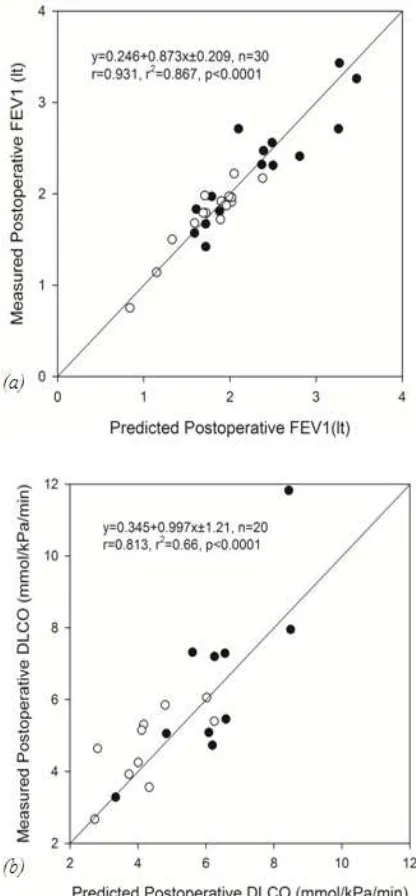
Lung volume calculations via quantitative CT in groups A and B are summarized in table 3. Significant correlations were noted in both groups, between predicted and actual postoperative measurements, both for FEV1 and DLCO
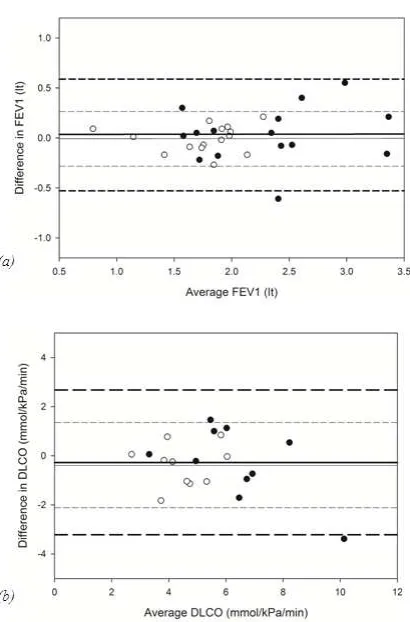
(figure 3a,b). The limits of agreement between predicted and measured values are depicted in figure 4a,b.
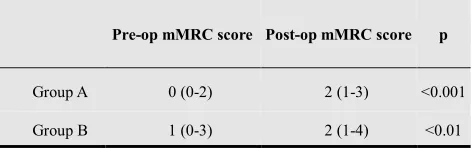
The patients’ dyspnea, as recorded using the mMRC scale, deteriorated 3 months after surgery (signed rank test, p<0.001) (Table 4). DLCO, expressed as % of the predicted value, was the lung function index that postoperatively exhibited the highest correlation with chronic dyspnea (Spearman r= -0.755, p<0.001) (Figure 5). Predicted volume loss however, is the only index that is calculated preoperatively, based on quantitative analysis of the chest CT scan. All predicted postoperative lung function values are derived based on predicted volume loss and the preoperative measurements. Predicted volume loss correlates well with postoperative dyspnea (Spearman r=0.662, p<0.001), while regression analysis indicates that dyspnea score increases by one mMRC score unit per 21% of functional lung parenchyma resected during surgery (Figure 6).
4. Discussion
The main findings of this study are that quantitative CT can predict postoperative FEV1 and DLCO in lung cancer
patients undergoing lung resection. DLCO%predicted
measured postoperatively is the lung function index with the highest correlation with the degree of postoperative dyspnea. Predicted volume loss, calculated by quantitative CT, correlates well with the degree of postoperative dyspnea, giving the opportunity to make an estimation of the patients’ postoperative disability.
Quantitative CT is a validated method to predict postoperative lung function and has already been implemented in the current guidelines of preoperative evaluation of lung resection candidates [1]. Previous studies have tested its accuracy, indicating that it outweighs the accuracy of other methods of prediction, including the widely used radionuclide lung scanning, especially in patients undergoing lobectomy. In the present study, data were analyzed with the same protocol as in previous studies, although different scanning parameters were used in order to minimize the exposure to radiation. Despite the use of low-dose technique, volumetric analysis was equally feasible and the results similarly accurate.
Quantitative CT was performed in patients with normal and impaired lung function (groups A and B respectively), in order to verify that the predicting procedure applies in both groups. Results showed that quantitative CT is an accurate predictor of postoperative FEV1 in all patients. In our study,
correlation coefficients between predicted and measured values of FEV1 were 0.897 and 0.939 for groups A and B
respectively, results which are similar to those previously reported. Focusing on group B patients, who are the target group for quantitative analysis in clinical practice due to
Table 3. Lung volume calculations via quantitative analysis of the computed tomography in the evaluated patients
Group A n=15
Group B n=15
Total functional lung volume of both
lungs (liters) 4.21±0.51 3.85±0.66
Functional lung volume of the resected
part (liters) 0.95±0.56 0.89±0.42
Predicted Volume Loss (%) 22.3±13 23.3±10
Values are means ± SD.
Table 4. Preoperative and postoperative dyspnea of the evaluated patients
Pre-op mMRC score Post-op mMRC score p
Group A 0 (0-2) 2 (1-3) <0.001
Group B 1 (0-3) 2 (1-4) <0.01
Values are medians (range). Statistical significance tested with Wilcoxon signed rank test. Pre-op: pre-operative, mMRC: modified Medical Research Council, Post-op: post-operative
-0.008±0.26 lt, an acceptable range for clinical purposes. All previous studies that investigated the role of quantitative CT in the preoperative evaluation of lung resection candidates, evaluated its efficacy in predicting postoperative FEV1. The capability to predict postoperative
DLCO was examined only in the study of Bolliger et al. and the observed correlation coefficient between predicted and measured values was 0.84 [6]. In our study, Pearson’s r between predicted and measured values of DLCO was 0.8 for group A (p=0.006) and 0.7 (p=0.02) for group B. Although both statistically significant, the correlation observed in group B patients was lower than the one noted in the study of Bolliger et al. This discrepancy may be attributed to the fact that in the previous study, preoperative DLCO values of the resection candidates were normal (105±24%predicted), while in our group B patients were not (70±13%predicted). Both studies however showed that quantitative CT is accurate in predicting postoperative DLCO. In group B patients, the limits of agreement between predicted and measured postoperative DLCO were -0.38±1.73 mmol/kPa/min, an acceptable range for clinical purposes.
The other objective of our study was to investigate the role of quantitative CT in predicting the postoperative degree of chronic dyspnea. Dyspnea has a direct impact on the patients’ quality of life, so its evaluation both preoperatively and postoperatively has a key role in the management of the patient. Results from our study showed that dyspnea deteriorates after surgery and that the larger the lung portion to be resected, the greater the degree of dyspnea three months after surgery. All patients suffered postoperatively at least by grade 1 dyspnea and the score increased by one mMRC score unit per 21% of functional lung parenchyma resected during surgery. A potential benefit from this finding is that based on quantitative analysis preoperatively and by calculating the predicted volume loss, an estimation of the patients’ postoperative dyspnea could be performed, so that the patient is properly counseled preoperatively and prepared to adjust to the decline of his postoperative respiratory capability.
Previous studies in COPD patients have shown that FEV1
does not relate to dyspnea as measured using the MRC dyspnea scale [22]. A similar finding was observed in our study of lung cancer patients undergoing lung resection. Postoperative DLCO expressed as % of the predicted value was the lung function index demonstrating the highest correlation with the postoperative degree of chronic dyspnea. The highest degree of postoperative dyspnea observed in our patients was grade 4. Dyspnea is reduced by 1 mMRC score unit per 33% of residual postoperative diffusion capacity. Current guidelines propose a limit of 30%, which according to our equation corresponds to dyspnea grade 3, an acceptable level of disability in exchange to a curative surgery.
Study limitations
A limitation of our study is that patients with severe airflow obstruction were not included. These patients
usually suffer from a greater degree of dyspnea and are at increased risk of perioperative and postoperative complications. Therefore extrapolation of our findings to these patients may be biased and further studies should focus on this subgroup of high-risk patients. An additional limitation is that patients with severe focal emphysema were not evaluated. In this
Figure 3.(a) Correlations between predicted and measured postoperative
Science Journal of Clinical Medicine 2013; 2(4): 134-140 139
Figure 4: (a) Agreement between predicted and measured postoperative values of FEV1. The limits of agreement for group A are 0.035±0.55 lt (thick lines) and -0.008±0.26 lt for group B (thin lines). (b): Agreement between predicted and measured postoperative values of DLCO. The limits of agreement for group A are -0.28±2.96 mmol/kPa/min (thick lines) and -0.38±1.73 mmol/kPa/min for group B (thin lines). (●): Group A
(○): Group B. DLCO: Diffusion lung capacity for carbon monoxide
Figure 5: Relationship of postoperative DLCO, expressed as % of the predicted value, with postoperative mMRC dyspnea score (Pearson: r= -0.715, p<0.001). Solid line: linear regression. Linear regression equation and corresponding Pearson’s correlation coefficient are shown. The slope of the line indicates that the dyspnea score decreases, on average, by one mMRC score unit per ≈33% of residual postoperative diffusion lung capacity. DLCO: Diffusion lung capacity for carbon monoxide
Figure 6:Relationship of % volume loss during surgery with postoperative
mMRC dyspnea score (Pearson: r= 0.59, p<0.001). Solid line: linear regression. Linear regression equation and corresponding Pearson’s correlation coefficient are shown. The slope of the line indicates that the dyspnea score increases, on average, by one mMRC score unit per ≈21% of functional lung parenchyma resected during surgery
group of patients, lung resection could possibly improve the degree of dyspnea, an improvement similar to that obtained with lung volume reduction surgery. The potential beneficial effects on elastic recoil and chest wall mechanics could improve these patients, so further studies should focus on this subgroup, in order to clarify whether quantitative CT has the ability to predict the postoperative degree of dyspnea. Finally, cardiopulmonary exercise testing was not performed in our study population, so it was not feasible to investigate the relation of VO2max with the postoperative degree of
chronic dyspnea.
5. Conclusion
Our findings confirmed previously reported data, that quantitative CT can predict postoperative FEV1 and DLCO
in lung resection candidates, both with normal and impaired preoperative lung function. Additionally, we showed that quantitative CT can estimate postoperative dyspnea, providing patients an understanding of the potential surgery outcome. Further studies should focus on patients with severe obstruction and severe emphysema. Quantitative CT appears to be a valuable tool in the preoperative evaluation of lung resection candidates, since it can simultaneously be used for staging, prediction of postoperative lung function and prediction of the postoperative degree of dyspnea.
Acknowledgements
The study was partly supported by the National University of Athens and Greek NHS.
References
Respiratory Society and European Society of Thoracic Surgeons joint task force on fitness for radical therapy. ERS/ESTS clinical guidelines on fitness for radical therapy in lung cancer patients (surgery and chemo-radiotherapy). Eur Respir J 2009; 34: 17-41
[2] Markos J, Mullan BP, Hillman DR, Musk AW, Antico VF, Lovegrove FT, Carter MJ, Finucane KE. Preoperative assessment as a predictor of mortality and morbidity after lung resection. Am Rev Respir Dis 1989; 139: 902–910
[3] Bolliger CT, Wyser C, Roser H, Solèr M and Perruchoud AP. Lung scanning and exercise testing for the prediction of postoperative performance in lung resection candidates at increased risk for complications. Chest 1995; 108: 341–348
[4] Giordano A, Calcagni ML, Meduri G, Valente S, Galli G. Perfusion lung scintigraphy for the prediction of postlobectomy residual pulmonary function. Chest 1997; 111: 1542-47
[5] Wu MT, Chang JM, Chiang AA, Lu JY, Hsu HK, Hsu WH, Yang CF. Use of quantitative CT to predict post-operative lung function in patients with lung cancer. Radiology 1994; 191: 257-262
[6] Bolliger CT, Guckel C, Engel H, Stohr S, Wyser CP, Schoetzau A, Habicht J, Soler M, Tamm M, Perruchoud AP. Prediction of functional reserves after lung resection: comparison between quantitative computed tomography, scintigraphy and anatomy. Respiration 2002; 69: 482-489
[7] Wu MT, Pan HB, Chiang A, Hsu HK, Chang HC, Peng NJ, Lai PH, Liang HL, Yang CF. Prediction of postoperative lung function in patients with lung cancer: comparison of quantitative CT with perfusion scintigraphy. AJR Am J Roentgenol 2002; 178: 667-672
[8] Sverzellati N, Chetta A, Calabrò E, Carbognani P, Internullo E, Olivieri D, Zompatori M. Reliability of quantitative computed tomography to predict postoperative lung function in patients with chronic obstructive pulmonary disease having a lobectomy. J Comput Assist Tomogr 2005; 29: 819-824
[9] Ohno Y, Koyama H, Nogami M, Takenaka D, Matsumoto S, Yoshimura M, Kotani Y, Sugimura K. Postoperative lung function in lung cancer patients: comparative analysis of predictive capability of MRI, CT and SPECT. AJR Am J Roentgenol 2007; 189: 400-408
[10] Ueda K, Tanaka T, Li TS, Tanaka N, Hamano K. Quantitative computed tomography for the prediction of pulmonary function after lung cancer surgery: a simple method using simulation software. Eur J Cardiothorac Surg 2009; 35: 414-418
[11] Yoshimoto K, Nomori H, Mori T, Kobayashi H, Ohba Y, Shibata H, Shiraishi S, Kobayashi T. Prediction of pulmonary function after lung lobectomy by subsegments counting, computed tomography, single photon emission computed tomography and computed tomography: a comparative study. Eur J Cardiothorac Surg 2009; 35: 408-413
[12] Ohno Y, Koyama H, Nogami M, Takenaka D, Onishi Y, Matsumoto K, Matsumoto S, Maniwa Y, Yoshimura M, Nishimura Y, Sugimura K. State-of-the-art radiological techniques improve the assessment of postoperative lung function in patients with non-small cell lung cancer. Eur J Radiol 2011; 77: 97-104
[13] Papageorgiou CV, Antoniou D, Kaltsakas G, Koulouris NG. Role of quantitative CT in predicting postoperative FEV1 and chronic dyspnea in patients undergoing lung resection. Multidiscip Respir Med 2010; 5:188-193
[14] Yun YH, Kim YA, Min YH, Chang YJ, Lee J, Kim MS, Lee HS, Kim J, Choi YS, Shim YM, Zo JI. Health-related quality of life in disease-free survivors of surgically treated lung cancer compared with the general population. Ann Surg 2012; 255:1000-1007
[15] Mahler DA, Faryniarz K, Tomlinson D, Colice GL, Robins AG, Olmstead EM, O’Connor GT. Impact of dyspnea and physiologic function on general health status in patients with chronic obstructive pulmonary disease. Chest 1992; 102: 395-401
[16] Stavem K, Boe J, Erikssen J. Health status, dyspnea, lung function and exercise capacity in patients with chronic obstructive pulmonary disease. Int J Tuberc Lung Dis 1999; 3: 920-926
[17] Nishimura K, Izumi T, Tsukino M, Oga T. Dyspnea is a better predictor of 5-year survival than airway obstruction in patients with COPD. Chest 2002; 121: 1434-1440
[18] MacIntyre N, Crapo RO, Viegi G, Johnson DC, van der Grinten CP, Brusasco V, Burgos F, Casaburi R, Coates A, Enright P, Gustafsson P, Hankinson J, Jensen R, McKay R, Miller MR, Navayas D, Pedersen OF, Pellegrino R, Wanger J. Standardisation of the single-breath determination of carbon monoxide uptake in the lung. Eur Respir J 2005; 26: 720-735
[19] Miller MR, Hankinson J, Brusasco V, Burgos F, Casaburi R, Coates A, Crapo R, Enright P, van der Grinten CPM, Gustafsson P, Jensen R, Johnson DC, MacIntyre N, McKay R, Navayas D, Pedersen OF, Pellegrino R, Viegi G, Wanger J; ATS/ERS Task Force. Standardisation of spirometry. Eur Respir J 2005; 26: 319-338
[20] Leo F, Solli P, Spaggiari L, Veronesi G, de Braud F, Leon ME, Pastorino U. Respiratory function changes after chemotherapy: an additional risk for postoperative respiratory complications? Ann Thorac Surg 2004;77:260-265
[21] Jones PW. Measurement of breathlessness. In: Lung Function Tests: Physiological Principles and Clinical Applications
(eds. Hughes JMB, Pride NB) 1999; 1st edn, p. 121. Saunders, London