A new Method for Optimizing Energy Efficiency of
Embedded Systems
Akbar Bemana
Abstract— Several studies have shown that about 40% or more of the energy consumption on embedded systems that are based on microprocessor relates to cache. In technology with micrometer scaling, dynamic power was the primary contributor to total power dissipation of a CMOS design, but in technology with nanometer scaling, the share of leakage power in total Power consumption of energy continues to grow.
In this paper we concentrate on the selection of optimal cache size for low energy consumption embedded systems. Our study is based on three different technologies on embedded systems. Results show that cache size should change for minimizing energy consumption in different technologies due to the increase of leakage power and decrease of dynamic energy as technology is shrinking. Our studies reveal that cache size changes depend on the rate at which cache miss increases when reducing the cache size. Our experiments show that through technology-aware cache configuration selection, we can reduce the energy consumption by 54% in average and maximum 75%.
Keywords— Embedded Systems; Cache Memory; Leakage Power; Dynamic Energy; Nanometer Technology.
————————————————————
1. INTRODUCTION
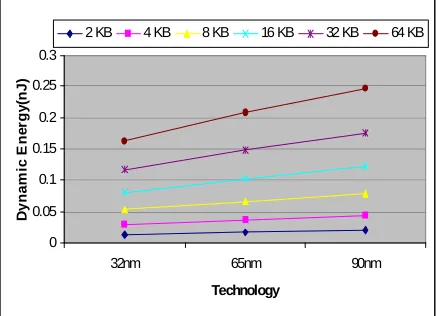
As the Technology is becoming finer, leakage power is becoming the dominant contributor to the power consumption of CMOS integrated circuits. Unlike dynamic power, which depends on the activity in the circuit, leakage power exists as long as power supply is applied to the circuit even if there is no activity. Consequently, in general, bigger circuits dissipate higher leakage. Figures 1 and 2 show leakage power and consumption of dynamic energy in three different technologies (90nm, 65nm and 32nm) for cache memories with different sizes. The data were obtained using CACTI tool [1] for estimating the power of caches. The diagrams obviously specify that leakage and dynamic powers are changing their roles, since that dynamic power reduces in new technologies while leakage power is increasing.
0 0.05 0.1 0.15 0.2 0.25 0.3
32nm 65nm 90nm
Technology
D
y
n
a
m
ic
E
n
e
rg
y
(n
J
)
2 KB 4 KB 8 KB 16 KB 32 KB 64 KB
Figure 1. Dynamic energy for different cache sizes
0 0.05 0.1 0.15 0.2 0.25 0.3 0.35
32nm 65nm 90nm
Technology
L
e
a
k
a
g
e
P
o
w
e
r(
m
W
)
2 KB 4 KB 8 KB 16 KB 32 KB 64 KB
Figure 2. Leakage power for different cache sizes
For instance, dynamic energy in 90 nanometer technology consumes 1.3 times more than the 65 nanometer technology and 1.7 (times more than) 32 nanometer technology. However, static energy in 32 nanometer technology consumes about 12 times more than 90 nanometer technology and 3 times more than 65 nanometer technology. Energy consumption is an important issue for battery powered embedded systems. On-chip cache consumes almost half of a microprocessor’s total energy [2], [3]. Energy efficient cache
architecture design is thus a critical issue in the design of processor-based embedded systems. The impact of cache parameter such as cache size, ways, line size on energy and cache performance has been shown in [2], [4], [5]. Since off-chip memory access is costly in terms of power consumption as well as performance, a taken-for-granted remedy is to use a larger cache; this may reduce off-chip access for some programs, but comes at the expense of an increasingly higher power to hold the data (static power) in nanometer technologies. Performance-critical applications may not care this additional power, but energy-critical applications (especially battery-powered ones) need a cache size balancing the energy savings from higher hit ratio with the energy increase from more leakage. We show in this paper __________________
Akbar Bemana Islamic Azad University
73 The impact of cache parameters such as cache size, number
of ways and line size on energy and performance has been shown in [2], [4], [5]. Also appropriate cache size selection for reliability of optimal energy consumption and improved performance has been investigated [6]. The focus of this paper is mainly to study the effects of technology changes on the cache size selection for minimal energy consumption. We show that when the technology changes, a new cache size may need to be selected due to the increase of leakage current and the reduction of dynamic energy, if minimum energy consumption is a must. This paper includes the follow sections: In the second section we discuss our energy evaluation model and calculating dynamic and static energy. Experiment results are studied in third section and ultimately we will have conclusion.
2. PROBLEM FORMULATIONS
At first the energy evaluation model (formulation) will be explained and then define the problem.
A. Energy evaluation
The power consumption of CMOS circuits includes dynamic, static, and short circuit power. The short circuit power consumption is much smaller than dynamic and static power, and is negligible. Dynamic power consumes during the time, transistors are activating and signal transition changes from zero to one and conversely, while static energy is due to the total amount of leakage current through inactive or OFF transistors. Energy equals power times time. The dynamic energy consumed per access is a sum of the energy spent on searching within the cache, an extra energy required for handling the writes and energy consumed by block replacement on cache miss. Dynamic energy has the most energy consumption in micrometer scale technologies, but static energy dissipation will contribute an increasingly larger portion of total energy dissipation in nanometer scale technologies. We consider both types of energies. Another important factor in measuring the energy consumption is accessing the off-chip memory. Fetching instructions and data from off-chip memory is energy expensive because of the high off-chip capacitance and large off-chip memory storage. Additionally, when accessing the off-chip memory, the processor may stall while waiting for the instruction and/or data, and such waiting still consumes some energy. Thus, we calculate the total energy due to memory accesses using Equation 1. In our evaluation the energy is a function of size of cache (S) and technology (T). Other parameters assumed to be constant [8].
energy_memory (S,T) = energy_dynamic (S,T)
+ energy_static (S,T) (1)
energy_dynamic (S,T) = cache_access (S) * energy_cache_access (S,T) + cache_ misses (S) * energy_miss (S,T)
(2)
energy_miss (S,T) = energy_off_chip_access + energy_uP_stall (T) + energy_cache_block_refill (S,T)
(3)
energy_static (S,T) = executed_clock_cycles (S)
* clock_period * leakage_power (S,T) (4)
In this paper, cache_access, cache_misses and
executed_clock_cycles are computed by running
SimpleScalar[9] for applications with desired cache configuration.
Energy_cache_access, energy_cache_block_refill, and
leakage_power are energy for accessing the cache, cache
block refilling after a cache miss and leakage power of a given cache, respectively, which are computed using CACTI. The energy_off_chip_access is the energy of accessing off-chip memory when there is a miss, and the energy_uP_stall is the energy consumed when the processor is stalled waiting for the memory system that should be taken from main memory (off-chip memory). According to the explanations and experiments done in [2], we assumed:
B. Problem Definition
In our study, we assume that the cache organization (for both instruction and data cache), the embedded application in our experiment [10] and the processor used are all constant (invariant) and only the target technology and total size of cache is changing. This reflects a scenario where a processor with different technology is used for embedded systems. So in our experiments, the optimization problem is defined as follows:
“Find the cache size that result in minimum energy
consumption (Equation 3 for a given technology) over the entire application run for a given application, processor architecture, technology.”
3. EXPERIMENTAL RESULTS
We use applications from Mibench [10] benchmark suite. As mentioned, SimpleScalar [9] and CACTI are used as our simulation tool and power modeling tool, respectively. The cache hit is assumed to take one clock cycle and cache miss 100 cycles. The clock frequency of the single-issue base processor is assumed to be 200 MHz. Our experiments are done for 90nm, 65nm, 32nm technologies.
A. The Effects of technology on the Instruction Cache
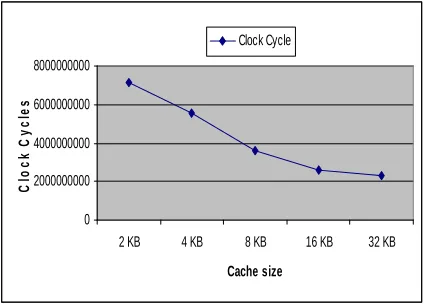
Fig. 3 shows the number of execution clock cycles for Lame for different instruction cache sizes when the size of data cache is fixed.
(The instruction cache have line size=16 and set associativity=2.)
0 2000000000 4000000000 6000000000 8000000000 10000000000 12000000000 14000000000
2 KB 4 KB 8 KB 16 KB 32 KB
Cache Size
C
lo
c
k
C
y
c
le
s
Clock Cycle
Figure 3. Clock cycles for Instruction cache (Lame)
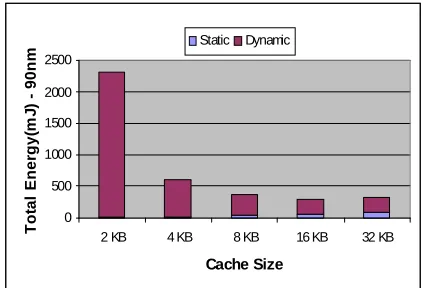
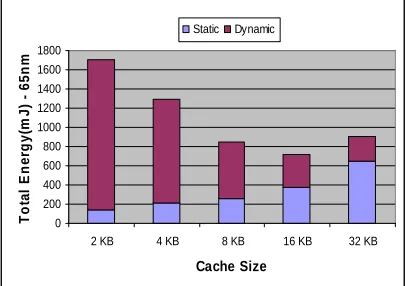
When the cache becomes smaller the execution time increases, due to increased misses. Fig 4, 5 and 6 shows the dynamic energy and static energy for three different technologies for lame application. According to these three diagrams and Fig. 3 as the number of misses increase the dynamic energy grows up. However, as the technology is becoming finer the static energy is increasing. As the cache size decreases we expect the reduction of the static energy similar to what happens for 32KB, 16KB, 8KB and 4KB. However, for 2KB we see an increase in static energy. The reason can be understood by looking at Fig. 3. From this figure we learn that for 2KB the number of misses increases sharply and consequently the execution time increases (Equation 4). A big increase in execution time causes a big increase in static energy. These figures depict that for each technology there are different points for optimal cache sizes (minimal point) which are 16KB for 90nm technology, 8KB for 65nm technology and 4KB for 32nm technology. For 90 nm technology, dynamic energy has an important role in total energy, due to the smaller effect of static energy than dynamic energy.
0 500 1000 1500 2000 2500
2 KB 4 KB 8 KB 16 KB 32 KB
Cache Size
T
o
ta
l
E
n
e
rg
y
(m
J
)
-
9
0
n
m
Static Dynamic
Figure 4. Total energy – 90nm – Lame - Instruction cache
0 500 1000 1500 2000 2500 3000
2 KB 4 KB 8 KB 16 KB 32 KB
Cache Size
T
o
ta
l
E
n
e
rg
y
(m
J
)
-
6
5
n
m
Static Dynamic
Figure 5. Total energy – 65nm – Lame - Instruction cache
0 500 1000 1500 2000 2500 3000 3500
2 KB 4 KB 8 KB 16 KB 32 KB
Cache Size
T
o
ta
l
E
n
e
rg
y
(m
J
)
-
3
2
n
m
Static Dynamic
Figure 6. Total energy – 32nm – Lame - Instruction cache
75
saving illustrates the percentage of saved energy obtained by
resizing the cache to the new optimal size at new technology (65nm or 32nm) compared to the energy of the cache with minimum energy at 90nm now operating at new technology (65nm or 32nm). The energy saving is calculated using Equation 6 below. In this equation, the
energy_cache90_NTech is the energy consumption of the
cache configuration with minimum energy consumption for 90nm when the technology is 65nm or 32nm; the
energy_cacheNTech is the energy of the cache configuration
with minimum energy for technology 65nm or 32nm.
Energy Saving =
NTech cache
energy
cacheNTech energy
NTech cache
energy
_ 90 _
_ _
90
_ * 100
(6)
The performance penalty is the percentage of increase in execution time when the cache is resized for the lowest energy. The performance penalty is calculated using the following equation (Equation 7):
Performance Penalty =
90 _ _
90 _ _ _
_
cache time exec
cache time exec cacheNTech time
exec * 100
(7)
where the exec_time_cache90 is the execution time of cache with minimum energy for 90nm and exec_time_cacheNTech is the execution time of cache with minimum energy for 65nm or 32nm.
The minimum-energy caches for 65nm (16KB) and 32nm (8KB) technologies respectively consume 5.45% and 13.25% less energy compared to the minimum-energy cache of 90nm process (i.e. 32KB). The corresponding performance penalty is only 6.84% and 17.43% respectively.
Table 1 illustrates that the most improvement in energy saving in 65nm technology equals 28.86% while in 32nm technology it is 49%.
B. The effects of technology on the data cache
We examined the Lame application for the 2-way set-associative with 16 bytes line size data. It is assumed that instruction cache size is fixed. Fig.7 depicts number of execution clock cycles for data cache with different (various) sizes.
0 2000000000 4000000000 6000000000 8000000000
2 KB 4 KB 8 KB 16 KB 32 KB
Cache size
C
lo
c
k
C
y
c
le
s
Clock Cycle
Figure 7. Clock cycles for Data cache (Lame)
Also Fig.8, 9 and 10 show the total energy consumption for the different data cache in three different technologies. As in Fig.4, 5 and 6 in which the curves of dynamic energy are similar to the curve in Fig.3 (number of executed clock cycles), the curve of dynamic energy in Fig.8, 9 and 10 are also similar to the curve of Fig.7. However, we do not see similar changes in static energy of data cache as we see for instruction cache. Comparing Fig.3 and Fig.7 shows that changes in instruction cache size affects execution time (clock cycles) in Lame application much more than changes in data cache size. The execution time varies from 2.7 milliard to 12.5 milliard clock cycles (4.5 times increase) for different instruction cache size while for different data cache size it ranges from 2.3 milliard to 7.1 milliard cycles (3 times increase). These big differences in execution time for different instruction cache sizes highly impact the static energy, unlike data cache. (Equation 4) According to the results 32K, 16K and 8K are minimum-energy data cache sizes for 90nm, 65nm and 32nm, respectively. In 32nm, the total energy for big caches is dominated by static energy and for small caches the contribution of dynamic energy becomes more. In 32nm technology with larger caches, static energy is dominating however, for small caches, dynamic energy has more influence.
0 200 400 600 800 1000 1200 1400 1600 1800
2 KB 4 KB 8 KB 16 KB 32 KB
Cache Size
T
o
ta
l
E
n
e
rg
y
(m
J
)
-
9
0
n
m
Static Dynamic
0 200 400 600 800 1000 1200 1400 1600 1800
2 KB 4 KB 8 KB 16 KB 32 KB
Cache Size
T
o
ta
l
E
n
e
rg
y
(m
J
)
-
6
5
n
m
Static Dynamic
Figure 9. Total energy – 65nm – Lame - Data cache
0 500 1000 1500 2000 2500 3000
2 KB 4 KB 8 KB 16 KB 32 KB
Cache Size
T
o
ta
l
E
n
e
rg
y
(m
J
)
-
3
2
n
m
Static Dynamic
Figure 10. Total energy – 32nm – Lame - Data cache
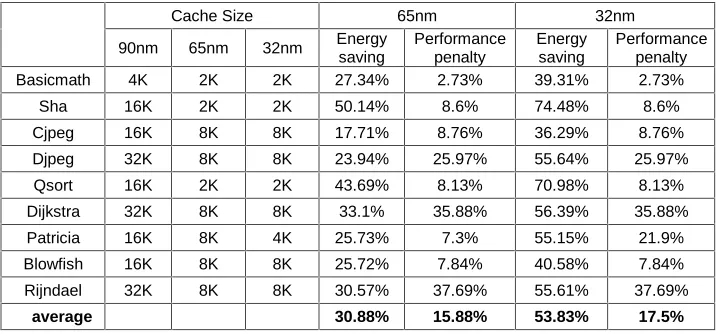
(The curve of total energy for large caches is similar to curve of static energy and for small caches it is getting similar to the curve of dynamic energy.) By changing technology from 90nm into 65nm and using 16KB cache instead of 32KB the energy consumption decreases by 21%. Also by moving from 90nm technology to 32nm and using 8KB cache instead of 32KB the energy consumption degrades by about 44%. Naturally, performance penalty respectively in technology changes from 90nm into 65nm is equal to 13% and while technology changes from 90nm into 32nm will be 53%. As what we did for instruction cache, we select some of programs on Mibench and repeat experiments on them (Table 2). According to Table2 we conclude that for data cache with 65nm technology compared in regard to 90nm, and using technology-aware cache size selection with the lowest energy consumption, in average we have 30.88% improvement in total energy consumption and about 15.88% performance penalty. Also when technology changes from 90nm to 32nm, we see 53.83% reduction on energy consumption and 17.5% performance reduction. Table 2 reveals most improvement in the decrease of energy consumption for 65nm technology compared to 90nm, equals 50.14% while the energy consumption reduction is 74.48% for 32nm technology compared to 90nm. The results of table 1 and 2 and the results of running the Lame application illustrates that improvement on energy consumption in data cache is more than instruction cache because accessing to instruction cache is more than data cache.
CONCLUSION
In this paper we studied the effects of different nanometer technologies as yet another factor affecting cache size for different applications targeting low energy embedded computing systems. The results show that the need of optimal cache size selection for embedded system with new technology that is because of the increase in static power. In all cases the optimal cache size reduces in lower technology, although it increases misses and clock cycle time. the results of our experiments show that with assuming technology (in our experiment we studied 90nm, 65nm, 32nm technologies) with minimum energy consumption, we can reduce power consumption for data cache in average 54% and maximally 75% and for instruction cache averagely 18% and maximally 70%. The results of our study showed the need to either reanalyze the embedded systems for tuning the cache size or employ a configurable cache to be tunable based on the process technology requirements in addition to other factors affecting optimal cache size.
R
EFERENCES[1] D. Tarjan, Sh. Thoziyoor, N. P. Jouppi, Cacti 5.0, HP Laboratories, Technical Report, 2007.
[2] C. Zhang, F. Vahid, and W. Najjar, “A Highly Configurable Cache Architecture for Embedded Systems,”
ACM Transactions on Embedded Computing Systems, Vol. 4, No. 2, May 2005.
[3] V.G. Moshnyaga, K. Inoue, “Low-Power Cache
Design,” in Low-Power Electronics Design, C. Piguet Eds.,
CRC Press, 2005.
[4] D. H. Albonesi, “Selective cache ways: On-demand
cache resource allocation,” 32nd Annual ACM/IEEE International Symposium on Microarchitecture, 1999. [5] C. Zhang, F. Vahid and R. Lysecky, “A self-Tuning
Cache Architecture for Embedded Systems”, in Proc. of DATE, 2004.
[6] Y. Cai, M. T. Schmitz, A. Ejlali, B. M. Al-Hashimi, and S. M. Reddy, “Cache Size Selection for Performance,
Energy and Reliability of Time-Constrained Systems”, ASP-DAC 2006.
[7] K. Inoue, T. Ishihara, and K. Murakami, “
Way-predictive set-associative cache for high performance and low energy consumption,” International Symposium on Low Power Electronic Design, 1999.
[8] H. Noori, M. Goudarzi, K. Inoue, and K. Murakami, "The Effect of Nanometer-Scale Technologies on the Cache Size Selection for Low Energy Embedded Systems," International Conference on Embedded Systems & Applications, 2007.
77 Table 1. The results of other applications for instruction cache with Line Size=16 & Set Associative=2
Cache Size 65nm 32nm
90nm 65nm 32nm Energy saving
Performance penalty
Energy saving
Performance penalty
Basicmath 32K 16K 16K 8.75% 32.47% 25.97% 32.47%
Sha 2K 2K 2K 0.0% 0.0% 0.0% 0.0%
Cjpeg 8K 8K 8K 0.0% 0.0% 0.0% 0.0%
Djpeg 16K 8K 8K 11.48% 19.57% 31.52% 11.48%
Qsort 32K 32K 32K 0.0% 0.0% 0.0% 0.0%
Dijkstra 16K 8K 2K 28.86% 9.51% 49.1% 69.86%
Patricia 32K 32K 32K 0.0% 0.0% 0.0% 0.0%
Blowfish 16K 16K 8K 0.0% 0.0% 12.64% 43.1%
Rijndael 32K 32K 32K 0.0% 0.0% 0.0% 0.0%
average 5.45% 6.84% 13.25% 17.43%
Table 2. The results of other applications for data cache with Line Size=16 & Set Associative=2
Cache Size 65nm 32nm
90nm 65nm 32nm Energy saving
Performance penalty
Energy saving
Performance penalty
Basicmath 4K 2K 2K 27.34% 2.73% 39.31% 2.73%
Sha 16K 2K 2K 50.14% 8.6% 74.48% 8.6%
Cjpeg 16K 8K 8K 17.71% 8.76% 36.29% 8.76%
Djpeg 32K 8K 8K 23.94% 25.97% 55.64% 25.97%
Qsort 16K 2K 2K 43.69% 8.13% 70.98% 8.13%
Dijkstra 32K 8K 8K 33.1% 35.88% 56.39% 35.88%
Patricia 16K 8K 4K 25.73% 7.3% 55.15% 21.9%
Blowfish 16K 8K 8K 25.72% 7.84% 40.58% 7.84%
Rijndael 32K 8K 8K 30.57% 37.69% 55.61% 37.69%