The Determinants And Structural Change
Of FDI In China – A Study Based On
City-Level Panel Data
Yu Liang, Tsinghua University, ChinaABSTRACT
As one of the important developing countries, China has experienced a tremendous amount of economic growth in the past 30 years. This in turn has attracted a huge amount of foreign direct investment (FDI) into the country. However, according to past literature, FDI location is imbalanced in China. Building upon this finding, this paper attempts to identify factors affecting the location determinants of FDI in China. By introducing “spatial variable” into the analysis, this paper measures the agglomeration effect of a city level data. The results show that the spatial variable (market potential factor), plays a significant role in FDI flows. Also I find that previous FDI flow, market potential factor, infrastructure construction, government preferential policies and coastal location can attract FDI flow, while higher wages and education level effects are not clear. By separating the data into two sub-sample periods (1996-2002 and 2003-2008), I find that in response to the transformation of the economic situation, foreign investors shift their investment direction into regions with high education and high income level. This observation is different from previous studies. This study provides deeper perspective on the factors that attract FDI flows to China, and how the transformation of the economic environment changes the direction of FDI flows.
Keywords: Foreign Direct Investment; Location Choice; China, Spatial Econometrics
1. INTRODUCTION
oreign directly investment (FDI) has been one of the most researched areas in the field of economic globalization. The flow of FDI into a country can result in significant economic development and increase in productivity. Furthermore, it can also speed up the integration of a nation's economies into the global market. Countries such as South Korea and Japan have used FDI to stimulate the transformation of technology and, thus, speed up the advancement of scientific and managerial capabilities. China has also adopted this method to promote its economic growth, which can accelerate its transition from planned to market economy, and improve its market efficiency.
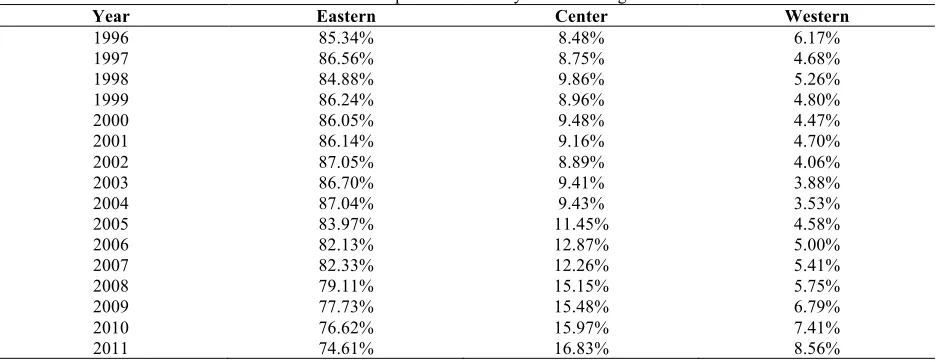
Currently, China is the largest recipient of FDI among developing countries and the second largest in the world, only after the United States. Figure 1 describes the change in FDI flowing into China form 1980 to 2011. As we can see from the figure, there are two clearly distinct periods during this period. A relatively inactive period before the early nineties and an active period beginning in early nineties are characterized by a rapid increase in the amount of FDI. Figure 2 shows the distribution of location in China the FDI is going to. As it clearly shows, the distribution is extremely unbalanced. From 1996 to 2000, on average, 87.80% of FDI flows in China are located in eastern coast cities. In 2001, the Central government implemented policies aim at attracting foreign investment to the central and western cities. Although these policies are efficient, the FDI going to eastern China only dropped to 74.61% in 2011 (Table 1). This research explores this phenomenon and looks into the factors that affect the location choices of FDI in China.
Figure 1. FDI Trend in China from 1980 to 2011
Source:China Statistical Yearbook by China's National Bureau of Statistics
Figure 2. The Proportion of FDI by Different Regions
Source:China Statistical Yearbook by China's National Bureau of Statistics
A city level panel data consisting of 45 Chinese cities is used to identify important factors that attract FDI to specific regions. Different from some of the previous researches, this paper incorporated a spatial variable into the model used to measure the agglomeration effect affecting FDI. Focusing on the geographic distribution of FDI activities at the city level in China, this research fills a gap in the literature. This paper also analyzed the structural
0 200 400 600 800 1000 1200 1400
1980 1982 1984 1986 1988 1990 1992 1994 1996 1998 2000 2002 2004 2006 2008 2010
FDI in 100 Millions $
0%
10%
20%
30%
40%
50%
60%
70%
80%
90%
100%
change of the FDI flow characteristics in two periods (from 1996 to 2002 and from 2003 to 2008). The paper is organized as follows. Section 2 provides a brief overview of the history FDI in China and summarizes relevant literatures. Section 3 describes the data sources and variables used in this analysis. Section 4 presents the empirical results and discusses the findings. Finally section 5 concludes with a brief discussion on the geographic distribution of FDI activities at the city level in China.
Table 1. The Proportion of FDI by Different Regions
Year Eastern Center Western
1996 85.34% 8.48% 6.17%
1997 86.56% 8.75% 4.68%
1998 84.88% 9.86% 5.26%
1999 86.24% 8.96% 4.80%
2000 86.05% 9.48% 4.47%
2001 86.14% 9.16% 4.70%
2002 87.05% 8.89% 4.06%
2003 86.70% 9.41% 3.88%
2004 87.04% 9.43% 3.53%
2005 83.97% 11.45% 4.58%
2006 82.13% 12.87% 5.00%
2007 82.33% 12.26% 5.41%
2008 79.11% 15.15% 5.75%
2009 77.73% 15.48% 6.79%
2010 76.62% 15.97% 7.41%
2011 74.61% 16.83% 8.56%
Source: China Statistical Yearbook by China's National Bureau of Statistics
2. BACKGROUND AND LITERATURE REVIEW
2.1 FDI in China
From 1949 to 1978, China's economy was virtually closed to the outside economy, as a result there was minimal foreign investments into China. This policy of closed economy continued up until 1978 when Chinese leaders realized the negative impact of the policy and began to open its markets. The new policy resulted in an increase in the amount of FDI flowing into the country. In 1979, the Chinese government passed the Law of the People’s Republic of China on Joint Ventures using Chinese and Foreign Investment, which granted FDI legal status in China. From then on, the development of foreign investments in China can be divided to three stages.
The First stage stretched from 1979 to 1991. The initial period of this stage is characterized by the lack of precedent, and is coupled with an uncertain political climate and other unfavorable factors which altogether hindered attracting FDI (Coughlin and Segev, 2000). This is evident by the amount of FDI flowing into China which totaled less than $200 million in 1980 (Figure 1). Even before 1984, the FDI in China is still very limited.
In order to increase investor confidence and attract foreign investment, the Chinese government in 1986 launched a series of preferential policies aimed at creating a more favorable investment environment. One of the most important preferential policies is the reduction in fees on land use, taxes and cost of inputs. The wages paid by foreign-funded enterprises were also reduced. During this period, the Chinese government also created Special Economic Zones or SEZs (which included inland cities (Shenzhen, Zhuhai, Shantou, Haikou and Xiamen and coastal port cities Shanghai, Hangzhou and Dalian) to attract foreign investments. The creation of these Zones along with the preferential policies had an remarkable impact on the amount of FDI flowing into China.
the flow in 1980). Also during this period, China became a member of the World Trade Organization, which deepened its involvement in international economics and further opened China's markets to the world. The steady growth of foreign investments slowed during the Asian financial crisis but quickly recovered by the end of 2001.
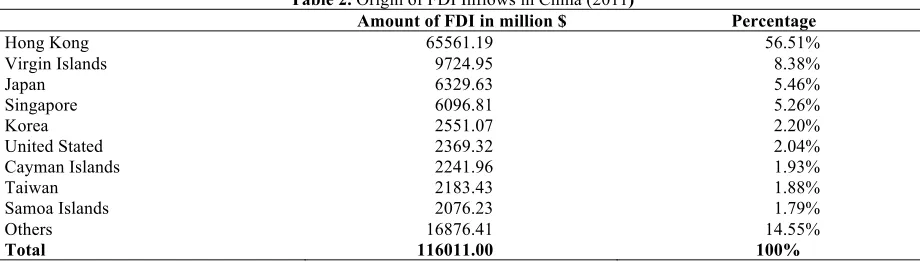
The third stage continues from 2003 to present day. After the Asian financial crisis and joining the WTO, China's economy still maintained a rapid growth. Continued reforms to internal industries and the removal of most barriers to foreign investments, further enhanced China's international competitiveness. As a result, many multinational enterprises relocated their research and development operations to China. By the end of 2005, over 750 multinational enterprises have research and development operations in China. By the end of 2011, FDI into China has grown to $ 116 billion.
Table 2. Origin of FDI Inflows in China (2011)
Amount of FDI in million $ Percentage
Hong Kong 65561.19 56.51%
Virgin Islands 9724.95 8.38%
Japan 6329.63 5.46%
Singapore 6096.81 5.26%
Korea 2551.07 2.20%
United Stated 2369.32 2.04%
Cayman Islands 2241.96 1.93%
Taiwan 2183.43 1.88%
Samoa Islands 2076.23 1.79%
Others 16876.41 14.55%
Total 116011.00 100%
Source:China Statistical Yearbook by China's National Bureau of Statistics
Table 2 describes the source of FDIs flowing into China. According to the table, East Asia, particularly Hong Kong, constitutes the bulk of the source of FDIs flowing into China. In 2011, there were more than $ 65.56 billion investments originating from Hong Kong. An interesting observation is the relatively small amount of investments originating from Taiwan. Taiwan companies face multiple restrictions setup by the Taiwanese government to restrict direct investment into China. Therefore many businesses prefer to use Hong Kong, Virgin Islands, Cayman Islands and Samoa Islands as a springboard to invest in China. This explains relatively small amount of investments originating from Taiwan, which was only $2.18 billion in 2011 (Long, 2005; Du et al., 2012). Long (2005) believes that the actual amount of investments originating from Taiwan could be more than two times the amount provided by official data. Because of cultural and historical reasons, there is no surprise that Hong Kong and Taiwan are two key sources of FDI.
2.2 Literature Review
The rapid growth of FDI in China in recent years has increased the number of researches into this topic. In particular, the location choice of FDIs has received more attention. Early studies by Chen (1996) and Broadman and Sun (1996) paved the foundations in this area. Through provincial level panel data from 1984 to 1992, their studies identified factors which impacted the flow of FDIs into China. Their studies also revealed that macroeconomic conditions, such as GNP and infrastructure, and preferential policies were significant factors that attracted FDI. However, methodologically, some of these previous researches’ OLS regressing models ignored the fixed effect across different provinces or the agglomeration effect, which may play positive roles in attracting foreign investors.
inflows. Their research also showed that foreign investors always tend to invest into the regions where there is already a high concentration of foreign firms, which is also an indication of the positive role large market size, good infrastructure and preferential policy have on FDI stock, and negative role of wage cost. Using geographical concentration, Coughlin and Segev (2000) focused on the identification of the spatial effect. Using a OLS model to examine the result of the studies by Chen (1996) and Broadman and Sun (1996), Coughlin and Segev (2000) did not find transportation infrastructure to be statistically significant in their results. In this paper I also show that considering spatial error would improve the statistical significances of the results. Head and Mayer (2004) found that the market potential of neighboring regions has the best explanatory power for their analysis of Japanese investment in the European Union. Chen (2009) found there exist both within and across region agglomeration effects. And Blanc-Brude et al. (2014) compared the alternative concepts of distance, and found clear evidence of spatial dependence between cities based upon economic distance, with weaker evidence related to administrative distance.
Recent researchers have been focusing on identifying other factors to explain the location of FDI in China. Using GMM to deal with the dynamic panel data, Morley (2008) shows that the negative relationship between Tobin’s Q and FDI in China. He also showed that FDI can act indirectly as a substitute for domestic Chinese investment. Zhang (2008) and He and Wang (2008), used spatial variables to improve on Morley's (2008) model and received a more robust result. And Du et al. (2012) pointed that foreign invested enterprises from the source countries that are culturally more remote from China often exhibit a stronger aversion to regions with weaker economics institutions. Other studies showed a negative relationship between state-owned enterprises output and FDI inflows, and high industrial enterprise numbers can have a positive influence on FDI by attracting more foreign investors.
3. DATA AND VARIABLES
3.1 Data Source and definition
This empirical analysis uses panel data sample from 1996-2008 which includes 45 cities across all Chinese provinces except Tibet and Gansu. The sample includes 45 influential cities across 25 provinces and 4 directly administered cities - Beijing, Shanghai, Tianjin and Chongqing. A complete list of the cities included in this study is presented in the appendix.
The data samples are obtained from the following databases:
(1) China Statistical Yearbook by China's National Bureau of Statistics, from 1996 to 2009;
(2) Urban Statistical Yearbook by National Statistics Bureau each city’s Investigation Brigade, from 1996 to
2009;
(3) each city’s National Economic and Social Development of Statistics Report by National Statistics Bureau
each city’s Investigation Brigade, from 1996 to 2009;
(4) CEIC China Premium Database
(5) Atlas of China by Sinomaps Press, Beijing, China, 2007
3.2 Definition of Variable
This paper will consider the impacts on FDIs arising from normal and spatial variables. Keeping in-line with previous researches and China's unique situation, I choose previous FDI flows, government policy level, education level, average wage, market potential, infrastructure development and population size as variables.
previous (t-1) period FDI flows as the agglomeration variable. This paper also uses this more recent method to more agglomeration effect.
Government policies have a key influence on the Chinese market. This is most evident, in the1980s and 1990s. During this period, the Chinese Government, with the aim of developing regional economies, implemented new policies to attract FDI. One of the most important aspects of the new polices is the tax rates discount advantages given to foreign investors. Other polices aimed at the creation of special economic zones (SEZs). Initially in 1979, five SEZs were established in major cities. Then in 1984 a further 14 where established. In total, 19 cities across China were designated as SEZs. The SEZs provided foreign investors with special incentives, which includes tax concessions, rebates and exemptions, preferential land use, and discounted prices on inputs. In this study, cities received different values regarding their tax advantage and level of openness. Between 1996 and 2008, the Chinese government completed a large-scale development of its western regions and successfully joined the WTO. These two major achievements further enhanced the attractiveness of the Chinese economy to foreign investors. The measurement for government policy is a dynamic variable and takes into account this change in policies.
Existing statistical analysis of the location choices of FDI in china find that the economic level of a region will affect the FDI agglomerate level in that region (Coughlin and Segev, 2000; and Gao, 2005). I use spatial variable - market potential as a measure of the degree of economic development of a region (Harris (1954), Anselin (1988) and Blonigen (2005)) .
MPi,t=GDPi,t
Di +
GDPj,t
Dji
j≠i n
∑
Other variables affecting FDI and included this study include: 1) regional infrastructure development, 2) average real wage, 3) education or labor quality, 4) Degree of marketization, and 5) population size. The more developed a region’s infrastructure, the more attractive it will become for potential foreign investors. Morley (2008) showed that lower transport costs can positively influence FDI. Average real wage of a region will also have a negative impact on FDI flows (Cheng and Kwan, 2000), as higher labor costs will decrease investor profits. Education or labor quality variable has a positive effect on FDI flows, since it sends a positive signal attracting high-tech investment projects (Coughlin and Segev, 2000 and Morley, 2008). High marketization degree will attract more foreign investors, while a low degree of marketization will be detrimental to FDI flows (Bai et al., 2004).
3.3 Variables
(1) Foreign direct investments (FDI): Foreign directly investment is measured in RMB (Millions) and
consists of realized investments by foreign entities’ during a year. It includes both genuine foreign firms and foreign registered Chinese firms that are active in China, but excludes purely financial investments.
(2) Previous period Foreign direct investment (FDI(t-1)). Previous period foreign directly investment in each
city can measure the agglomeration effect on the next period FDI flows.
(3) Wage level of region (WAGE): The average salary of urban employees obtained from China's National
Bureau of Statistics.
(4) Education level of region (EDU): Education level is measured by the percentage of the population that has
graduated from high school. We suppose the labor travel cost is very low in same province employment and use the province level data substitute the city level data.
(5) Road coverage (ROAD): The degree of infrastructure development is measure by the highway density
which is the ratio between the length of highway (Kilometers) in the province and the size (1000 square kilometers) of province.
(6) Government policies (POLICY): Each city will receive a value which indicates its level of development,
completion of large scale western development project); 3) post 2002 period: all cities receive a value increase of 1 (China has joined the WTO)
(7) Population Size (POP): We use the urban resident population to measure the population of each city. The
unit is ten thousand people.
(8) Degree of marketization (UNMRK): In order to measure the degree of under-marketlization, we use the
ratio between the output of state-owned enterprises and the output of whole society, and multiplied by 100. (9) MP. We can use the following formula to calculate the market potential for each city:
MPi,t=GDPi,t
Di +
GDPj,t Dji
j≠i n
∑
MPi,tis the market potential of city (i) at time (t); GDPi,t is the GDP of city (i) at time (t) and is measured in
millions RMB; Djiis the distance (in Kilometers) between city (j) and city (i); and Diis a size function of the city
(i) (Redding, 2004) given by: Di=2 3
Si π .
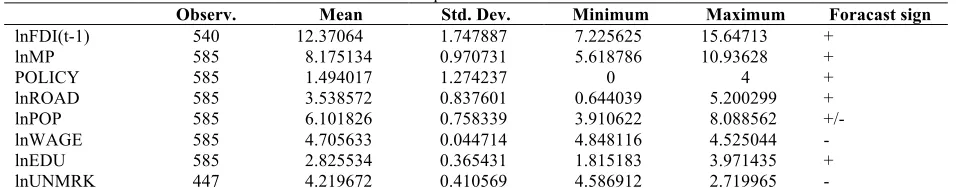
And we can see the statement of data set in Table 3.
Table 3. Descriptive Statistics of Variables
Observ. Mean Std. Dev. Minimum Maximum Foracast sign
lnFDI(t-1) 540 12.37064 1.747887 7.225625 15.64713 +
lnMP 585 8.175134 0.970731 5.618786 10.93628 +
POLICY 585 1.494017 1.274237 0 4 +
lnROAD 585 3.538572 0.837601 0.644039 5.200299 +
lnPOP 585 6.101826 0.758339 3.910622 8.088562 +/-
lnWAGE 585 4.705633 0.044714 4.848116 4.525044 -
lnEDU 585 2.825534 0.365431 1.815183 3.971435 +
lnUNMRK 447 4.219672 0.410569 4.586912 2.719965 -
Source: China Statistical Yearbook by China's National Bureau of Statistics;Urban Statistical Yearbook by National Statistics Bureau each city’s Investigation Brigade;each city’s National Economic and Social Development of Statistics Report by National Statistics Bureau each city’s Investigation Brigade;CEIC China Premium Database;Atlas of China by Sinomaps Press, Beijing, China, 2007.
4. EMPIRICAL RESULTS
This empirical analysis is based on a 1996 to 2008 city level panel data set, the regression model is specified as:
ln𝐹𝐷𝐼!,!=α!+𝛽!ln𝐹𝐷𝐼!,!!!+𝛽!ln𝑀𝑃!,!+𝛽!𝑃𝑂𝐿𝐼𝐶𝑌!,!
+𝛽!ln𝑅𝑂𝐴𝐷!,!+𝛽!ln𝑊𝐴𝐺𝐸!,!+𝛽!ln𝐸𝐷𝑈!,!+𝛽!ln𝑈𝑁𝑀𝑅𝐾!,!+𝛽!ln𝑃𝑂𝑃+𝜀!,!
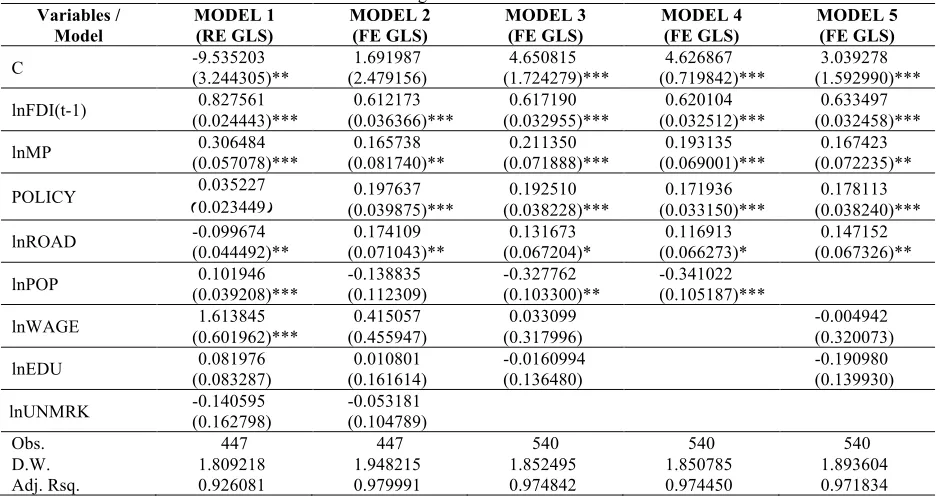
In this equation, a log-linear functional form is adopted with the purpose of transforming a likely non-linear relationship between the realized FDI flows and the explanatory variables into a linear relationship. In addition, the logarithm transformation enables us to directly obtain FDI elasticity’s with respect to various explanatory variables. The results of one Random Effect GLS and four Fixed Effect GLS analyses are presented in Table 4.
expectance of lnWAGE and lnEDU, agree with our predictions. From Model 3 to 5, we test the consistency and robustness of the six explanatory variables by introducing different control variables. The result is consistent in Model 2 to 5. C, lnFDI(t-1), lnMP, POLICY and lnROAD are significantly positive. lnPOP remains negative in all models.
Table 4. The regression result of five models Variables /
Model MODEL 1 (RE GLS) MODEL 2 (FE GLS) MODEL 3 (FE GLS) MODEL 4 (FE GLS) MODEL 5 (FE GLS) C -9.535203 (3.244305)** (2.479156) 1.691987 (1.724279)*** 4.650815 (0.719842)*** 4.626867 (1.592990)*** 3.039278 lnFDI(t-1) (0.024443)*** 0.827561 (0.036366)*** 0.612173 (0.032955)*** 0.617190 (0.032512)*** 0.620104 (0.032458)*** 0.633497 lnMP (0.057078)*** 0.306484 (0.081740)** 0.165738 (0.071888)*** 0.211350 (0.069001)*** 0.193135 (0.072235)** 0.167423 POLICY (0.035227 0.023449) 0.197637
(0.039875)***
0.192510 (0.038228)***
0.171936 (0.033150)***
0.178113 (0.038240)*** lnROAD -0.099674 (0.044492)** (0.071043)** 0.174109 (0.067204)* 0.131673 (0.066273)* 0.116913 (0.067326)** 0.147152 lnPOP (0.039208)*** 0.101946 -0.138835 (0.112309) -0.327762 (0.103300)** -0.341022 (0.105187)***
lnWAGE (0.601962)*** 1.613845 (0.455947) 0.415057 (0.317996) 0.033099 -0.004942 (0.320073) lnEDU (0.083287) 0.081976 (0.161614) 0.010801 -0.0160994 (0.136480) -0.190980 (0.139930) lnUNMRK -0.140595 (0.162798) -0.053181 (0.104789)
Obs. 447 447 540 540 540
D.W. 1.809218 1.948215 1.852495 1.850785 1.893604
Adj. Rsq. 0.926081 0.979991 0.974842 0.974450 0.971834
Source: Same as in Table 3
Note: ***, ** and * indicate that the coefficient is significant at the 1, 5 and 10% level, respectively. Table 5. Correlated Random Effects - Hausman Test
Test Summary Chi-Sq. Statistic Chi-Sq. d.f. Prob.
Cross-section random 92.505746 8 0.00000
Source: Same as in Table 3
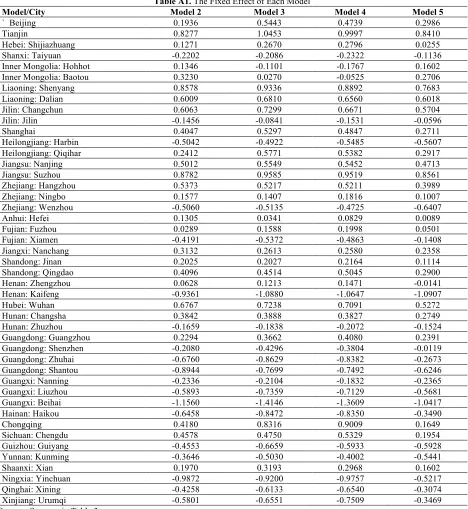
In detail, we can see clearly that each city has its own endowment which is listed in the Appendix. Like Beijing, Tianjin, Shanghai and Guangzhou, some cities have higher endowments which are caused by their geographical advantages and historical effects. The agglomeration effect is significant in each model, and it shows that FDI always flow into a region where there is a high concentration of foreign firms. Past empirical literatures have shown that the agglomeration economies can reduce the cost to firms, and thus attract more potential investors. lnFDI (t-1) and lnMP are positively significant in each model which shows that previous period FDI and Market potential both have positive effect on current FDI.
Surprisingly, the sign of lnEDU is negative in model 3 and model 5, and the sign of lnWAGE is positive in model 4 and model 3. Although they are not statistically significant, these results could indicate that the average wage is not a significant factor blocking foreign investments. One reason could be that higher wage may give the regional population higher disposable personal income and purchasing power. Expanding our previous prediction, the lnWAGE could have a negative effect on FDI if the aim of foreign firm is manufacturing in nature. However, if the firm’s goal is to target regional consumers, then the purchasing power of the regional population could have a major influence on investment decisions. The positive but not significant results of education could be explained by the nature of the FDI in China. Historically, most FDIs flowed into low value-added industries in China. In these industries, workers do not receive any additional rewards from a higher education. But more recently, foreign investments are shifting towards higher value-added industries, where works are rewarded for higher education. The interaction of these two effects could causethe educational factor to be insignificant.
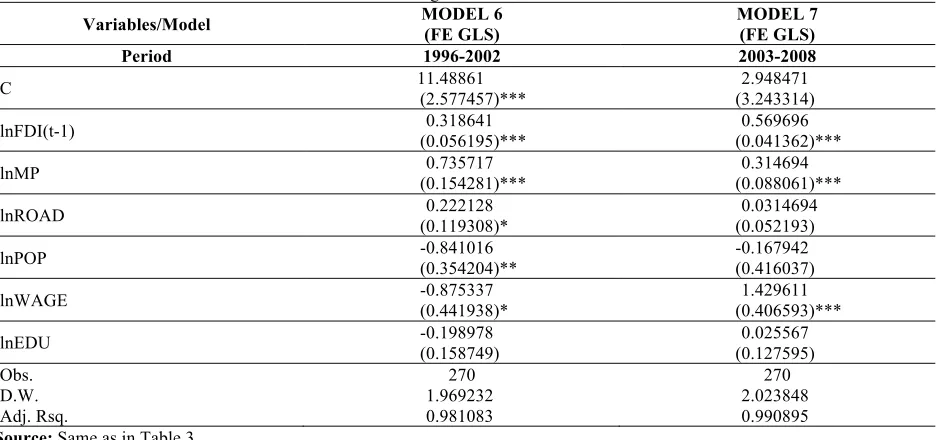
Table 6. The result of regression of Model 6 and Model 7
Variables/Model MODEL 6 (FE GLS) MODEL 7 (FE GLS)
Period 1996-2002 2003-2008
C 11.48861 (2.577457)*** (3.243314) 2.948471
lnFDI(t-1) (0.056195)*** 0.318641 (0.041362)*** 0.569696
lnMP (0.154281)*** 0.735717 (0.088061)*** 0.314694
lnROAD (0.119308)* 0.222128 (0.052193) 0.0314694
lnPOP -0.841016 (0.354204)** -0.167942 (0.416037)
lnWAGE -0.875337 (0.441938)* (0.406593)*** 1.429611
lnEDU -0.198978 (0.158749) (0.127595) 0.025567
Obs. 270 270
D.W. 1.969232 2.023848
Adj. Rsq. 0.981083 0.990895
Source: Same as in Table 3
Note: Standard errors are in parentheses
***, ** and * indicate that the coefficient is significant at the 1, 5 and 10% level, respectively.
5. CONCLUSION
The growing number of theoretical and empirical studies exploring the determinants of the origin of FDIs in China highlights the importance of this research area. However, few of them focus on the city level data and the component of FDI inflows. Also past researches have largely ignored the important issue of spatial variable. This study re-examines the determinants of the city location of FDI in China with a spatial variable by the fixed effect GLS. What is more, I separate the data set into two periods, and find that in response to the transformation of the economic environment, the investment decisions of foreign investors are influenced by education level and income of regions. This observation is different from previous studies.
This analysis covers 45 cities across China and spans a period from 1996-2008. I explore the relationship between FDI flow and Chinese city characteristics. Employing methodologies from some past researches, this study estimates five GLS regressions by introducing some new variables, which includes a new spatial variable. From the result, we clearly identified factors that affect the location choices of FDI in China. The results show that coastal regions have higher advantages compared to the inland cities and are thus more attractive to the foreign investors. As Cheng and Kwan (2000) and Morley (2008) suggested, the agglomeration effect and political effect can both positively influence foreign investors’ decisions to invest in China. This study also discovered that transport infrastructure (highways), which was found not significant in Coughlin and Segev (2000), is a significantly positive factor attracting FDI inflows. Population is shown to be a negative factor on determinants of FDI location. The spatial variable, market potential, which measures the geographical concentrate effect on GDP, is observed to be a positive factor. Other factors, such as average wage, educational level and marketization level are not statistically significant in the models, which is inconsistent withCoughlin and Segev (2000).
By separating this data set into two periods, from 1996 to 2002 and from 2003 to 2008, we observed that, between 1996 to 2002, the average wage has a negative impact on FDI flows. However, between 2003 to 2008, the opposite is observed, the average wage positively affects FDI flows. This indicates a structural change in the direction of FDI flows, and indicates that from 2003, the FDI flow more likely target the domestic Chinese market and flow into high value-added industries. From 2003, big cities became more popular for foreign investors and the negative coefficient of population size became statistically insignificant. This fact may be due to large cities having a bigger potential market that can be attractive to foreign investors.
AUTHOR INFORMATION
Yu Liang is a Ph.D. candidate at School of Economics and Management, Tsinghua University, China. He visited Columbia Business School, Columbia University as a visiting scholar in 2013-2014. His research areas include: behavioral finance, asset pricing, international finance and international economics. E-mail: [email protected]
REFERENCES
Anselin, L. (1988). Spatial econometrics: methods and models. Netherlands: Kluwer Academic Publishers. Bai, C., Du, Y., Tao, Z., & Tong, S. Y. (2004). Local protectionism and regional specialization: evidence from
China's industries. Journal of International Economics, 63(2), 397-418.
Blanc-Brude, F., Cookson, G., Piesse, J., & Srange, R. (2014). The FDI location decision: distance and the effects of spatial dependence. International Business Review, 23(4), 797-810.
Blonigen, B. A. (2005). A review of the empirical literature on FDI determinants. Atlantic Economic Journal, 33(4), 383-403.
Broadman, H. G., & Sun, X. (1997). The distribution of foreign direct investment in China. The World Economy, 20(3), 339-361.
Chen, C. (1996). Recent developments in foreign direct investment in china. Working paper, University of Adelaide of South Australia.
Cheng, L. K., & Kwan, Y. K. (2000). What are the determinants of the location of foreign direct investment? The Chinese experience. Journal of International Economics, 51(2), 379-400.
China's National Bureau of Statistics. (1996-2009) China Statistical Yearbook. China's National Bureau of Statistics. Coughlin, C. C., & Segev, E. (2000). Foreign direct investment in China, a spatial econometric study. The World
Economy, 23(1), 1-23.
Dees, S. (1998). Foreign direct investment in China: determinants and effects. Economics of Planning, 31(2), 175-194.
Doren, D. C., Qiu, F., & Rose, E. L. (2003). FDI location at the subnational level: a study of EJV in China. Journal of Business Research, 56(10), 835-845.
Du, J., Lu,Y., & Tao, Z. (2012). Institutions and FDI location choice: the role of cultural distances. Journal of Asian Economics, 23(3), 210-223.
Fu,J. (2000). Institutions and investments. Michigan: University of Michigan Press.
Fujita, M., Krugman, P., & Venables, A. J. (1999). The spatial economy: cities, regions, and international trade, Boston, MA: MIT Press.
Fung, K. C., Iizaka, H., & Tong, S. (2004). Foreign direct investment in China: policy, trend and impact. Global Economic Review, 33(2), 99-130.
Gao, T. (2003). Ethnic Chinese networks and international investment: evidence from inward FDI in China. Journal of Asian Economics, 14(4), 611-629.
Gao, T. (2006). Foreign direct investment and growth under economic integration. Journal of International Economics, 67(1), 157-174.
Harding, H. (1987). China’s Second Revolution: Reform after Mao. Washington, D.C.: The Brookings Institution. Harris, C. D. (1954). The market as a factor in the localization of industry in the United States. Annals of the
Association of American Geographer, 44(4), 315-348.
He, X., & Wang, L. (2008). Empirical analysis on Spatial Linkages in FDI across China. Economic Research Journal (Jingji Yanjiu). 11(3), 138–150.
Head, K., & Mayer, T. (2004). Market potential and the location of Japanese investment in the European Union. Review of Economics and Statistics, 86 (4), 959-972.
Kahai, S. K. (2004). Traditional and non-traditional determinants of foreign direct investment in developing countries. Journal of Applied Business Research, 20(1), 43-50.
Li, Z., & Gong, Y. (2002). Determinants of FDI in China's provincial distribution. Journal of Tianjin University (social sciences), 4(2), 117-121.
Morley, B. (2008). Tobin’s Q and the location of foreign direct investment in China. International Journal of Business and Management, 3(3), 24-29.
National Statistics Bureau Investigation Brigade. (1996–2009). National economic and social development of statistics in the report, National Statistics Bureau.
National Statistics Bureau Investigation Brigade. (1996-2009). Urban Statistical Yearbook, National Statistics Bureau.
Rauch, J., & Trindade, V. (2002). Ethnic Chinese networks and international trade. Review of Economics and Statistics, 84(1), 116-130.
Redding, S., & Venables, A. J. (2004). Economic geography and international inequality. Journal of International Economics, 62 (1), 53–82.
Sun, J. (2002). Factors affecting the location of FDI in China. China Economic Quarterly, 1(3), 687-698. Sun, Q., Tong, W. & Yu, Q. (2002). Determinants of foreign direct investment across China. Journal of
International Money and Finance, 21(1), 79-113. Sun, X. (2007). Atlas of China. Beijing, China: Sinomaps Press.
Tobler, W. R. (1970). A computer movie simulating urban growth in the detroit region. Economic Geography, 46(2), 234-240.
Weidenbaum, M., & Hughes, S. (1996). The bamboo network, New York: Martin Kessler Books, Free Press.
Zhang, K. H. (2000). Why is US direct investment in China so small? Contemporary Economic Policy, 18(1), 82-94. Zhang, T., & Chen, L. (2008). A study on stage difference of FDI determinants in China: based on estimation of
APPENDIX
Table A1. The Fixed Effect of Each Model
Model/City Model 2 Model 3 Model 4 Model 5
` Beijing 0.1936 0.5443 0.4739 0.2986
Tianjin 0.8277 1.0453 0.9997 0.8410
Hebei: Shijiazhuang 0.1271 0.2670 0.2796 0.0255
Shanxi: Taiyuan -0.2202 -0.2086 -0.2322 -0.1136
Inner Mongolia: Hohhot 0.1346 -0.1101 -0.1767 0.1602
Inner Mongolia: Baotou 0.3230 0.0270 -0.0525 0.2706
Liaoning: Shenyang 0.8578 0.9336 0.8892 0.7683
Liaoning: Dalian 0.6009 0.6810 0.6560 0.6018
Jilin: Changchun 0.6063 0.7299 0.6671 0.5704
Jilin: Jilin -0.1456 -0.0841 -0.1531 -0.0596
Shanghai 0.4047 0.5297 0.4847 0.2711
Heilongjiang: Harbin -0.5042 -0.4922 -0.5485 -0.5607
Heilongjiang: Qiqihar 0.2412 0.5771 0.5382 0.2917
Jiangsu: Nanjing 0.5012 0.5549 0.5452 0.4713
Jiangsu: Suzhou 0.8782 0.9585 0.9519 0.8561
Zhejiang: Hangzhou 0.5373 0.5217 0.5211 0.3989
Zhejiang: Ningbo 0.1577 0.1407 0.1816 0.1007
Zhejiang: Wenzhou -0.5060 -0.5135 -0.4725 -0.6407
Anhui: Hefei 0.1305 0.0341 0.0829 0.0089
Fujian: Fuzhou 0.0289 0.1588 0.1998 0.0501
Fujian: Xiamen -0.4191 -0.5372 -0.4863 -0.1408
Jiangxi: Nanchang 0.3132 0.2613 0.2580 0.2358
Shandong: Jinan 0.2025 0.2027 0.2164 0.1114
Shandong: Qingdao 0.4096 0.4514 0.5045 0.2900
Henan: Zhengzhou 0.0628 0.1213 0.1471 -0.0141
Henan: Kaifeng -0.9361 -1.0880 -1.0647 -1.0907
Hubei: Wuhan 0.6767 0.7238 0.7091 0.5272
Hunan: Changsha 0.3842 0.3888 0.3827 0.2749
Hunan: Zhuzhou -0.1659 -0.1838 -0.2072 -0.1524
Guangdong: Guangzhou 0.2294 0.3662 0.4080 0.2391
Guangdong: Shenzhen -0.2080 -0.4296 -0.3804 -0.0119
Guangdong: Zhuhai -0.6760 -0.8629 -0.8382 -0.2673
Guangdong: Shantou -0.8944 -0.7699 -0.7492 -0.6246
Guangxi: Nanning -0.2336 -0.2104 -0.1832 -0.2365
Guangxi: Liuzhou -0.5893 -0.7359 -0.7129 -0.5681
Guangxi: Beihai -1.1560 -1.4146 -1.3609 -1.0417
Hainan: Haikou -0.6458 -0.8472 -0.8350 -0.3490
Chongqing 0.4180 0.8316 0.9009 0.1649
Sichuan: Chengdu 0.4578 0.4750 0.5329 0.1954
Guizhou: Guiyang -0.4553 -0.6659 -0.5933 -0.5928
Yunnan: Kunming -0.3646 -0.5030 -0.4002 -0.5441
Shaanxi: Xian 0.1970 0.3193 0.2968 0.1602
Ningxia: Yinchuan -0.9872 -0.9200 -0.9757 -0.5217
Qinghai: Xining -0.4258 -0.6133 -0.6540 -0.3074
Xinjiang: Urumqi -0.5801 -0.6551 -0.7509 -0.3469