IJEDR1904033 International Journal of Engineering Development and Research (www.ijedr.org) 185
Energy Based Pushover Analysis Of Higher Mode
Dominant Structure
1Mohammed GousePasha, 2Mohammed Imtiyaz 1Student, 2Assistant Professor
Nawab Shah Alam Khan College of Engineering and Technology
_____________________________________________________________________________________________________
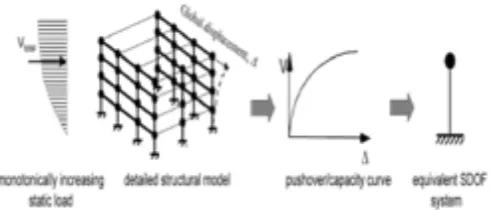
Abstract - The storey inertial forces and accelerations at all storeys and shear forces at higher storeys are significantly underestimated by methods which neglect or do not take into account the higher modes even for first mode dominated structures. Tall buildings are more susceptible to be influenced by the effects of higher modes on their response. Several studies suggest that numerous failures or even collapse of buildings were induced by large floor accelerations in which the higher modes were not taken into account. In this study conventional Pushover Analysis (POA) is carried out and since we know that it gives accurate results for structures whose response is controlled by the fundamental mode then there are bound to be anomalies in the higher mode pushover curves in the form of mode reversal. These can be corrected by performing Energy Based Pushover Analysis (EBPOA) as it takes into account the higher modes and then the performance level of the building for that mode in which the reversal took place is also determined
keywords - Energy based pushover analysis, Higher mode dominant structures, Mode reversal.
_____________________________________________________________________________________________________
1. INTRODUCTION
The seismic assessment and design of structures is required because of the occurrence of earthquakes. Earthquakes are caused by differential movements of the earth’s crust. The result of these movements is the well known ‘ground shaking’ that can lead to significant damage and/or collapse of buildings, infrastructure systems (e.g. dams, roads, bridges, viaducts etc), landslides, when soil slopes loose their cohesion, liquefaction in sand and destructive waves or ‘tsunamis’ in the maritime environments. Buildings should be designed like the ductile chain. For example, consider the common urban residential apartment construction - the multi-storey building made of reinforced concrete. It consists of horizontal and vertical members, namely beams and columns. The seismic inertia forces generated at its floor levels are transferred through the various beams and columns to the ground.
As per IS: 1893-2002 (Part 1), Clause 6.1.3, "Actual forces that appear on structures during earthquakes are much higher than the design forces specified in the code". It is recognized that neither complete protection against earthquakes of all sizes is economically feasible nor design alone based on strength criterion is justified.
Modes are the inherent properties of a structure, and are determined by material properties (mass, damping and stiffness), and boundary conditions of the structure. Each mode is defined by a natural frequency, modal damping and a mode shape. If at all the material properties or the boundary conditions of a structure change, its modes will change. For instance, if a mass is added to a structure then it will vibrate differently
Every structure has a tendency to vibrate at a certain frequency known as the natural frequency. Each natural frequency is associated with a particular deflection pattern of the structure and this pattern is known as mode shape. When structure is properly excited by dynamic loads with frequency that coincides with natural frequency of the structure, it undergoes large displacements and stresses. In such cases the static analysis cannot be used
Fig.1 Variation of Modes due to Change in Stiffness.
In vapour compression cycle having compressor. It delivers the vapour refrigerant at high temperature to condenser. The Compressor uses power from engine itself. Cooling effect is prodused by cooling of refrigerant in the condenser. The vapour compression air conditioning system has some drawbacks, that’s why another better alternative is needed. That is adsorption air conditioning system. it is used in this project.
IJEDR1904033 International Journal of Engineering Development and Research (www.ijedr.org) 186 adsorbent. Silica gel adsorbs the water molecules. So it will forms the pair with water. In this project adsorption-desorption processes and some thermodynamic process takes place.
1.1 Literature review:
Newer analysis methodologies are being proposed with focus on a realistic characterization of seismic structural damage and its direct incorporation in the design methodology. In addition, a major emphasis is given to the characterization of all the uncertainties in the process of design In general, these approaches are categorized under performance-based seismic design (PBSD). The various ways of modeling structural damage for PBSD lead to various design approaches.
Yi Jiang and Yang (2010) developed an energy balance concept based Multimode Pushover Analysis to estimate the seismic demand of new and retrofitted buildings, which incorporates the concept of modal energy demand and capacity. The buildings were assumed to be linearly elastic. The dynamic target displacement was determined based on the interaction of the two diagrams. The proposed procedures accuracy is evaluated for buildings subjected to a variety of ground motions, including near-fault ground motions with fling-step. The statistical predictions of seismic demands of building under selected ground motions compared with the estimates of NL-THA and MMPA demonstrate that the proposed procedure is an attractive alternative for practical application.
Grigorious Manoukas et al., (2011) in their paper “Static Pushover Analysis based on an Energy-Equivalent SDOF system: Application to Spatial Systems”, have proposed an efficient NSP based on energy equivalence. The energy equivalence of the structure is used as a margin to estimate the rood displacement under the monotonically increasing loads those are characterized by the modal shape of the structure (the fundamental mode shape). The work done in displacing the structure is a better index to estimate the performance of the structure and to determine the characteristics of the same. The proposed methodology was demonstrated using a framed structure and the results were compared with that of CSM. Good results for 2D and 3D framed buildings can be obtained using the procedure and is applicable for structures with regular or irregular multi-story planar frames. It is clear that the method’s good approximation of the roof displacements shown in this paper does not ensure analogous accuracy for other quantities of interest, e.g. plastic rotations.
Angelo and Marco (2014) has proposed an energy-based method for Non-linear static analysis in which both the capacity curve and the demand curve are in terms of energy. The capacity curve was referred to as virtual displacement defined such that at each load step the equivalent SDOF system has the same deformation energy of the MDOF system. Integrating the capacity curve with respect to the virtual displacement, deformation energy is obtained. The demand is expressed as an energy quantity called as pseudo-energy. The definition of the performance point does not require iterative procedures. The results were compared with NL-THA and EC8 NSA procedure and were considered to be fairly accurate
1.2 Non-Linear Static Pushover Analysis:
The ATC-40 (1996) document has been a source of great knowledge for researchers working on the NSPs (Capacity Spectrum Method, Coefficient Method etc.). Excerpts from the documents that would give a better picture of the pushover analysis have been presented in the following paragraphs discussing the background and the development of the performance based analysis. The NSP may be used for any structure and any Rehabilitation Objective, with the following exceptions and limitations. The NSP should not be used for structures in which higher mode effects are significant, unless an LDP evaluation is also performed.
To determine the response, if higher modes are significant, a modal response spectrum analysis should be performed for the structure using sufficient modes to capture 90% mass participation and a second response spectrum analysis should be performed considering only the first mode participation. Higher mode effects should be considered significant if the shear in any story calculated from the modal analysis considering all modes required to obtain 90% mass participation exceeds 130% of the corresponding story shear resulting from the analysis considering only the first mode response.
The NSP should not be used unless comprehensive knowledge of the structure has been obtained. 2 OBJECTIVE OF THE STUDY:
To identify the buildings in which higher modes are predominant to illustrate the inefficiency of Conventional Pushover Analysis (POA) on higher mode dominant structures. To perform Energy Based Pushover Analysis (EBPOA) for higher mode dominant structures. To obtain the performance level of higher mode dominant structures using EBPOA.
METHODOLOGY:
IJEDR1904033 International Journal of Engineering Development and Research (www.ijedr.org) 187 Estimates of the deformation demands for elements that have to deform in- elastically in order to dissipate the energy imparted to the structure by ground motions.
Consequences of the strength deterioration of individual elements on the behaviour of the structural system.
Identification of the critical regions in which the deformation demands are expected to be high and that have to become the focus of thorough detailing.
Identification of the strength discontinuities in plan or elevation that will lead to changes in the dynamic characteristics in the inelastic range. Estimates of the inter-story drifts that account for strength or stiffness discontinuities and that may be used to control damage and to evaluate P-delta effects.
Verification of the completeness and adequacy of load path, considering all the elements of the structural system, all the connections, the stiff non-structural elements of significant strength, and the foundation system.
Where yielding is more gradual, disproportionate increases in the roof displacement may, in addition, affect the effective yield strength that is determined for the structure: when methods such as those described in ATC-40 are used
Fig. 3 Different Types of Frames
2.1 MODAL ANALYSIS PROCEDURE:
The nonlinear response of a MDOF system with N degrees of freedom subjected to an horizontal earthquake ground motion üg can be expressed as the sum of the responses of N SDOF systems, each one corresponding to a vibration "mode" i, having mass equal to the effective "modal" mass Μ * and displacement equal to Di = uNi/ νi φNi where uNi, νi and φNi are the roof displacement parallel to the excitation direction, the "modal" participation factor and the component of the vector φi corresponding to uNi respectively. the inelastic resisting force of each SDOF system is equal to the "modal" base shear Vi parallel to the direction of excitation the external work of "modal" forces Fsi on the displacements dui = νi φi dDi in a differential time interval dt its equal to the work of the resisting force (or the strain energy) of the corresponding SDOF system on the displacement dDi. It is worthnoticing that Μi*, Vi , Fsi ,Di, uNi, νi, φi and φNi refer to the elastic vibration mode i. However, those conclusions are derived on the basis of the aforementioned assumptions and cannot be true all together when a pushover analysis is conducted. Thus, the EBMPA keeps conclusions 1) and 3) and uses the energy to determine modified resisting forces the system.
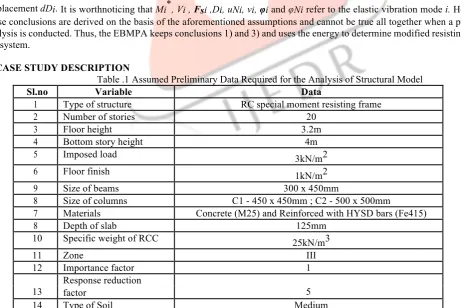
3. CASE STUDY DESCRIPTION
Table .1 Assumed Preliminary Data Required for the Analysis of Structural Model
Sl.no Variable Data
1 Type of structure RC special moment resisting frame
2 Number of stories 20
3 Floor height 3.2m
4 Bottom story height 4m
5 Imposed load 3kN/m2
6 Floor finish 1kN/m2
9 Size of beams 300 x 450mm
8 Size of columns C1 - 450 x 450mm ; C2 - 500 x 500mm
7 Materials Concrete (M25) and Reinforced with HYSD bars (Fe415)
8 Depth of slab 125mm
10 Specific weight of RCC 25kN/m3
11 Zone III
12 Importance factor 1
13
Response reduction
5 factor
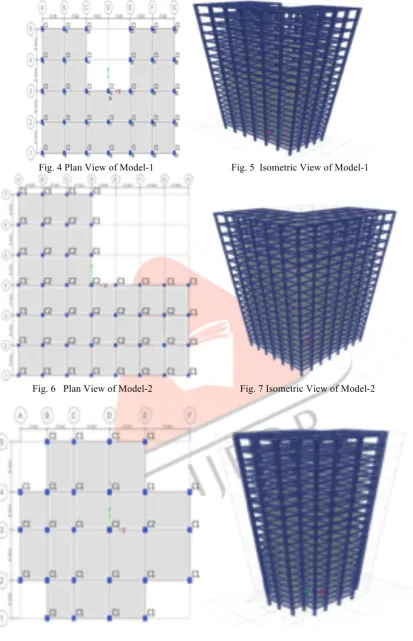
IJEDR1904033 International Journal of Engineering Development and Research (www.ijedr.org) 188 Fig. 4 Plan View of Model-1 Fig. 5 Isometric View of Model-1
Fig. 6 Plan View of Model-2 Fig. 7 Isometric View of Model-2
Fig. 8 Plan View of Model-3 Fig.9 Plan View of Model-3 3.1 Structural Systems of the Buildings:
IJEDR1904033 International Journal of Engineering Development and Research (www.ijedr.org) 189 Fig. 10 Geometry of the Structure
General Data of Buildings
The building model is located in zone III. Tables 1 and Table 2 present a summary of the building parameters. Table .2 General Data Collection and Condition Assessment of Buildings
Sl.no Description Information Remarks
1 Building height 64.8m Above ground level
2 Open ground storey Yes ----
3 Special hazards None ----
4 Horizontal floor system Beams and slabs
5 Software used ETABS 15.2.2 ----
3.2 Analysis Using Response Spectrum Method
Analysis methods are broadly classified as linear static, linear dynamic, nonlinear static and nonlinear dynamic methods. In these the first two methods are suitable when the structural loads are small and no point, the load will reach to collapse load and are differs in obtaining the level of forces and their distribution along the height of the structure. Whereas the non-linear static and non-linear dynamic analysis are the improved methods over linear approach. During earthquake loads the structural loading will reach to collapse load and the material stresses will be above yield stresses. So in that case material nonlinearity and geometrical nonlinearity should be incorporated into the analysis to get better results. These methods also provide information on the strength, deformation and ductility of the structures as well as distribution of demands.
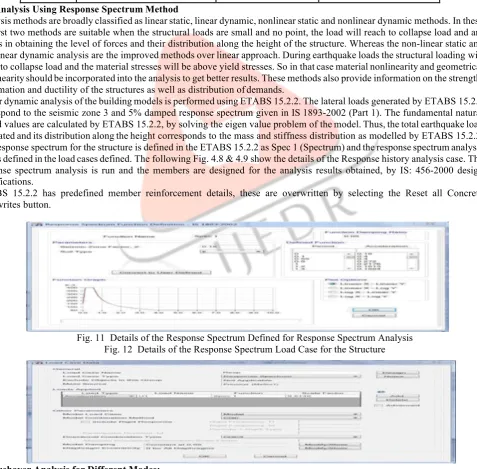
Linear dynamic analysis of the building models is performed using ETABS 15.2.2. The lateral loads generated by ETABS 15.2.2 correspond to the seismic zone 3 and 5% damped response spectrum given in IS 1893-2002 (Part 1). The fundamental natural period values are calculated by ETABS 15.2.2, by solving the eigen value problem of the model. Thus, the total earthquake load generated and its distribution along the height corresponds to the mass and stiffness distribution as modelled by ETABS 15.2.2. The response spectrum for the structure is defined in the ETABS 15.2.2 as Spec 1 (Spectrum) and the response spectrum analysis data is defined in the load cases defined. The following Fig. 4.8 & 4.9 show the details of the Response history analysis case. The response spectrum analysis is run and the members are designed for the analysis results obtained, by IS: 456-2000 design specifications.
ETABS 15.2.2 has predefined member reinforcement details, these are overwritten by selecting the Reset all Concrete Overwrites button.
Fig. 11 Details of the Response Spectrum Defined for Response Spectrum Analysis Fig. 12 Details of the Response Spectrum Load Case for the Structure
3.3 Pushover Analysis for Different Modes:
IJEDR1904033 International Journal of Engineering Development and Research (www.ijedr.org) 190 patterns involved in determining pushover curve of the building structure should represent characteristics of inertia forces developed in the building under the input ground motion excitation.
Fixed load patterns suggested by seismic codes are usually sufficient for the determination of the envelopes of the building inertia forces. These load patterns have invariant distribution through the height of the building but gradually increase until a target value of roof displacement is reached. The displacement at an ultimate state of the building, when a global mechanism exists, is set as the target displacement for comparison purposes
software is used to perform the pushover analysis of buildings using displacement control strategy, where gravity loads (set as nonlinear) of each building are applied prior to the pushover analysis.
Fixed lateral load patterns used to push the buildings are chosen such that they represent the common patterns recommended by the seismic regulation provisions of FEMA-273. Additionally, a fixed pattern based on the first mode of vibration for the building considering an ultimate deformed configuration is investigated.
The common lateral load patterns of FEMA-273 are as follows: The uniform load pattern (ULP)
The equivalent lateral force pattern (ELP) The first mode load pattern (FLP)
Deformed shape of the building (DLP) (Adaptive Pushover Analysis)
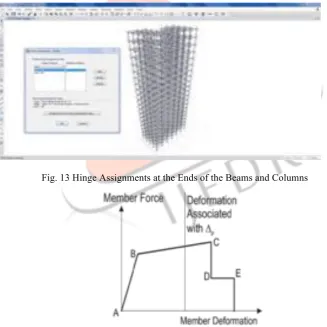
For defining the POA case we start with the assignment of the hinges to the members of the structure. Default hinge definitions according to the FEMA-356 guidelines have been provided at the ends, where the formation of the potential plastic hinges is more probable for beams and columns with degree of freedom as M3 and the shear value for the hinge is taken from the Dead load case.
Default hinge definitions according to the FEMA-356 guidelines have been provided at the ends, where the formation of the potential plastic hinges is more probable for beams and columns with degree of freedom as M3 and the shear value for the hinge is taken from the Dead load case. The hinges are set so that they drop the load after reachi ng the point E of the performance level as shown in Fig.14.
Fig. 13 Hinge Assignments at the Ends of the Beams and Columns
Fig. 14 Performance Levels According to Hinge States.
Force-displacement or moment-rotation curve for a hinge definition used in SAP2000 is referred to as a plastic deformation curve. The plastic deformation curve is characterized by the following points as:
Point A represents the origin. Point B represents the yielding state.
No deformation occurs in the hinge up to point B, regardless of the deformation value specified for point B.
The displacement (rotation) at point B will be subtracted from the deformations at points C, D, and E. Only the plastic deformation beyond point B will be exhibited by the hinge.
IJEDR1904033 International Journal of Engineering Development and Research (www.ijedr.org) 191 Point E represents total failure. Beyond point E the hinge will drop load down to point F directly below point E on the horizontal axis. If the users do not want the hinge to fail this way, a large value for the deformation at point E can be specified.
After assignment of the hinges, the pushover cases are defined under the conjugate monitored displacement. The top displacement of the structure is set to a certain percentage of the total height of the structure at one of the top storey nodes. The degree of freedom (U1) for the structure is in the direction of the application of the pushover loads i.e., along the x-axis. The RSM and Load cases are set to run at first, the structure is then designed according to IS: 456-2000 and then pushover cases are run on the designed structure, for the analysis results. The Dead loads case is assigned to non-linear static case, and the pushover case data is given as shown in the Fig.
Fig. 15 Pushover Analysis Load Case Data 4 Results and Discussions:
The following tables contains the results of the pushover analysis and energy based pushover analysis carried out for the three structures as discussed earlier. The result are of different pushover cases and each pushover case is for specific mode and directioni.e. PUSH-1X represents pushover in mode 1 and in X-direction. The values tabulated are of the critical modes of the structure, which have been considered in the analysis.
Table 3 Results of the POA and EBPOA of Model-1
Case:
POA EBPOA
Max Base Max Max Base Max
Displacement Displacement
Shear (kN) Shear (kN)
(m) (m)
PUSH-1X 1302.42 0.114 1302.42 0.092
PUSH-2Y 1371.51 0.383 1371.51 0.357
PUSH-4X 1758.46 -0.079 1758.46 0.456
Table 4 Results of the POA and EBPOA of Model-2.
Case:
POA EBPOA
Max Base Max Max Base Max
Displacement Displacement
Shear (kN) Shear (kN)
(m) (m)
PUSH-1Y 1914.09 0.358 1914.09 0.325
PUSH-2X 1978.13 0.101 1978.13 0.087
PUSH-4Y 2541.08 -0.033 2541.08 0.347
Table 5 Results of the POA and EBPOA of Model-3.
Case:
POA EBPOA
Max Base Max Max Base Max
Displacement Displacement
Shear (kN) Shear (kN)
(m) (m)
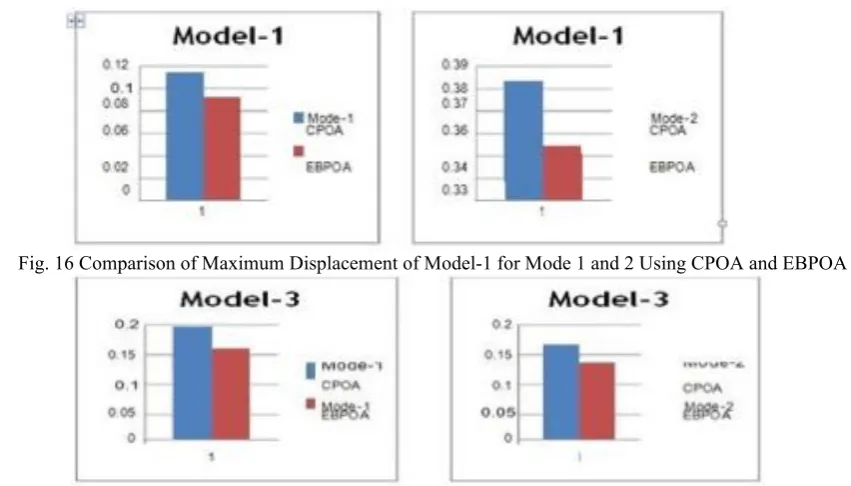
IJEDR1904033 International Journal of Engineering Development and Research (www.ijedr.org) 192 Fig. 16 Comparison of Maximum Displacement of Model-1 for Mode 1 and 2 Using CPOA and EBPOA
Fig. 17 Comparison of Maximum Displacement of Model-3 for Mode 1 and 2 Using CPOA and EBPOA By carefully observing the Tables 16 to 17 there is some amount of variation in roof displacement took place when the Energy based pushover analysis (EBPOA) is applied to the different models.
The variations when EBPOA is applied are as follows: Roof displacement reduced by 20% and 7% for the 1st and 2nd modes of model-1 respectively.
Roof displacement reduced by 9% and 14% for the 1st and 2nd modes of model-2 respectively. Roof displacement reduced by 19% and 20% for the 1st and 2nd modes of model-3 respectively.
This indicates that the conventional POA procedure overestimates the roof displacements of the structure when compared with EBPOA.
The results for EBPOA are obtained from the equations proposed by Hernandez Montes, while the results for POA have been obtained directly from the ETAB 15.2.2 output file. The use of the roof displacement in the conventional POA approach leads to an apparent stiffening in the post – yield response, while the energy-based approach shows monotonic softening with increasing displacement. Because each plastic hinge has a bilinear moment -rotation relationship the apparent stiffening after initial yielding is not physically reasonable, but instead must be viewed as a consequence of the arbitrary choice to index the capacity curve by displacement that increases disproportionately in the nonlinear regime.
4.1 Capacity curves
The pushover curves are obtained using the procedure given by Prof. Hernandez Montes.The pushover analysis for different modes is performed and the capacity curves are plotted from the analysis results obtained for POA and Energy-Based Pushover analysis. Fig. 5.2 shows the capacity curves of conventional pushover and Energy based pushover for different modes of the structure. It is seen that the energy based curve for the first mode response nearly coincides with the conventional first mode pushover capacity curve.
IJEDR1904033 International Journal of Engineering Development and Research (www.ijedr.org) 193 Fig. 20 Pushover Curve of Model-3 for Mode-2, Fig.21 Curve for Model-3 for Mode-4
Fig. 22 Pushover Curve of Model-3 for Mode-4
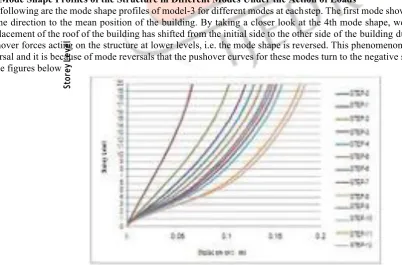
4.2 Mode Shape Profiles of the Structure in Different Modes Under the Action of Loads
The following are the mode shape profiles of model-3 for different modes at each step. The first mode shows displacements only in one direction to the mean position of the building. By taking a closer look at the 4th mode shape, we can observe that the displacement of the roof of the building has shifted from the initial side to the other side of the building due to the action of the pushover forces acting on the structure at lower levels, i.e. the mode shape is reversed. This phenomenon is called as the Mode reversal and it is because of mode reversals that the pushover curves for these modes turn to the negative side of the plot shown in the figures below
IJEDR1904033 International Journal of Engineering Development and Research (www.ijedr.org) 194 Fig. 24 Storey Level vs. Displacement Plot for the 4th Mode POA of Model-3
The major cause for the out-right reversals is due to the application of the pushover loads in proportion to the displaced shape of the structure (adaptive pushover), in this way, more force is applied at the story level where more storey displacement takes place, the first mode shape profile is a good example.
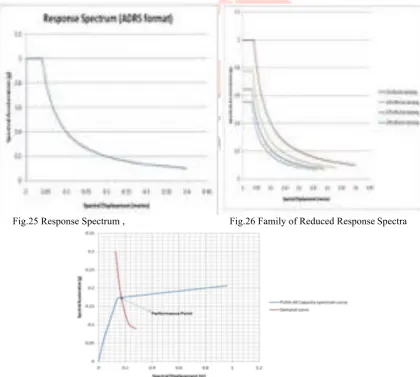
Response Spectra and Demand Curves
Response spectra is plotted for zone factor of 0.16 and effective peak acceleration (EPA) of the ground is 1*g as per ATC-40. It is then converted into Acceleration Displacement Response Spectra (ADRS) format i.e. spectral acceleration vs. spectral displacement as shown in Figures and then a series of family of response spectra is plotted corresponding to different effective damping values (βeff) starting from 5% to maximum of 20% for type C structure as shown in Fig Demand curve is generated using procedure given in ATC-40. Fig. The energy capacity and demand curves are shown in Figures. Using the intersection points of the demand and capacity curves as the maximum displacement values, the roof displacement and drift demands could be determined.
Fig.25 Response Spectrum , Fig.26 Family of Reduced Response Spectra
IJEDR1904033 International Journal of Engineering Development and Research (www.ijedr.org) 195 Fig. 28 Demand Curve and Capacity Curve for Mode-4 in Model-2
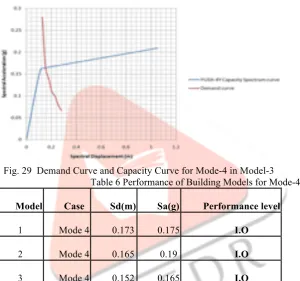
Fig. 29 Demand Curve and Capacity Curve for Mode-4 in Model-3 Table 6 Performance of Building Models for Mode-4
Model Case Sd(m) Sa(g) Performance level
1 Mode 4 0.173 0.175 I.O
2 Mode 4 0.165 0.19 I.O
3 Mode 4 0.152 0.165 I.O
In the table 6, the performance of the building is represented in terms of spectral acceleration (Sa) and spectral displacement (Sd). For the structural models selected for the study, the performance level of the buildings lies in the immediate occupancy stage. Since the work is targeted for studying the higher mode, the performance point is obtained using EBPOA which is not possible in conventional POA because of mode reversal.
5 CONCLUSIONS
The Energy-based POA has been applied to 3 models of 20 storey moment resisting 3D space frames, designed according to the Indian Standards (IS: 456-2000) for seismic loading using response spectrum analysis as specified by IS: 1893-2002. The frames are subjected to dead, live and dynamic loading as specified in IS: 1983-2002 & IS-875 Codes of Practice and designed according to IS: 456-2000.
IJEDR1904033 International Journal of Engineering Development and Research (www.ijedr.org) 196 calculations it can be concluded that the energy-based formulation provides a stronger theoretical basis for establishing the capacity curves of the first and higher mode equivalent SDOF systems. Overall, the performance level of different models considered falls under the same category mode.
REFERANCESS
[1] Angelo D’Ambrisi and Marco Mezzi, (2014). “An energy-based approach for nonlinear static analysis of structures”. Bulletin of Earthquake Engineering, Vol. 13(5), Pp. 1513- 1530.
[2] Ashraf Habibullah and Stephen Pyle, (1998). "Practical Three Dimensional Nonlinear Static Pushover Analysis". S.E.2 (Published in Structure Magazine).
[3] ATC-40 (1996). “Seismic evaluation and retrofit of concrete buildings”, California Seismic Safety Commission, Vol-1. [4] Chandrashekaran, S. and Anubhab Roy, (2005). "Seismic evaluation of multi storey RC frame building using modal pushover
analysis". Non-linear Dynamics, Pp. 329-342.
[5] Charilaos Maniatakis, Psycharis, N. and Constantine Spyrakos, (2013). "Effect of higher modes on the seismic response and design of moment-resisting RC frame structures". National Technical University of Athens.
[6] Chopra, A.K. and Goel, (2002). “A modal pushover analysis procedure for estimating seismic demands for buildings”. Earthquake Engineering and Structural Dynamics, Vol.31, Pp. 561-582.
[7] Chopra, A.K. and Goel, (2004). "A modal Pushover analysis procedure for Seismic analysis of the buildings". Earthquake Engineering and Structural Dynamics, Vol. 33(8), Pp. 903–927.
[8] Chou, C.C. and Uang, C.M., (2002). "Establishing absorbed energy spectra-An attenuation approach". Earthquake Engineering and Structural Dynamics, Vol. 29(10), Pp. 1441–1455.