R E S E A R C H A R T I C L E
Open Access
Depressive symptoms in long term care
facilities in Western Canada: a cross
sectional study
Matthias Hoben
1, Abigail Heninger
2, Jayna Holroyd-Leduc
3,4,5,6, Jennifer Knopp-Sihota
7, Carole Estabrooks
1and
Zahra Goodarzi
4,5,6*Abstract
Background:The main objective is to better understand the prevalence of depressive symptoms, in long-term care (LTC) residents with or without cognitive impairment across Western Canada. Secondary objectives are to examine comorbidities and other factors associated with of depressive symptoms, and treatments used in LTC.
Methods:11,445 residents across a random sample of 91 LTC facilities, from 09/2014 to 05/2015, were stratified by owner-operator model (private for-profit, public or voluntary not-for-profit), size (small: < 80 beds, medium: 80–120 beds, large > 120 beds), location (Calgary and Edmonton Health Zones, Alberta; Fraser and Interior Health Regions, British Columbia; Winnipeg Health Region, Manitoba).
Random intercept generalized linear mixed models with depressive symptoms as the dependent variable, cognitive impairment as primary independent variable, and resident, care unit and facility characteristics as covariates were used. Resident variables came from the Resident Assessment Instrument–Minimum Data Set (RAI-MDS) 2.0 records (the RAI-MDS version routinely collected in Western Canadian LTC). Care unit and facility variables came from surveys completed with care unit or facility managers.
Results:Depressive symptoms affects 27.1% of all LTC residents and 23.3% of LTC resident have both, depressive symptoms and cognitive impairment. Hypertension, urinary and fecal incontinence were the most common comorbidities. Cognitive impairment increases the risk for depressive symptoms (adjusted odds ratio 1.65 [95% confidence interval 1.43; 1.90]). Pain, anxiety and pulmonary disorders were also significantly associated with depressive symptoms. Pharmacologic therapies were commonly used in those with depressive symptoms, however there was minimal use of non-pharmacologic management.
Conclusions:Depressive symptoms are common in LTC residents–particularly in those with cognitive impairment. Depressive symptoms are an important target for clinical intervention and further research to reduce the burden of these illnesses.
Keywords:Depression, Cognitive impairment, Long term care, Inter-RAI
© The Author(s). 2019Open AccessThis article is distributed under the terms of the Creative Commons Attribution 4.0 International License (http://creativecommons.org/licenses/by/4.0/), which permits unrestricted use, distribution, and reproduction in any medium, provided you give appropriate credit to the original author(s) and the source, provide a link to the Creative Commons license, and indicate if changes were made. The Creative Commons Public Domain Dedication waiver (http://creativecommons.org/publicdomain/zero/1.0/) applies to the data made available in this article, unless otherwise stated.
* Correspondence:[email protected]
4Hotchkiss Brain Institute, University of Calgary, Calgary, AB, Canada 5O’Brien Institute of Public Health, Calgary, AB, Canada
Background
Residents of long term care (LTC) facilities are often frail with multiple comorbidities, poor physical function, cognitive impairment and in many cases concomitant depression [1, 2]. It is estimated in Canada, that up to 44% of those living in LTC have depression [3]. Those living in LTC suffer reduced quality of life [3] and poor function [3] when they have co-morbid depression. Interestingly, the burden of depression is not specific to those who meet solely diagnostic criteria, as those with clinical symptoms also have poor quality of life [3]. Prevalence estimates may be conservative, as evidence suggests that depression is under-diagnosed [3] in LTC.
Depression frequently co-occurs with dementia [4]. In comparison to cognitively intact adults, those with demen-tia have over two times the risk of developing depression (odds ratio (OR) of 2.64 (95% confidence interval (CI) 2.43; 2.86)) [4]. Existing observational data suggest that depres-sion may be a risk factor for dementia, however depressive symptoms can also be early symptoms of dementia [5]. Res-idents in LTC commonly experience dementia, given this understanding depression as a comorbidity is important [6]. There are available tools to detect depression in LTC resi-dents [7, 8]; however, use of these tools is limited due to numerous barriers contributing to challenges in detection [9]. There are available therapies for depression in those with and without dementia [10–13]. There are several risk factors for depression in LTC, the most commonly studied are cognitive impairment, functional disability and baseline depression [14]. However few studies that examine psycho-logical, environmental factors [14].
Depression in LTC residents and in those with demen-tia is a target for research aimed at understanding this disease in context, to better target resources and im-prove diagnosis and treatment. A recent systematic re-view identified several studies examining the prevalence of depression in LTC, however reported no studies within the Canadian context [15]. The reported range of depression was 5–25% for major depression and 14–82% for depressive symptoms in these studies [15]. We were able to identify a Canadian Institute for Health Informa-tion (CIHI) report on depression in LTC, however this was focused only on Ontario, Nova Scotia, Manitoba, Saskatchewan and the Yukon [3]. This CIHI report fo-cuses on depressive symptoms as measured by the De-pression Rating Scale collected on the interRAI Resident Assessment Instrument Minimum Data Set, Version 2.0 from the Continuing Care Reporting System [3, 16]. They demonstrated that depressive symptoms were present in 44% of participants, with 26% having a de-pression diagnosis (n= 49,089) [3]. More evidence is needed examining the prevalence of depression in LTC in the western Canadian provinces. It is also unclear in the existing literature how the unit and facility level
factors impact depression on the larger scale. It is crucial to understand how depression affects persons living in LTC across Canada in order to inform policy development.
Our primary objectives are to (a) determine the current prevalence of depressive symptoms in LTC residents using cross sectional data across three western provinces, (b) and to understand how this prevalence differs with and without cognitive impairment.. Our secondary objectives were to (a) explore the relationship between depressive symptoms and other prevalent co-morbidities, (b) identify individual and facility factors, and to (c) examine the asso-ciation of depressive symptoms with available pharmaco-logic and non-pharmacopharmaco-logic treatments.
Methods
Ethics
Ethics approval was obtained for this study from the ap-propriate university bodies. Ethics approval was obtained for this study from the University of Calgary (CHREB17–0776) and prior approval for the data collec-tion from University of Alberta (PRO00037937) Univer-sity of British Columbia (H14–00942), and University of Manitoba (H24014:370(HS17856)).
Study design and setting
This is a cross-sectional analysis of data collected in a representative cohort of 91 urban nursing homes in Western Canada participating in the Translating Re-search in Elder Care (TREC) program of reRe-search [17]. TREC LTC facilities are randomly selected from lists that include all LTC facilities in the participating health regions. Lists are stratified by (a) health region (Calgary and Edmonton Zones in Alberta; Fraser and Interior Health Regions in British Columbia; Winnipeg Region Health Authority in Manitoba), (b) facility size (small, < 80 beds; medium, 80–120 beds; large, > 120 beds), and (c) owner-operator model (private for-profit, public not-for-profit, and voluntary not-for-profit).
Sample
data (not used in this study) and care unit and facility characteristics are collected using validated TREC surveys (details reported elsewhere).(17)We used the latest wave of TREC survey data collection (09/2014–05/2015). Of all resident assessments completed in this period, we in-cluded each resident’s latest assessment in this period. Our resident sample includes 11,445 nursing home resi-dents living on 325 care units in 91 nursing homes.
Outcomes and measures
Dependent variable
The dependent variable was depressive symptoms, mea-sured with the Depression Rating Scale (DRS) [21]. The DRS is created by summing the scores of seven items: (a) resident made negative statements (passive suicidal idea-tion), (b) persistent anger with self or others, (c) expres-sions of what appear to be unrealistic fears, (d) repetitive health complaints, (e) repetitive anxious complaints or concerns, (f) sad, pained, worried facial expressions, (g) crying, tearfulness. Each item can take on the scores of 0 (not exhibited in last 30 days), 1 (exhibited up to 5 days a week), or 2 (exhibited 6 or 7 days a week), leading to a possible range of the DRS of 0–14. US studies [22, 23] found acceptable specificity rates of the DRS (i.e., rate of residents correctly identified as not having depression > 80%) when compared with the Hamilton Depression Rat-ing Scale, [24,25] the Geriatric Depression Scale, [26,27] chart reviews, or gold standard clinical assessments by a psychiatrist. However, sensitivity of the DRS was low (i.e., rate of residents correctly identified as having depression < 50%) [22,23]. A recent review found 9 studies validating the DRS, of these studies most included a percentage of patients with dementia (15–70%), only one focused only on those with dementia [28]. A Canadian study found that the DRS at admission predicts a depression diagnosis at follow-up assessments [29]. The cut off for the DRS is≥3 for detection symptoms of depression, that are more than moderate [3,21]. Some recent work has shown that even a score of 1–2 can be predictive of patients developing de-pression. As a result of these latter two factors we dichoto-mized the DRS and used a cut-off score of≥2 to indicate presence of depressive symptoms [29]. Further sensitivity analyses are described below.
Primary independent variable
The primary independent variable was cognitive impair-ment, measured with the RAI-MDS 2.0 Cognitive Per-formance Scale (CPS) [30]. We preferred the CPS scale over the diagnosis of dementia variables, as dementia is underestimated by at least 11% in the Canadian RAI-MDS 2.0 [31]. Studies have repeatedly confirmed high reliability and validity of the CPS scale [32–34]. We cre-ated a dichotomous variable reflecting no cognitive im-pairment (CPS score < 2) or cognitive imim-pairment of any
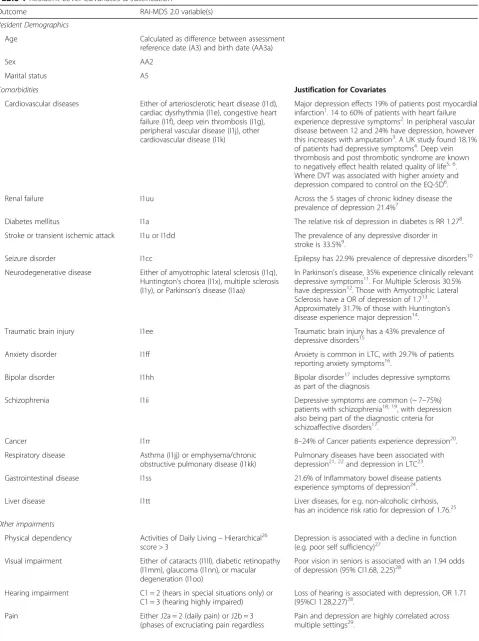
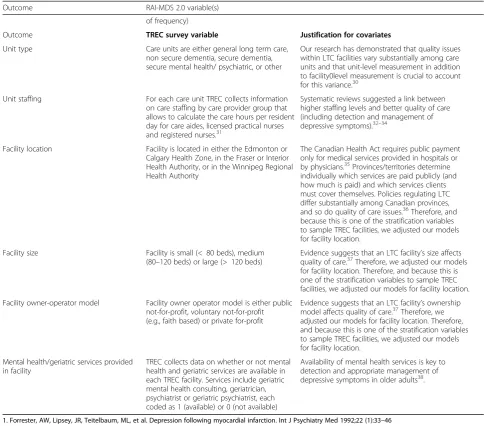
kind (mild to severe) (CPS score≥2). We chose this cut off to represent symptoms of cognitive impairment and this score has been found to be similar to the MMSE in the detection of cognitive impairment in LTC [35]. We adjusted our statistical models for RAI-MDS 2.0 vari-ables listed in Table1. These covariates were chosen, as they are relevant conditions that are linked to depression in prior studies. We chose to focus on comorbidities in these individuals as they are clearly defined in the data-bases and rigorously collected.
In addition to covariates (Table1) included in our statis-tical models, we assessed use of the following medications in residents with depressive symptoms: antidepressants, anti-psychotics, anti-anxiety medication (interRAI data). Looking at only residents with depressive symptoms we assessed the use of antidepressants, antipsychotics, anti-anxiety and pain medications. This was to see what medications those with depressive symptoms were prescribed. However, this has some limitations, as patients who are appropriately treated for depression may not have symptoms and thus not be de-tected here [36], additionally we cannot account for those started on antidepressants for other indications [37]. Finally, we assessed the following non-pharmacological treatments in residents with depressive symptoms: psychological ther-apy, special behavior symptom evaluation program, evalu-ation by a licensed mental health specialist in last 90 days, group therapy, resident-specific deliberate changes in envir-onment, and reorientation.
Unit-level covariates
We included the unit type as measured by our TREC unit survey. Units are categorized as either general long-term care, non-secure dementia, secure dementia, secure mental health/psychiatric, or other. We also added measures for staffing hours per resident day on each unit. We included separate measures for care aide, licensed practical nurse (LPN) and registered nurse (RN) hours per resident day [38].
Facility-level covariates
Facility location (health region), size, and owner-operator model were included as covariates (TREC Survey Data). Three dichotomous variables were added, indicating whether or not care was provided by a geriatrician, a psychiatrist, or a geriatric psychiatrist were available in a facility (interRAI data).
Statistical analyses
Table 1Resident Level Covariates & Justification
Outcome RAI-MDS 2.0 variable(s)
Resident Demographics
Age Calculated as difference between assessment
reference date (A3) and birth date (AA3a)
Sex AA2
Marital status A5
Comorbidities Justification for Covariates
Cardiovascular diseases Either of arteriosclerotic heart disease (I1d), cardiac dysrhythmia (I1e), congestive heart failure (I1f), deep vein thrombosis (I1g), peripheral vascular disease (I1j), other cardiovascular disease (I1k)
Major depression effects 19% of patients post myocardial infarction1. 14 to 60% of patients with heart failure experience depressive symptoms2. In peripheral vascular disease between 12 and 24% have depression, however this increases with amputation3. A UK study found 18.1% of patients had depressive symptoms4. Deep vein thrombosis and post thrombotic syndrome are known to negatively effect health related quality of life5, 6. Where DVT was associated with higher anxiety and depression compared to control on the EQ-5D6.
Renal failure I1uu Across the 5 stages of chronic kidney disease the
prevalence of depression 21.4%7
Diabetes mellitus I1a The relative risk of depression in diabetes is RR 1.278.
Stroke or transient ischemic attack I1u or I1dd The prevalence of any depressive disorder in stroke is 33.5%9.
Seizure disorder I1cc Epilepsy has 22.9% prevalence of depressive disorders10
Neurodegenerative disease Either of amyotrophic lateral sclerosis (I1q), Huntington’s chorea (I1x), multiple sclerosis (I1y), or Parkinson’s disease (I1aa)
In Parkinson’s disease, 35% experience clinically relevant depressive symptoms11. For Multiple Sclerosis 30.5% have depression12. Those with Amyotrophic Lateral Sclerosis have a OR of depression of 1.713. Approximately 31.7% of those with Huntington’s disease experience major depression14.
Traumatic brain injury I1ee Traumatic brain injury has a 43% prevalence of
depressive disorders15
Anxiety disorder I1ff Anxiety is common in LTC, with 29.7% of patients
reporting anxiety symptoms16.
Bipolar disorder I1hh Bipolar disorder17includes depressive symptoms
as part of the diagnosis
Schizophrenia I1ii Depressive symptoms are common (~ 7–75%)
patients with schizophrenia18, 19, with depression also being part of the diagnostic criteria for schizoaffective disorders17.
Cancer I1rr 8–24% of Cancer patients experience depression20.
Respiratory disease Asthma (I1jj) or emphysema/chronic obstructive pulmonary disease (I1kk)
Pulmonary diseases have been associated with depression21, 22and depression in LTC23.
Gastrointestinal disease I1ss 21.6% of Inflammatory bowel disease patients
experience symptoms of depression24.
Liver disease I1tt Liver diseases, for e.g. non-alcoholic cirrhosis,
has an incidence risk ratio for depression of 1.76.25
Other impairments
Physical dependency Activities of Daily Living–Hierarchical26 score > 3
Depression is associated with a decline in function (e.g. poor self sufficiency)27
Visual impairment Either of cataracts (I1ll), diabetic retinopathy (I1mm), glaucoma (I1nn), or macular degeneration (I1oo)
Poor vision in seniors is associated with an 1.94 odds of depression (95% CI1.68, 2.25)28
Hearing impairment C1 = 2 (hears in special situations only) or C1 = 3 (hearing highly impaired)
Loss of hearing is associated with depression, OR 1.71 (95%CI 1.28,2.27)28.
Pain Either J2a = 2 (daily pain) or J2b = 3
(phases of excruciating pain regardless
Table 1Resident Level Covariates & Justification(Continued)
Outcome RAI-MDS 2.0 variable(s)
of frequency)
Outcome TREC survey variable Justification for covariates
Unit type Care units are either general long term care, non secure dementia, secure dementia, secure mental health/ psychiatric, or other
Our research has demonstrated that quality issues within LTC facilities vary substantially among care units and that unit-level measurement in addition to facility0level measurement is crucial to account for this variance.30
Unit staffing For each care unit TREC collects information on care staffing by care provider group that allows to calculate the care hours per resident day for care aides, licensed practical nurses and registered nurses.31
Systematic reviews suggested a link between higher staffing levels and better quality of care (including detection and management of depressive symptoms).32–34
Facility location Facility is located in either the Edmonton or Calgary Health Zone, in the Fraser or Interior Health Authority, or in the Winnipeg Regional Health Authority
The Canadian Health Act requires public payment only for medical services provided in hospitals or by physicians.35Provinces/territories determine individually which services are paid publicly (and how much is paid) and which services clients must cover themselves. Policies regulating LTC differ substantially among Canadian provinces, and so do quality of care issues.36Therefore, and because this is one of the stratification variables to sample TREC facilities, we adjusted our models for facility location.
Facility size Facility is small (< 80 beds), medium (80–120 beds) or large (> 120 beds)
Evidence suggests that an LTC facility’s size affects quality of care.37Therefore, we adjusted our models for facility location. Therefore, and because this is one of the stratification variables to sample TREC facilities, we adjusted our models for facility location.
Facility owner-operator model Facility owner operator model is either public not-for-profit, voluntary not-for-profit (e.g., faith based) or private for-profit
Evidence suggests that an LTC facility’s ownership model affects quality of care.37Therefore, we adjusted our models for facility location. Therefore, and because this is one of the stratification variables to sample TREC facilities, we adjusted our models for facility location.
Mental health/geriatric services provided in facility
TREC collects data on whether or not mental health and geriatric services are available in each TREC facility. Services include geriatric mental health consulting, geriatrician, psychiatrist or geriatric psychiatrist, each coded as 1 (available) or 0 (not available)
Availability of mental health services is key to detection and appropriate management of depressive symptoms in older adults38.
1. Forrester, AW, Lipsey, JR, Teitelbaum, ML, et al. Depression following myocardial infarction. Int J Psychiatry Med 1992;22 (1):33–46 2. Delville, CL, McDougall, G. A systematic review of depression in adults with heart failure: instruments and incidence. Issues Ment Health Nurs 2008;29 (9):1002–1017
3. Pratt, AG, Norris, ER, Kaufmann, M. Peripheral vascular disease and depression. J Vasc Nurs 2005;23 (4):123–127; quiz 128–129
4. Ismail, H, Coulton, S. Arrhythmia care co-ordinators: Their impact on anxiety and depression, readmissions and health service costs. Eur J Cardiovasc Nurs 2016;15 (5):355–362
5. Kahn, SR, Hirsch, A, Shrier, I. Effect of postthrombotic syndrome on health-related quality of life after deep venous thrombosis. Arch Intern Med 2002;162 (10):1144–1148
6. Utne, KK, Tavoly, M, Wik, HS, et al. Health-related quality of life after deep vein thrombosis. Springerplus 2016;5 [1]:1278
7. Palmer, S, Vecchio, M, Craig, JC, et al. Prevalence of depression in chronic kidney disease: systematic review and meta-analysis of observational studies. Kidney Int 2013;84 (1):179–191
8. Hasan, SS, Mamun, AA, Clavarino, AM, et al. Incidence and risk of depression associated with diabetes in adults: evidence from longitudinal studies. Community Ment Health J 2015;51 (2):204–210
9. Mitchell, AJ, Sheth, B, Gill, J, et al. Prevalence and predictors of post-stroke mood disorders: A meta-analysis and meta-regression of depression, anxiety and adjustment disorder. Gen Hosp Psychiatry 2017;47:48–60
10. Scott, AJ, Sharpe, L, Hunt, C, et al. Anxiety and depressive disorders in people with epilepsy: A meta-analysis. Epilepsia 2017;58 (6):973–982
11. Reijnders, JS, Ehrt, U, Weber, WE, et al. A systematic review of prevalence studies of depression in Parkinson’s disease. Mov Disord 2008;23 (2):183–189; quiz 313
12. Boeschoten, RE, Braamse, AMJ, Beekman, ATF, et al. Prevalence of depression and anxiety in Multiple Sclerosis: A systematic review and meta-analysis. J Neurol Sci 2017;372:331–341
13. Roos, E, Mariosa, D, Ingre, C, et al. Depression in amyotrophic lateral sclerosis. Neurology 2016;86 [24]:2271–2277
14. Slaughter, JR, Martens, MP, Slaughter, KA. Depression and Huntington’s disease: prevalence, clinical manifestations, etiology, and treatment. CNS Spectr 2001;6 (4):306–326
Regional differences for each of the outcomes were assessed, using ANOVA for continuous outcomes that met assumptions of normality and homogeneity of vari-ances and Kruskal-Wallis tests for continuous outcomes that violated these assumptions. Fisher’s Exact tests were used tests for categorical outcomes. In residents with de-pressive symptoms, we assessed differences between resi-dents with and without cognitive impairment in addition to regional differences, using the same statistical methods.
To assess the association of cognitive impairment and of other covariates with depressive symptoms, a three-level random intercept generalized linear mixed models was run [40]. We used a logit link function due to the dichotomous dependent variable (depressive symptoms present or absent) and accounted for dependencies of assessments collected from residents nested within care units and care units nested within facilities by including random unit- and facility-level intercepts. To assess whether the nested model was statistically significantly differed from a non-nested (one-level) model, we per-formed a covariance test for model independence [41]. These tests indicated that accounting for the clustered structure of the data was necessary (p< 0.0001). We also calculated intra-cluster correlation coefficients for unit-and facility levels (i.e. level-specific variance divided by
the total variance). We assessed multicollinearity of model covariates by regressing all model covariates on our depressive symptoms variable, using a multiple lin-ear regression, and specified the collinlin-earity diagnostics (COLL) and variance inflation factor (VIF) options [42]. VIF values ≥10 are commonly considered an indicator that a collinearity problem may be present – although even higher VIF values have been discussed as accept-able [43]. Furthermore, variables with a condition index ≥10 that contribute strongly to the variance of two or more other variables (variance proportion > 0.5) also in-dicate collinearity problems [44]. Our analyses indicated no multicollinearity problem of our covariates. VIF values ranged between 1.015 (traumatic brain injury) and 4.231 (widowed marital status), and none of the var-iables explained a variance proportion of > 0.5 of two or more of the other variables. Due to the way RAI-MDS 2.0 data are collected and cleaned in Canada, our data set did not include any missing values. The complete-ness and integrity of RAI-MDS 2.0 items are extremely high in Canada due to universal use of electronic entry that only allows submission of an assessment when all items are populated with valid values [45]. Furthermore, the Canadian Institute for Health Information, the na-tional agency to which TREC facilities submit RAI-MDS 2.0 data, performs additional data checks on submitted
16. Smalbrugge, M, Pot, AM, Jongenelis, K, et al. Prevalence and correlates of anxiety among nursing home patients. J Affect Disord 2005;88 (2):145–153 17. American_Psychiatric_Association. Diagnostic and statistical manual of mental disorders: DSM-5. Washington, D.C: American Psychiatric Association, 2013 18. Hasan, A, Falkai, P, Wobrock, T, et al. World Federation of Societies of Biological Psychiatry (WFSBP) Guidelines for Biological Treatment of Schizophrenia. Part 3: Update 2015 Management of special circumstances: Depression, Suicidality, substance use disorders and pregnancy and lactation. The world journal of biological psychiatry: the official journal of the World Federation of Societies of Biological Psychiatry 2015;16 (3):142–170
19. Gregory, A, Mallikarjun, P, Upthegrove, R. Treatment of depression in schizophrenia: systematic review and meta-analysis. Br J Psychiatry 2017;211 (4):198–204 20. Krebber, AM, Buffart, LM, Kleijn, G, et al. Prevalence of depression in cancer patients: a meta-analysis of diagnostic interviews and self-report instruments. Psychooncology 2014;23 (2):121–130
21. Bozek, A, Rogala, B, Bednarski, P. Asthma, COPD and comorbidities in elderly people. J Asthma 2016;53 [9]:943–947
22. Matte, DL, Pizzichini, MM, Hoepers, AT, et al. Prevalence of depression in COPD: A systematic review and meta-analysis of controlled studies. Respir Med 2016;117:154–161
23. Barca, ML, Selbaek, G, Laks, J, et al. Factors associated with depression in Norwegian nursing homes. Int J Geriatr Psychiatry 2009;24 (4):417–425 24. Neuendorf, R, Harding, A, Stello, N, et al. Depression and anxiety in patients with Inflammatory Bowel Disease: A systematic review. J Psychosom Res 2016;87:70–80
25. Perng, CL, Shen, CC, Hu, LY, et al. Risk of depressive disorder following non-alcoholic cirrhosis: a nationwide population-based study. PLoS One 2014;9 (2):e88721
26. Morris, JN, Fries, BE, Morris, SA. Scaling ADLs within the MDS. Journals of Gerontology Series A, Biological Sciences and Medical Sciences 1999;54 (11):M546-M553
27. Canadian_Institute_for_Health_Information. Depression Among Seniors in Residential Care. 2010
28. Huang, CQ, Dong, BR, Lu, ZC, et al. Chronic diseases and risk for depression in old age: a meta-analysis of published literature. Ageing Res Rev. 2010;9 (2):131–141
29. Bair, MJ, Robinson, RL, Katon, W, et al. Depression and pain comorbidity: a literature review. Arch Intern Med 2003;163 [20]:2433–2445
30. Norton, PG, Murray, M, Doupe, MB, et al. Facility versus unit level reporting of quality indicators in nursing homes when performance monitoring is the goal. BMJ Open 2014;4 (2):e004488
31. Cummings, GG, Doupe, M, Ginsburg, L, et al. Development and Validation of A Scheduled Shifts Staffing (ASSiST) Measure of Unit-Level Staffing in Nursing Homes. Gerontologist 2017;57 (3):509–516
32. Bostick, JE, Rantz, MJ, Flesner, MK, et al. Systematic review of studies of staffing and quality in nursing homes. Journal of the American Medical Directors Association 2006;7 (6):366–376
33. Castle, NG. Nursing home caregiver staffing levels and quality of care - A literature review. J Appl Gerontol 2008;27 [4]:375–405
34. Spilsbury, K, Hewitt, C, Stirk, L, et al. The relationship between nurse staffing and quality of care in nursing homes: a systematic review. Int J Nurs Stud 2011;48 (6):732–750
35. Deber, R, B., Laporte, A. Funding long-term care in Canada: Who is responsible for what? HealthcarePapers 2016;15 [4]:36–40
36. Health Canada. Long-term facilities-based care;https://www.canada.ca/en/health-canada/services/home-continuing-care/long-term-facilities-based-care.html. Accessed 2017-04-06
37. Tanuseputro, P, Chalifoux, M, Bennett, C, et al. Hospitalization and Mortality Rates in Long-Term Care Facilities: Does For-Profit Status Matter? J Am Med Dir Assoc 2015;16 (10):874–883
records [45]. Hence, missing items were not an issue in our analyses. We first ran a model with only cognitive impairment included as dependent variable. We then added the other covariates one-by-one in a stepwise ap-proach (see Additional file 1 for parameter estimates of all models). For sensitivity analyses, we ran our final model again (see statistical analyses), and exchanged the dichotomous cognitive impairment variable based on a CPS cut-off≥2 by another dichotomous variable that in-dicated cognitive impairment if either (a) the CPS score was≥2 or (b) the resident had a diagnosis of dementia.
Results
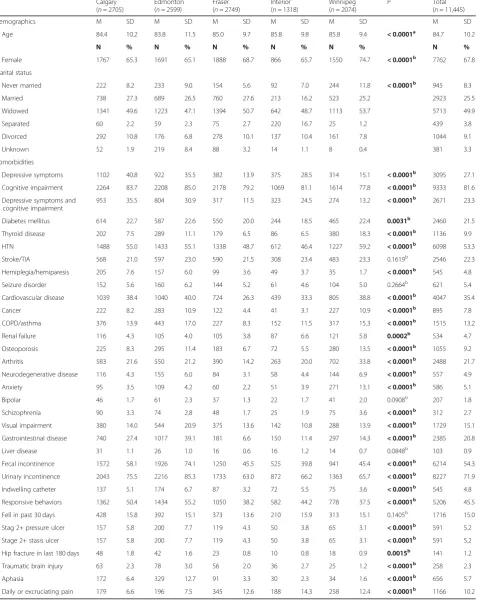
Description of sample characteristics (Table2)
Among the 11,445 residents, 67.8% (n= 7762) were fe-male with a mean age of 84.7 (SD 10.2). The majority of residents were widowed (49.9%) or married (25.5%). Overall 40.1% had depressive symptoms (n= 4594). Cog-nitive impairment was the most common comorbidity at 81.6% (n= 9333), which was similar across all locations. The proportion of residents with both depressive symp-toms and cognitive impairment was 34.8% (n= 3987). Several comorbidities had a prevalence of over 50%, in-cluding hypertension (53.3%), fecal (54.3%) and urinary incontinence (71.9%). Responsive behaviours were also common at 45.5%. Daily pain affected 10.2% of individ-uals and 15% had fallen in the past 30 days.
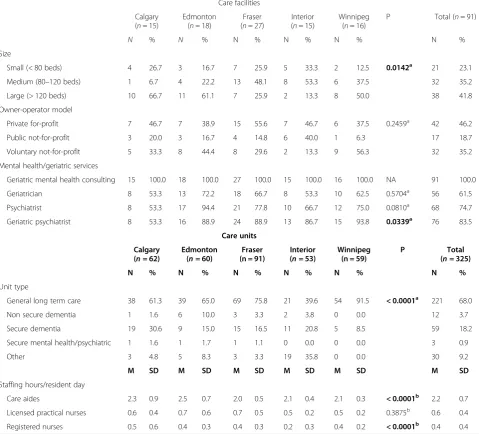
Description of LTC facilities (Table3)
Among the 91 facilities, most facilities were in the Fraser region (n= 27) and fewest in the interior of British Columbia and Calgary (n= 15 each). Majority of facilities were large (> 120 beds;n= 38). Of 91 facilities (n= 42) were private for-profit. All sites had access to geriatric mental health counselling services, but access to geriatricians, geri-atric psychiatrists and psychiatrists was variable. Most units were general LTC (68%;n= 220) or secure dementia units (18.2%;n= 59). Care aids, the major provider of direct care, provide a mean of 2.2 h of care per resident per day.
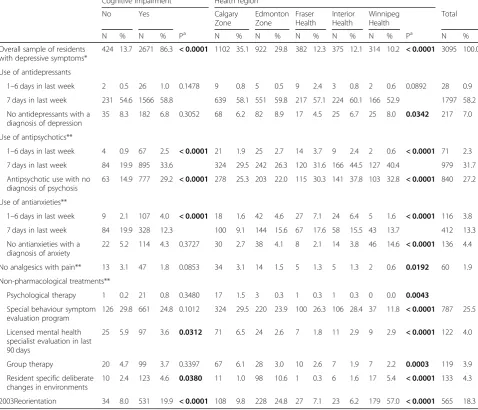
Pharmacologic and non-pharmacologic treatment for those with depressive symptoms (Table4)
When examining the 3095 residents with depressive symptoms, 86.3% (n= 2671) had cognitive impairment.
Of those who received an antidepressant, 58.2% received antidepressants daily. Of residents with depressive symp-toms 7.0% were not on antidepressants. This rate did not differ between residents with and without cognitive impair-ment. Few residents with depressive symptoms and pain were not receiving analgesics (1.8% in cognitively impaired). Non-pharmacologic strategies were less commonly used. In those with cognitive impairment, behaviour symptom evaluation programs were most commonly used (24.8%), followed by reorientation strategies (19.9%).
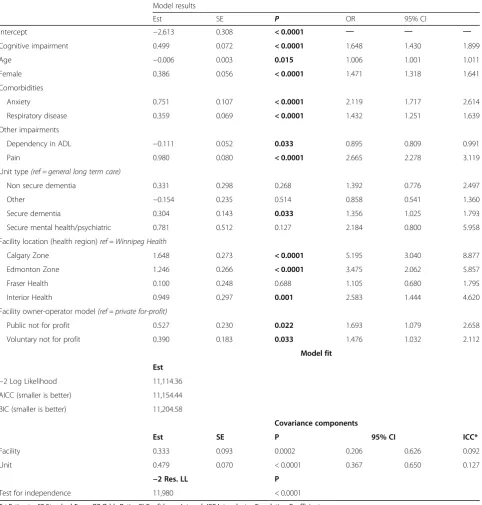
Influence of cognitive impairment and other resident, care unit and facility characteristics on depressive symptoms, based on generalized linear mixed models (Table5)
Our final model (Table5) indicates that the odds of experi-encing depressive symptoms were almost twice as high in people with cognitive impairment than in people without cognitive impairment. Higher age and female sex also in-crease the odds for depressive symptoms. Of the assessed comorbidities, only anxiety and respiratory disease were in-dependently associated with depressive symptoms (increased odds, as expected). Of the other impairments pain increased the odds for depressive symptoms and ADL impairment de-creased the odds of depressive symptoms. Residents living on secure dementia care units had higher odds of depressive symptoms than residents living on general long-term care units. Odds of depressive symptoms on other unit types did not differ from odds on general long-term care units.
The model with unit-level variables included (Additional file1, Model 6) suggested that an increase of care aide hours per resi-dent day decreased the risk for depressive symptoms. However, this variable was no longer significant when facility variables were added (final model, Table5). Compared to the Winnipeg Health Region, residents living in a nursing home located in the Calgary and Edmonton Health Zones and in the Interior Health Region have a substantially higher odds of depressive symptoms. The odds of depressive symptoms are also higher for residents living in a public or voluntary not-for profit facility, as compared to a private for-profit facility. Facility size and services provided were not statistically significant predictors of depressive symptoms.
Discussion
Depression in those living in LTC is a complex disease af-fected by cognitive impairment, multi-morbidity, frailty, and environmental factors. The prevalence of depressive symptoms in LTC is consistently high ranging with a me-dian prevalence of 29% [15]. Our results demonstrate that 27.1% of LTC residents experience depressive symptoms. Nearly 80 % of all LTC residents have cognitive impair-ment, and of those 23.3% experience depressive symp-toms. This estimate furthers our understanding of depression in LTC and what factors may affect these symptoms. This is of critical importance as these other factors may be an important component of developing fu-ture intervention studies and management strategies.
Table 2Description of Sample Characteristics
Calgary (n= 2705)
Edmonton (n= 2599)
Fraser (n= 2749)
Interior (n= 1318)
Winnipeg (n= 2074)
P Total
(n= 11,445)
Demographics M SD M SD M SD M SD M SD M SD
Age 84.4 10.2 83.8 11.5 85.0 9.7 85.8 9.8 85.8 9.4 < 0.0001a
84.7 10.2
N % N % N % N % N % N %
Female 1767 65.3 1691 65.1 1888 68.7 866 65.7 1550 74.7 < 0.0001b
7762 67.8
Marital status
Never married 222 8.2 233 9.0 154 5.6 92 7.0 244 11.8 < 0.0001b
945 8.3
Married 738 27.3 689 26.5 760 27.6 213 16.2 523 25.2 2923 25.5
Widowed 1341 49.6 1223 47.1 1394 50.7 642 48.7 1113 53.7 5713 49.9
Separated 60 2.2 59 2.3 75 2.7 220 16.7 25 1.2 439 3.8
Divorced 292 10.8 176 6.8 278 10.1 137 10.4 161 7.8 1044 9.1
Unknown 52 1.9 219 8.4 88 3.2 14 1.1 8 0.4 381 3.3
Comorbidities
Depressive symptoms 1102 40.8 922 35.5 382 13.9 375 28.5 314 15.1 < 0.0001b
3095 27.1
Cognitive impairment 2264 83.7 2208 85.0 2178 79.2 1069 81.1 1614 77.8 < 0.0001b
9333 81.6
Depressive symptoms and cognitive impairment
953 35.5 804 30.9 317 11.5 323 24.5 274 13.2 < 0.0001b
2671 23.3
Diabetes mellitus 614 22.7 587 22.6 550 20.0 244 18.5 465 22.4 0.0031b
2460 21.5
Thyroid disease 202 7.5 289 11.1 179 6.5 86 6.5 380 18.3 < 0.0001b 1136 9.9
HTN 1488 55.0 1433 55.1 1338 48.7 612 46.4 1227 59.2 < 0.0001b
6098 53.3
Stroke/TIA 568 21.0 597 23.0 590 21.5 308 23.4 483 23.3 0.1619b
2546 22.3
Hemiplegia/hemiparesis 205 7.6 157 6.0 99 3.6 49 3.7 35 1.7 < 0.0001b
545 4.8
Seizure disorder 152 5.6 160 6.2 144 5.2 61 4.6 104 5.0 0.2664b
621 5.4
Cardiovascular disease 1039 38.4 1040 40.0 724 26.3 439 33.3 805 38.8 < 0.0001b 4047 35.4
Cancer 222 8.2 283 10.9 122 4.4 41 3.1 227 10.9 < 0.0001b
895 7.8
COPD/asthma 376 13.9 443 17.0 227 8.3 152 11.5 317 15.3 < 0.0001b
1515 13.2
Renal failure 116 4.3 105 4.0 105 3.8 87 6.6 121 5.8 0.0002b
534 4.7
Osteoporosis 225 8.3 295 11.4 183 6.7 72 5.5 280 13.5 < 0.0001b
1055 9.2
Arthritis 583 21.6 550 21.2 390 14.2 263 20.0 702 33.8 < 0.0001b 2488 21.7
Neurodegenerative disease 116 4.3 155 6.0 84 3.1 58 4.4 144 6.9 < 0.0001b
557 4.9
Anxiety 95 3.5 109 4.2 60 2.2 51 3.9 271 13.1 < 0.0001b
586 5.1
Bipolar 46 1.7 61 2.3 37 1.3 22 1.7 41 2.0 0.0908b
207 1.8
Schizophrenia 90 3.3 74 2.8 48 1.7 25 1.9 75 3.6 < 0.0001b
312 2.7
Visual impairment 380 14.0 544 20.9 375 13.6 142 10.8 288 13.9 < 0.0001b 1729 15.1
Gastrointestinal disease 740 27.4 1017 39.1 181 6.6 150 11.4 297 14.3 < 0.0001b
2385 20.8
Liver disease 31 1.1 26 1.0 16 0.6 16 1.2 14 0.7 0.0848b
103 0.9
Fecal incontinence 1572 58.1 1926 74.1 1250 45.5 525 39.8 941 45.4 < 0.0001b
6214 54.3
Urinary incontinence 2043 75.5 2216 85.3 1733 63.0 872 66.2 1363 65.7 < 0.0001b
8227 71.9
Indwelling catheter 137 5.1 174 6.7 87 3.2 72 5.5 75 3.6 < 0.0001b 545 4.8
Responsive behaviors 1362 50.4 1434 55.2 1050 38.2 582 44.2 778 37.5 < 0.0001b
5206 45.5
Fell in past 30 days 428 15.8 392 15.1 373 13.6 210 15.9 313 15.1 0.1405b
1716 15.0
Stag 2+ pressure ulcer 157 5.8 200 7.7 119 4.3 50 3.8 65 3.1 < 0.0001b
591 5.2
Stage 2+ stasis ulcer 157 5.8 200 7.7 119 4.3 50 3.8 65 3.1 < 0.0001b
591 5.2
Hip fracture in last 180 days 48 1.8 42 1.6 23 0.8 10 0.8 18 0.9 0.0015b 141 1.2
Traumatic brain injury 63 2.3 78 3.0 56 2.0 36 2.7 25 1.2 < 0.0001b
258 2.3
Aphasia 172 6.4 329 12.7 91 3.3 30 2.3 34 1.6 < 0.0001b
656 5.7
Daily or excruciating pain 179 6.6 196 7.5 345 12.6 188 14.3 258 12.4 < 0.0001b
1166 10.2
aP
value is based on an Analysis of Variance (ANOVA) b
Pvalue is based on a Fisher’s Exact test
depressive symptoms’ [3]. Our results identify a lower prevalence of depression, it is possible there is geo-graphic differences in depression. Additionally the ana-lyses presented here are from the 2014–2015 TREC data, where as the CIHI report is from 2008 to 2009 [3]. Interestingly the recent‘Quick Stats’CIHI data, which is available online, demonstrates a similar prevalence of de-pressive symptoms in residential care across to this current analysis multiple provinces 26.2% [16].
Anxiety and pulmonary diseases were independently associated with depressive symptoms. Anxiety is often comorbid with depression in those living in LTC, with 5.1% of cases overlapping (when using strict criteria)
[46]. Here, anxiety increased the odds of depression to 2.12 (95%CI 1.72, 2.61). Given anxiety is common in LTC [46] and in those experiencing dementia, [47] this overlap is important from a clinical perspective. Perhaps there should be consideration of screening for both de-pressive and anxiety symptoms in LTC residents. Of interest, pulmonary diseases were associated with de-pressive symptoms (1.43; 95% CI 1.25, 1.64). The associ-ation of depression and pulmonary disease in LTC was previously noted in other studies [48–50]. This associ-ation could be attributable to the symptoms, treatment or prognosis of pulmonary disease, thus additional study is needed.
Table 3Description of LTC Facilities
Care facilities
Calgary (n= 15)
Edmonton (n= 18)
Fraser (n= 27)
Interior (n= 15)
Winnipeg (n= 16)
P Total (n= 91)
N % N % N % N % N % N %
Size
Small (< 80 beds) 4 26.7 3 16.7 7 25.9 5 33.3 2 12.5 0.0142a 21 23.1
Medium (80–120 beds) 1 6.7 4 22.2 13 48.1 8 53.3 6 37.5 32 35.2
Large (> 120 beds) 10 66.7 11 61.1 7 25.9 2 13.3 8 50.0 38 41.8
Owner-operator model
Private for-profit 7 46.7 7 38.9 15 55.6 7 46.7 6 37.5 0.2459a 42 46.2
Public not-for-profit 3 20.0 3 16.7 4 14.8 6 40.0 1 6.3 17 18.7
Voluntary not-for-profit 5 33.3 8 44.4 8 29.6 2 13.3 9 56.3 32 35.2
Mental health/geriatric services
Geriatric mental health consulting 15 100.0 18 100.0 27 100.0 15 100.0 16 100.0 NA 91 100.0
Geriatrician 8 53.3 13 72.2 18 66.7 8 53.3 10 62.5 0.5704a 56 61.5
Psychiatrist 8 53.3 17 94.4 21 77.8 10 66.7 12 75.0 0.0810a 68 74.7
Geriatric psychiatrist 8 53.3 16 88.9 24 88.9 13 86.7 15 93.8 0.0339a 76 83.5
Care units
Calgary (n= 62)
Edmonton (n= 60)
Fraser (n = 91)
Interior (n= 53)
Winnipeg (n = 59)
P Total
(n= 325)
N % N % N % N % N % N %
Unit type
General long term care 38 61.3 39 65.0 69 75.8 21 39.6 54 91.5 < 0.0001a 221 68.0
Non secure dementia 1 1.6 6 10.0 3 3.3 2 3.8 0 0.0 12 3.7
Secure dementia 19 30.6 9 15.0 15 16.5 11 20.8 5 8.5 59 18.2
Secure mental health/psychiatric 1 1.6 1 1.7 1 1.1 0 0.0 0 0.0 3 0.9
Other 3 4.8 5 8.3 3 3.3 19 35.8 0 0.0 30 9.2
M SD M SD M SD M SD M SD M SD
Staffing hours/resident day
Care aides 2.3 0.9 2.5 0.7 2.0 0.5 2.1 0.4 2.1 0.3 < 0.0001b 2.2 0.7
Licensed practical nurses 0.6 0.4 0.7 0.6 0.7 0.5 0.5 0.2 0.5 0.2 0.3875b 0.6 0.4
Registered nurses 0.5 0.6 0.4 0.3 0.4 0.3 0.2 0.3 0.4 0.2 < 0.0001b 0.4 0.4
a
Pvalue is based on a Fisher’s Exact test b
Pvalue is based on a Kruskal-Wallis test
Pain was independently associated with depressive symptoms (OR 2.67; 95% CI 2.28, 3.12). Similarly an-other study found that those with pain in LTC are 2.83 times more likely to have prevalent depression [51]. This is a key finding, as the management of residents with de-pressive symptoms related to pain may need a different approach. However, further research is needed to exam-ine the effectiveness of this treatment approach on both mood and pain, and this approach cannot be recom-mended based on these results alone.
Of those with depressive symptoms and cognitive im-pairment, 58.8%, with only 7% of people receiving anti-depressants without a diagnosis of depression. Here we examine depressive symptoms and not confirmed
depression diagnoses, thus it is expected some residents may not be on treatment. Similarly, persons who are on treatment for depression and not exhibiting depressive symptoms would not be represented in this estimate.
Approximately one third of residents with depressive symptoms and cognitive impairment were receiving anti-psychotics for 7 days in the past week. Evidence sur-rounding the use of antipsychotics in the elderly, specifically those with dementia, suggests increased risk of morbidity and mortality therefore it is important to ensure appropriate use of these drugs [52]. However, this data does not identify the reasons for prescription of an-tipsychotics, thus we are not able to look at those associ-ations based on these data.
Table 4Pharmacologic and Non-Pharmacologic treatment for those with depressive symptoms Cognitive impairment Health region
No Yes Calgary
Zone
Edmonton Zone
Fraser Health
Interior Health
Winnipeg Health
Total
N % N % Pa N % N % N % N % N % Pa N %
Overall sample of residents with depressive symptoms*
424 13.7 2671 86.3 < 0.0001 1102 35.1 922 29.8 382 12.3 375 12.1 314 10.2 < 0.0001 3095 100.0
Use of antidepressants
1–6 days in last week 2 0.5 26 1.0 0.1478 9 0.8 5 0.5 9 2.4 3 0.8 2 0.6 0.0892 28 0.9
7 days in last week 231 54.6 1566 58.8 639 58.1 551 59.8 217 57.1 224 60.1 166 52.9 1797 58.2
No antidepressants with a diagnosis of depression
35 8.3 182 6.8 0.3052 68 6.2 82 8.9 17 4.5 25 6.7 25 8.0 0.0342 217 7.0
Use of antipsychotics**
1–6 days in last week 4 0.9 67 2.5 < 0.0001 21 1.9 25 2.7 14 3.7 9 2.4 2 0.6 < 0.0001 71 2.3
7 days in last week 84 19.9 895 33.6 324 29.5 242 26.3 120 31.6 166 44.5 127 40.4 979 31.7
Antipsychotic use with no diagnosis of psychosis
63 14.9 777 29.2 < 0.0001 278 25.3 203 22.0 115 30.3 141 37.8 103 32.8 < 0.0001 840 27.2
Use of antianxieties**
1–6 days in last week 9 2.1 107 4.0 < 0.0001 18 1.6 42 4.6 27 7.1 24 6.4 5 1.6 < 0.0001 116 3.8
7 days in last week 84 19.9 328 12.3 100 9.1 144 15.6 67 17.6 58 15.5 43 13.7 412 13.3
No antianxieties with a diagnosis of anxiety
22 5.2 114 4.3 0.3727 30 2.7 38 4.1 8 2.1 14 3.8 46 14.6 < 0.0001 136 4.4
No analgesics with pain** 13 3.1 47 1.8 0.0853 34 3.1 14 1.5 5 1.3 5 1.3 2 0.6 0.0192 60 1.9
Non-pharmacological treatments**
Psychological therapy 1 0.2 21 0.8 0.3480 17 1.5 3 0.3 1 0.3 1 0.3 0 0.0 0.0043
Special behaviour symptom evaluation program
126 29.8 661 24.8 0.1012 324 29.5 220 23.9 100 26.3 106 28.4 37 11.8 < 0.0001 787 25.5
Licensed mental health specialist evaluation in last 90 days
25 5.9 97 3.6 0.0312 71 6.5 24 2.6 7 1.8 11 2.9 9 2.9 < 0.0001 122 4.0
Group therapy 20 4.7 99 3.7 0.3397 67 6.1 28 3.0 10 2.6 7 1.9 7 2.2 0.0003 119 3.9
Resident specific deliberate changes in environments
10 2.4 123 4.6 0.0380 11 1.0 98 10.6 1 0.3 6 1.6 17 5.4 < 0.0001 133 4.3
2003Reorientation 34 8.0 531 19.9 < 0.0001 108 9.8 228 24.8 27 7.1 23 6.2 179 57.0 < 0.0001 565 18.3
*Percentages are based on overall sample (n= 3095 residents with depressive symptoms) **Percentages are based on total number of residents in the respective column category a
P values are based on a Fisher’s Exact test
The pharmacologic management of depression is only part of the picture. Non-pharmacologic therapies are also recommended and effective [10]. However, there appeared to be little access to these therapies and not all LTC sites had access to specialty mental health re-sources. In the CIHI study of depression in residential
care, mental health services and non-pharmacologic treatment strategies were also rarely employed [3]. There appears to be a care gap related to the underuse non-pharmacological management. Exploring the lack of availability or use of these services may be key to under-standing and developing an approach to improve access.
Table 5Influence of cognitive impairment and other resident, care unit and facility characteristics on depressive symptoms, based on generalized linear mixed models
Model results
Est SE P OR 95% CI
Intercept −2.613 0.308 < 0.0001 ─ ─ ─
Cognitive impairment 0.499 0.072 < 0.0001 1.648 1.430 1.899
Age −0.006 0.003 0.015 1.006 1.001 1.011
Female 0.386 0.056 < 0.0001 1.471 1.318 1.641
Comorbidities
Anxiety 0.751 0.107 < 0.0001 2.119 1.717 2.614
Respiratory disease 0.359 0.069 < 0.0001 1.432 1.251 1.639
Other impairments
Dependency in ADL −0.111 0.052 0.033 0.895 0.809 0.991
Pain 0.980 0.080 < 0.0001 2.665 2.278 3.119
Unit type(ref = general long term care)
Non secure dementia 0.331 0.298 0.268 1.392 0.776 2.497
Other −0.154 0.235 0.514 0.858 0.541 1.360
Secure dementia 0.304 0.143 0.033 1.356 1.025 1.793
Secure mental health/psychiatric 0.781 0.512 0.127 2.184 0.800 5.958
Facility location (health region)ref = Winnipeg Health
Calgary Zone 1.648 0.273 < 0.0001 5.195 3.040 8.877
Edmonton Zone 1.246 0.266 < 0.0001 3.475 2.062 5.857
Fraser Health 0.100 0.248 0.688 1.105 0.680 1.795
Interior Health 0.949 0.297 0.001 2.583 1.444 4.620
Facility owner-operator model(ref = private for-profit)
Public not for profit 0.527 0.230 0.022 1.693 1.079 2.658
Voluntary not for profit 0.390 0.183 0.033 1.476 1.032 2.112
Model fit
Est
−2 Log Likelihood 11,114.36
AICC (smaller is better) 11,154.44
BIC (smaller is better) 11,204.58
Covariance components
Est SE P 95% CI ICC*
Facility 0.333 0.093 0.0002 0.206 0.626 0.092
Unit 0.479 0.070 < 0.0001 0.367 0.650 0.127
−2 Res. LL P
Test for independence 11,980 < 0.0001
Limitations
This study is unique in that we examine a large popula-tion of LTC residents in Western Canada, the prevalence of depressive symptoms and explore the association with co-morbidities, facility and treatment factors. In this study, we can only look at associations and not caus-ation, and cannot assert specific conclusions about the effect of diseases on depression or treatment over time. We used the MDS-RAI 2.0 to estimate the prevalence of symptoms, which is a common practice in this popula-tion. Although RAI tool administration is standardized and rigorously applied, we cannot control for specific site or unit differences in training, nor the tool accuracy. The DRS has been criticized for its accuracy [28]. This is when examining the accuracy of diagnosing depression, however here we used the DRS to approximate depres-sive symptoms in residents.
Conclusions
Depressive symptoms are common in LTC residents. Not surprisingly, cognitive impairment is an independ-ent predictor of depressive symptoms. For those experi-encing depressive symptoms, our study has identified several associations with co-morbidities, facility level is-sues and treatment that warrant in depth study. These represent important targets for future study to both understand and develop better resources to aid in redu-cing the burden of depression. Understanding that these symptoms are common and the current gaps in related care is key to LTC resource planning.
Supplementary information
Supplementary informationaccompanies this paper athttps://doi.org/10. 1186/s12877-019-1298-5.
Additional file 1.
Abbreviations
CIHI:Canadian Institute for Health Information; DRS: Depression Rating Scale.; LTC: Long Term Care; OR: Odds Ratio; RAI-MDS: Resident Assessment Instrument–Minimum Data Set; TREC: Translating Research in Elder Care
Acknowledgements
We would like to thank Joseph Akinlawon for aiding us in accessing the data.
Authors’contributions
MH, ZG and JHL were responsible for the study idea, and design. AH, ZG, MH, JKS, JHL planned out the study proposal, and analysis plan (e.g. selecting covariates). MH and AH were responsible for data cleaning, organization and analysis. MH, ZG and JHL were involved in initial interpretation of results. CE obtained the funding for the study from which the data were drawn and is the principle investigator of that study. All study authors were involved in the drafting of the manuscript and final
interpretation. All authors read and approved the final manuscript.
Funding
No funding was used to complete this study directly other than the summer student stipend as outlined below.
Availability of data and materials
These data are not available for public access due to the existing ethics approval and policies of TREC.
Ethics approval and consent to participate
Ethics approval was obtained for this study from the University of Calgary (CHREB17–0776) and prior approval for the data collection from University of Alberta (PRO00037937) University of British Columbia (H14–00942), and University of Manitoba (H24014:370(HS17856)).
Consent for publication
Not applicable.
Competing interests
ZG has funding for research from the Hotchkiss Brain Institute, the MSI Foundation and the Critical Care Strategic Clinical Network. MH is funded by TREC as a post doctoral trainee. AH had funding from TREC for a summer studentship for the duration of the project. Carole A Estabrooks holds a CIHR Canada Research Chair in Knowledge Translation (Tier 1). JHL an JKS have no disclosures.
Author details
1Faculty of Nursing, University of Alberta, Edmonton, Canada.2Faculty of Science, University of British Columbia, Vancouver, Canada.3Department of Community Health Sciences, University of Calgary, Calgary, Canada. 4Hotchkiss Brain Institute, University of Calgary, Calgary, AB, Canada.5O’Brien Institute of Public Health, Calgary, AB, Canada.6Cumming School of Medicine, University of Calgary, Calgary, AB, Canada.7Faculty of Health Disciplines, Athabasca University, Athabasca, Canada.
Received: 16 October 2018 Accepted: 30 September 2019
References
1. Estabrooks CA, Poss JW, Squires JE, Teare GF, Morgan DG, Stewart N, et al. A profile of residents in prairie nursing homes. Canadian Journal on Aging. 2013;32(3):223–31.
2. Hirdes JP, Mitchell L, Maxwell CJ, White N. Beyond the 'iron lungs of gerontology': using evidence to shape the future of nursing homes in Canada. Canadian Journal on Aging. 2011;30(3):371–90.
3. Canadian_Institute_for_Health_Information. Depression Among Seniors in Residential Care2010 December 19, 2017. Available from:https://secure.cihi. ca/free_products/ccrs_depression_among_seniors_e.pdf.
4. Snowden MB, Atkins DC, Steinman LE, Bell JF, Bryant LL, Copeland C, et al. Longitudinal Association of Dementia and Depression. Am J Geriatr Psychiatry. 2015;23(9):897–905.
5. Livingston G, Sommerlad A, Orgeta V, Costafreda SG, Huntley J, Ames D, et al. Dementia prevention, intervention, and care. Lancet. 2017;390(10113):2673–734. 6. Society A. Rising Tide: The Impact of Dementia on Canadian Society2008.
Available from:http://www.alzheimer.ca/sites/default/files/Files/national/ Advocacy/ASC_Rising_Tide_Full_Report_e.pdf.
7. Goodarzi ZS, Mele BS, Roberts DJ, Holroyd-Leduc J. Depression case finding in individuals with dementia: a systematic review and meta-analysis. J Am Geriatr Soc. 2017;65(5):937–48.
8. Jeon YH, Li Z, Low LF, Chenoweth L, O'Connor D, Beattie E, et al. The clinical utility of the Cornell scale for depression in dementia as a routine assessment in nursing homes. Am J Geriatr Psychiatry. 2015;23(8):784–93. 9. Colon-Emeric CS, Lekan D, Utley-Smith Q, Ammarell N, Bailey D, Corazzini K,
et al. Barriers to and facilitators of clinical practice guideline use in nursing homes. J Am Geriatr Soc. 2007;55(9):1404–9.
10. Goodarzi Z, Mele B, Guo S, Hanson H, Jette N, Patten S, et al. Guidelines for dementia or Parkinson's disease with depression or anxiety: a systematic review. BMC Neurol. 2016;16(1):244.
11. Orgeta V, Qazi A, Spector A, Orrell M. Psychological treatments for depression and anxiety in dementia and mild cognitive impairment: systematic review and meta-analysis. Br J Psychiatry. 2015;207(4):293–8. 12. American Geriatrics S. American Association for Geriatric P. Consensus
13. Simning A, Simons KV. Treatment of depression in nursing home residents without significant cognitive impairment: a systematic review. Int Psychogeriatr. 2017;29(2):209–26.
14. Chau R, Kissane DW, Davison TE. Risk factors for depression in long-term care: a systematic review. Clin Gerontol. 2018:1–14.
15. Seitz D, Purandare N, Conn D. Prevalence of psychiatric disorders among older adults in long-term care homes: a systematic review. Int Psychogeriatr. 2010;22(7):1025–39.
16. CCRS Continuing Care Reporting System: Profile of Residents in Continuing Care Facilities 2017–2018. [Internet]. CIHI. 2018.
17. Estabrooks CA, Squires JE, Cummings GG, Teare GF, Norton PG. Study protocol for the translating research in elder care (TREC): building context– an organizational monitoring program in long-term care project (project one). Implement Sci. 2009;4(1):52.
18. Canadian Institute for Health Information. Resident Assessment Instrument (RAI) RAI-MDS 2.0 User's Manual, Canadian Version. Ottawa, ON: CIHI; 2012. 19. Centers for Medicare & Medicaid Services (CMS). Long-term care facility
resident assessment instrument 3.0 User’s manual (version 1.14, 2016). Baltimore, MD: CMS; 2017.
20. interRAI. Instruments: Long-Term Care Facilities (LTCF) 2016 [Available from:
http://www.interrai.org/long-term-care-facilities.html.
21. Burrows AB, Morris JN, Simon SE, Hirdes JP, Phillips C. Development of a minimum data set-based depression rating scale for use in nursing homes. Age Ageing. 2000;29(2):165–72.
22. Anderson RL, Buckwalter KC, Buchanan RJ, Maas ML, Imhof SL. Validity and reliability of the minimum data set depression rating scale (MDSDRS) for older adults in nursing homes. Age Ageing. 2003;32(4):435–8. 23. Watson LC, Zimmerman S, Cohen LW, Dominik R. Practical depression
screening in residential care/assisted living: five methods compared with gold standard diagnoses. Am J Geriatr Psychiatry. 2009;17(7):556–64. 24. Hamilton M. Development of a rating scale for primary depressive illness. Br
J Soc Clin Psychol. 1967;6(4):278–96.
25. Mulsant BH, Sweet R, Rifai AH, Pasternak RE, McEachran A, Zubenko GS. The use of the Hamilton rating scale for depression in elderly patients with cognitive impairment and physical illness. Am J Geriatr Psychiatry. 1994;2(3):220–9. 26. Yesavage JA, Brink TL, Rose TL, Lum O, Huang V, Adey M, et al.
Development and validation of a geriatric depression screening scale: a preliminary report. J Psychiatr Res. 1982;17(1):37–49.
27. Feher EP, Larrabee GJ, Crook TH 3rd. Factors attenuating the validity of the geriatric depression scale in a dementia population. J Am Geriatr Soc. 1992;40(9):906–9. 28. Penny K, Barron A, Higgins AM, Gee S, Croucher M. Cheung G. Convergent
Validity: Concurrent Validity, and Diagnostic Accuracy of the interRAI Depression Rating Scale. J Geriatr Psychiatry Neurol; 2016.
29. Martin L, Poss JW, Hirdes JP, Jones RN, Stones MJ, Fries BE. Predictors of a new depression diagnosis among older adults admitted to complex continuing care: implications for the depression rating scale (DRS). Age Ageing. 2008;37(1):51–6. 30. Morris JN, Fries BE, Mehr DR, Hawes C, Phillips C, Mor V, et al. MDS cognitive
performance scale. J Gerontol A Biol Sci Med Sci. 1994;49(4):M174–M82. 31. Bartfay E, Bartfay WJ, Gorey KM. Prevalence and correlates of potentially undetected dementia among residents of institutional care facilities in Ontario, Canada, 2009-2011. International journal of geriatric psychiatry. 2013;28(10):1086–94.
32. Mor V. A comprehensive clinical assessment tool to inform policy and practice: applications of the minimum data set. Med Care. 2004;42(Suppl. 4):50–9. 33. Poss JW, Jutan NM, Hirdes JP, Fries BE, Morris JN, Teare GF, et al. A review of
evidence on the reliability and validity of minimum data set data. Healthc Manage Forum. 2008;21(1):33–9.
34. Shin JH, Scherer Y. Advantages and disadvantages of using MDS data in nursing research. J Gerontol Nurs. 2009;35(1):7–17.
35. Paquay L, De Lepeleire J, Schoenmakers B, Ylieff M, Fontaine O, Buntinx F. Comparison of the diagnostic accuracy of the cognitive performance scale (minimum data set) and the mini-mental state exam for the detection of cognitive impairment in nursing home residents. Int J Geriatr Psychiatry. 2007;22(4):286–93. 36. Beck CA, Patten SB. Adjustment to antidepressant utilization rates to
account for depression in remission. Compr Psychiatry. 2004;45(4):268–74. 37. Patten SB, Wang JL, Williams JV, Lavorato DH, Beck CA, Bulloch AG.
Frequency of antidepressant use in relation to recent and past major depressive episodes. Can J Psychiatr. 2010;55(8):532–5.
38. Cummings GG, Doupe M, Ginsburg L, McGregor MJ, Norton PG, Estabrooks CA. Development and validation of a scheduled shifts staffing (ASSiST) measure of unit-level staffing in nursing homes. Gerontologist. 2017;57(3):509–16.
39. Miu DK, Chan CK. Prognostic value of depressive symptoms on mortality, morbidity and nursing home admission in older people. Geriatr Gerontol Int. 2011;11(2):174–9.
40. Hox JJ. Multilevel Analysis: Techniques and Applications. 2. Auflage ed. New York, Hove: Routledge; 2010. X, 382 S. p.
41. SAS. SAS/STAT(R) 9.2 User's Guide: COVTEST Statement [Available from:
https://support.sas.com/documentation/cdl/en/statug/63033/HTML/default/ viewer.htm- statug_glimmix_sect001.htm.
42. SAS. SAS/STAT(R) 9.2 User's Guide - Collinearity Diagnostics [Available from:
https://support.sas.com/documentation/cdl/en/statug/63033/HTML/default/ viewer.htm- statug_reg_sect038.htm.
43. O’Brien RM. A caution regarding rules of thumb for variance inflation factors. Qual Quant. 2007;41(5):673–90.
44. Belsley DA, Kuh E, Welsch RE. Regression diagnostics identifying influential data and sources of collinearity. Hoboken, NJ: Wiley; 2013.
45. Canadian Institute for Health Information. Data quality documentation, continuing care reporting system, 2013–2014. Ottawa, ON: CIHI; 2015. 46. Smalbrugge M, Jongenelis L, Pot AM, Beekman AT, Eefsting JA. Comorbidity
of depression and anxiety in nursing home patients. Int J Geriatr Psychiatry. 2005;20(3):218–26.
47. Calleo JS, Kunik ME, Reid D, Kraus-Schuman C, Paukert A, Regev T, et al. Characteristics of generalized anxiety disorder in patients with dementia. Am J Alzheimers Dis Other Dement. 2011;26(6):492–7.
48. Barca ML, Selbaek G, Laks J, Engedal K. Factors associated with depression in Norwegian nursing homes. Int J Geriatr Psychiatry. 2009;24(4):417–25. 49. Bozek A, Rogala B, Bednarski P. Asthma, COPD and comorbidities in elderly
people. J Asthma. 2016;53(9):943–7.
50. Matte DL, Pizzichini MM, Hoepers AT, Diaz AP, Karloh M, Dias M, et al. Prevalence of depression in COPD: a systematic review and meta-analysis of controlled studies. Respir Med. 2016;117:154–61.
51. McCusker J, Cole MG, Voyer P, Monette J, Champoux N, Ciampi A, et al. Observer-rated depression in long-term care: frequency and risk factors. Arch Gerontol Geriatr. 2014;58(3):332–8.
52. Maher AR, Maglione M, Bagley S, Suttorp M, Hu JH, Ewing B, et al. Efficacy and comparative effectiveness of atypical antipsychotic medications for off-label uses in adults: a systematic review and meta-analysis. JAMA. 2011; 306(12):1359–69.
Publisher’s Note