160
Optimization Of Process Parameters In The
Batch Crystallization Of Sodium Chloride From
Brine By The Taguchi Method
John Baptist Kirabira, Hillary Kasedde, Joseph D. LwanyagaAbstract: In this study, the parameters affecting the crystallization of sodium chloride from brine were investigated. Taguchi experimental design method was applied to study the most influential controlling parameters such as feed concentration, mixer speed, heating load, and residence time on the crystallization yield of salt. An L9 (34) orthogonal array experimental design, consisting of four parameters, each with three levels, was employed to examine the effect of the simultaneous variation of these parameters as control factors on the mass yield. Statistical analysis of variance (ANOVA) was also used to determine the relationship between the experimental conditions and salt yield levels. The results from the signal-to-noise (S/N) analysis showed that the optimum conditions for maximum crystal yield were achieved when the feed concentration, mixer speed, residence time, and heating load are 0.248 g of NaCl/g of solution, 830 rpm, 50 minutes, and 1400 W, respectively. Moreover, the ANOVA results indicated that the residence time and heating load are the most significant parameters influencing the salt crystal yield with a contribution of 57.11% and 20.07%, respectively. The mixer speed and feed concentration had the smallest effect on the crystal yield with a contribution of 19.55% and 3.3%, respectively.
Keywords: ANOVA, Crystallization, Mineral Salts, Minitab, Process Parameters, Sodium Chloride, Taguchi analysis
————————————————————
1
I
NTRODUCTIONCRYSTALLIZATION is a major unit operation in the chemical process industry that plays a key role in the production, purification, and recovery of mineral salts of high quality grade from relatively impure solutions. Regardless of the technology, crystallization occurs by a phase change in temperature and/or the composition of the saturated solution. The solid phase then crystallizes from the solvent if the solution is supersaturated i.e. when the chemical potential of the solid is less than that of the corresponding component in solution. Moreover, it involves a number of fundamental steps, including nucleation, crystal growth, agglomeration, and recrystallization. Due to the high level of product purity required and the low energy requirements for separation, crystallization has gained a wide applicability in the chemical, pharmaceutical, food, and electronic industries [1]. Studies in literature show that pure sodium chloride crystallizes from brine in well-formed cubes, which under the influence of surface tension often grow together into funnel-shaped, hollow-square based pyramids. However, in the presence of impurities, octahedral or dodecahedra are sometimes formed [2]. The intense stirring in the process causes crystal particles to become smoother thus making them less susceptible to secondary nucleation as a result of attrition and also improving their powder flow characteristics [3].
During crystallization, small amounts of water can be trapped in the holes of crystals. When this vaporizes upon heating, it causes the crystals to explode with audible decrepitation. In the salt extracted from natural deposits, inclusions of gases such as methane, carbon dioxide, and hydrogen sulfide can occur [4]. Other investigations have reported the crystallization characteristics of sodium chloride crystal size distribution in different crystallizer types [5]. The present research is part of a continuing effort to the recovery of high purity mineral salts from the brines of Lake Katwe. The lake is the largest of the eight saline lakes occupying the explosion craters in the Katwe-Kikorongo volcanic field in south-western Uganda. At an elevation of 885 m, the lake occupies a maximum area of 2.5 km2, circumference of 9 km, and a depth ranging between 0.4 to 1.6 m. Sodium chloride (halite) is the most abundant mineral salt in the lake brines and evaporites. Presently, the mineral is extracted and processed based on traditional methods, hence small and impure yields [6], [7], and [8]. It is consumed in crude form mainly for animal feed supplements and also for industrial uses such as leather tanning and textile production. Recrystallization is a viable option to play a significant role in the production of high purity salt from Lake Katwe. To date, no attempt has been made to investigate the factors affecting the crystallization of sodium chloride from such brines in the presence of impurities, hence the purpose of the present work. Ultimately, the main aim of this work was to determine the conditions necessary for the optimization of the crystal yields from the brine.
2.
M
ATERIALS AND METHODS 2.1. Apparatus and reagentsThe experimental setup is shown schematically in Fig.1. It consists of a fabricated cylindrical crystallizer, mechanical stirrer, heat source, and a thermometer. The 10 liter vessel (diameter = 25 cm and height = 22 cm), has been made of stainless steel to avoid effects of corrosion by the salt. The mechanical stirrer with a variable speed motor can vary from 0 to 1100 rpm to provide the mixing, using a centrally mounted pitched blade impeller. Since the mixer shaft is long, the propeller diameter is small (4 cm) and only 3 liters of the brine _________________________
John Baptist Kirabira is currently an Associate Professor in the Department of Mechanical Engineering, Makerere University, P.O. Box 7062, Kampala-Uganda. Email: [email protected] or [email protected] Hillary Kasedde is currently a Lecturer in the Department
of Mechanical Engineering, Makerere University, P.O.
Box 7062, Kampala-Uganda. Email:
Joseph D. Lwanyaga is currently pursuing a PhD in Mechanical Engineering at Makerere University, P.O.
Box 7062, Kampala-Uganda. Email:
161 are used for each batch experiment to minimize the shaft
vibrations in the lower part of the crystallizer. Two nozzles have been implemented on the crystallizer cap for installation of the shaft and thermometer. The thermometer nozzle doubled as the vapor outlet. The heat source provides the required heat for the solution evaporation and generation of turbulence. The feed used in the experiments was the unpurified salt (Grade 1) from Lake Katwe. The salt is extracted from the salt pans during the long dry season. Purified water with a resistivity and pH of 18.25 MΩ and 7.0, respectively was used to prepare the series of brines used in the batch crystallization experiments.
Fig. 1. Schematic diagram of the experimental set-up
2.2. Experimental design
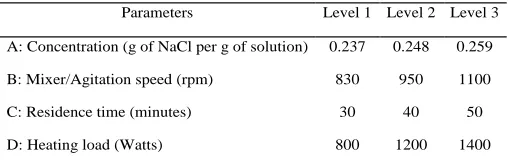
The Taguchi method composing of 3 columns and 4 rows was used to design the experiments in the present study. The method uses an orthogonal array to study all the designed parameters with a minimum number of experiments hence saving considerable time and cost with a fully developed process [9]. The parameters expected to effect the crystallization of the salt were: feed concentration (g of NaCl per g of solution), agitation speed (rpm), residence time (minutes), and heating load (watts). Table 1 shows the key parameters investigated at the three experimental levels. The parameter ranges were selected based on preliminary experiments conducted and a review of literature. A standard L9 orthogonal array, with 9 groups of experiments was chosen to determine the experimental design (Table 2), since it is the most suitable for the conditions being investigated. The experimental data was analyzed using the signal to noise (S/N) ratio to represent the performance characteristic for each level of process parameters. In addition, the S/N ratio measures the sensitivity of the quality investigated to the uncontrollable factors (error) in the experiment.
TABLE 1:
EXPERIMENTAL PARAMETERS AND THEIR LEVELS
The mass yield of the salt product (g) was considered as the Taguchi array response. There are several of S/N ratios available depending on the type of characteristics, viz: the lower-the-better, the higher- the-better, and the nominal-the-better [10]. In the present study, a higher mass yield of the salt product was desirable. Hence, the higher-the-better criterion was chosen when evaluating the S/N ratios of the salt crystallization parameters, which can be calculated according to the following equation:
, 1 1 log 10 / 1 2
ni yi
n N
S
where n is the number of repetitions, yi is the observed data (mass yield) for the ith experiment.
After calculating and plotting the mean S/N ratios at each level for the various factors, the optimal level, corresponding to the highest mean S/N ratio among all the factors was determined. Additionally, the optimal level of the experimental parameters is the level with the highest S/N ratio [11]. To study the influence of each parameter to the response variable, analysis of variance (ANOVA) technique was used. The experimental design and all the calculations were done using MINITAB version 17 statistical software [12].
TABLE 2:
L9(34) ORTHOGONAL ARRAY WITH THE EXPERIMENTAL PARAMETERS
Run. No.
Concentration (g of NaCl per g of solution) Mixer speed (rpm) Residence time (minutes) Heating load (watts)
1 0.237 830 30 800
2 0.237 950 40 1200
3 0.237 1100 50 1400
4 0.248 830 40 1400
5 0.248 950 50 800
6 0.248 1100 30 1200
7 0.259 830 50 1200
8 0.259 950 30 1400
9 0.259 1100 40 800
2.3 Experimental procedure
A typical experimental procedure was as follows: a brine solution with an under saturated concentration was prepared and transferred to the crystallizer. Thereafter, the crystallizer, mixer, and heating source were turned on to ensure that all traces of crystalline material dissolved in solution. When the brine started boiling, the temperature was recorded. At this time, it was established that the system had stabilized. The residence time (see Table 2) determined the final point of each experiment. At the end of each experiment, the salt crystals accompanied with magma were directed out of the crystallizer to a polythene mesh sieve. The mass of the wet crystals was measured and recorded, followed by drying in a laboratory oven at 60oC for 48 hours. The mass of the crystals was then measured and recorded. To increase precision, each experiment was conducted twice under the same conditions at different times and the average quantities reported.
3.
R
ESULTS AND DISCUSSIONIn this work, 9 experiments were conducted as per the L9 orthogonal array in order to study the effect of the parameters on the salt crystal yield. The experimental results for the mass
Parameters Level 1 Level 2 Level 3
A: Concentration (g of NaCl per g of solution) 0.237 0.248 0.259
B: Mixer/Agitation speed (rpm) 830 950 1100
C: Residence time (minutes) 30 40 50
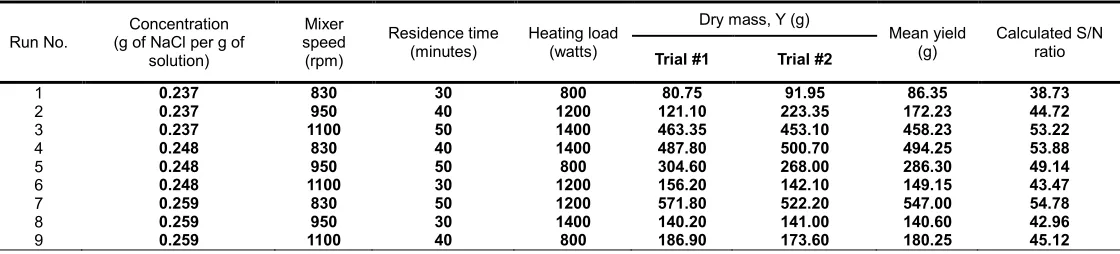
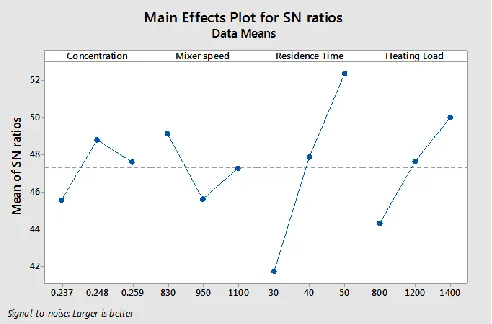
162 yield (g) and corresponding S/N ratios are summarized in
Table 3. The factors affecting the S/N ratio are also presented in a main effect plot in Fig.2, to visualize the related contributions of the various levels of the factors on the crystal mass yield. It is clear that the largest S/N ratio corresponds to a better quality characteristic. It can be seen from the main effect analysis results from Minitab software (Fig.2) that the optimum experimental conditions for the crystal yield are: feed concentration at level 2 (0.248 g NaCl/g of solution), mixer speed at level 1 (830 rpm), residence time at level 3 (50 minutes), and heating load at level 3 (1400 W). On the other hand, it can be seen from Table 3 that experiment number 7 yields the largest S/N ratio of 54.78. For this experiment, the combination of parameters and their levels are: feed concentration at level 3 (0.259 g NaCl/g of solution), mixer speed at level 1 (830 rpm), residence time at level 3 (50 minutes), and heating load at level 2 (1200 W). This result is different from the main effect analysis and does not represent the optimum combination of parameters and their levels. However, it should be noted that this result only shows that these combinations of parameters and their levels yield the optimum quality characteristic with a minimum variance around the target value. Table 4 shows the S/N ratio for the crystal yield for the ―larger is better‖ criterion obtained for the different parameter levels. The rank of the input parameter signifies the impact of the input parameters over the crystal mass yield. The results show that the residence time and heating load have the largest effect on the mass yield while concentration and mixer speed have the smallest effect on the mass yield. As observed from the experimental results, for a given feed concentration, an increase in the residence time results in a higher mass yield. Moreover, a longer residence time leads to breakage of grown crystals which are then divided into new nuclei. To explain this, increasing the residence time in the crystallizer, at the presence of nuclei under favorable operating conditions will result in a better growth process and yield of larger crystals. Furthermore, a common concern in increasing the production in a crystallizer is that because of shorter residence times, there is a higher super saturation, which in turn will reduce the average particle size [13]. Also, an increment in the residence time implies an
increment in the magma density (kg of crystals/m3 of slurry) in the crystallizer although results in an increased attrition, which leads to a smaller product yield. It should also be noted, however, that the residence time manipulation is not usually a very effective means of adjusting product crystal size in crystallization processes [14] The experimental results also show that increase of heating load enhances the rate of evaporation, which will subsequently lead to increase of super-saturation and occurrence of nucleation, but this does not imply production of large crystals. Heating load must have a proper value to result in suitable growth of crystals. If heating load is considerably increased, it will cause disturbance in the crystallizer, which will subsequently result in crash of the crystals, which had already started growing up. On the other hand, decreasing the heating load in the process extends the production time duration. Analysis of experiments shows that there is a specific amount for heating load, which will lead to production of appropriate crystals in the shortest possible time interval. The interaction between the process parameters is plotted in Fig. 3. The interaction between the parameters indicates whether adverse effects are caused by an increment or decrement in one parameter upon the response. Moreover, the interaction plot is used to determine whether the interaction is statistically significant. Parallel lines in the plots indicate no interaction while intersecting lines show the presence of an interaction. As can be seen in Fig.3, the lines representing the feed concentration, mixer speed, residence time, and heating load tend to cross each other, hence indicating that there is a considerable interaction effect between the parameters. The analysis of variance was generated at 95% confidence level to examine the influence of the process parameters on the quality characteristics (Table 5). Moreover, to obtain the percentage contribution of the different crystallization parameters over the crystal mass yield. In the present study, the model was saturated such that all the degrees of freedom are consumed by each of the factors. There was no information left for the error calculation. The error variance is equal to zero. The significance of the factors was then determined from the comparison of factor variances.
TABLE 3:
EXPERIMENTAL RESULTS SHOWING THE CRYSTAL MASS YIELD AND S/N RATIO VALUES
Run No.
Concentration (g of NaCl per g of
solution)
Mixer speed (rpm)
Residence time (minutes)
Heating load (watts)
Dry mass, Y (g)
Mean yield (g)
Calculated S/N ratio
Trial #1 Trial #2
1 0.237 830 30 800 80.75 91.95 86.35 38.73
2 0.237 950 40 1200 121.10 223.35 172.23 44.72
3 0.237 1100 50 1400 463.35 453.10 458.23 53.22
4 0.248 830 40 1400 487.80 500.70 494.25 53.88
5 0.248 950 50 800 304.60 268.00 286.30 49.14
6 0.248 1100 30 1200 156.20 142.10 149.15 43.47
7 0.259 830 50 1200 571.80 522.20 547.00 54.78
8 0.259 950 30 1400 140.20 141.00 140.60 42.96
163
Fig. 2. Effect of each process parameter on the S/N ratio
TABLE 4:
RESPONSE TABLE FOR THE S/N RATIOS AT EACH LEVEL OF THE PROCESS PARAMETERS
Level Concentration speed Mixer Residence time Heating load
1 45.56 49.12 41.72 44.33
2 48.83 45.61 47.91 47.65
3 47.61 47.27 52.37 50.02
Δmax-min 3.27 3.52 10.65 5.69
Rank 4 3 1 2
As can be seen in Table 5, the variance of the feed concentration factor was the lowest and hence identified as insignificant. Therefore, the variance and degrees of freedom for the feed concentration were pooled into the error to estimate the error variance. The calculations from the F-test meant that a value greater than 4 corresponded to a greater effect on the crystal mass yield due to the change of process parameters. The results show that the calculated Fp values for the residence time and heating load were highest than for the mixer speed and feed concentration.
Fig. 3. The interaction plot for the crystal mass yield taking into account the control factors
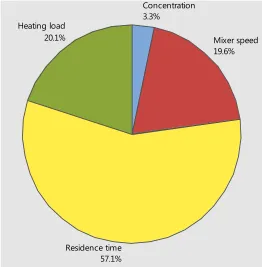
The Fp values for feed concentration, mixer speed, residence time, and heating load were reported at 1, 5.98, 17.47, and 6.13, respectively. Moreover, it can be observed that a change in the residence time, heating load and mixer speed, within the investigated ranges significantly affects the crystal yield since the Fp ratios are higher than 4. On the other hand, the percentage contribution of each factor, also represented graphically in Fig.4, showed that the residence time, heating load, mixer speed, concentration affect the salt crystal yield by 57.11%, 20.07%, 19.55%, and 3.27%, respectively. Thus, the residence time is the most influential factor affecting the crystal yield while the concentration has no significant effect on the crystal yield. In comparison to other similar studies, the results from the present work differ from the investigations by Ahmadpanah et al., 2007 [15]. In their investigations, heating load was found to have the most considerable effect on the crystal sizing while the feed concentration and mixer speed had very low and negligible effect.
TABLE 5:
ANOVA RESULTS FOR THE CRYSTAL MASS YIELD (G) WITH POOLED ERROR
Source DF Adj SS Adj MS Fp (Variance ratio) % Contribution of factor
Concentration 2 7996 3998 1 3.27
Mixer Speed 2 47821 23911 5.98 19.55
Residence Time 2 139706 69853 17.47 57.11
Heating Load 2 49090 24545 6.13 20.07
Error 0 - -
Total 8 244613 -
Pooled error 2 7996
164
Fig. 4. Percentage contribution of the process parameters on the crystal mass yield.
4
C
ONCLUSIONSIn this study, the effect of process parameters on the crystal yield of salts from brine was investigated based on the Taguchi’s design of experiments approach with an L9 orthogonal array matrix. In addition, the S/N ratio analysis and ANOVA were used to examine the influence of the process parameters (including feed concentration, mixer speed, heating load and, residence time) on the crystal yield. The following conclusions can be drawn:
The residence time and heating load have the largest effect on the mass yield with a contribution of 57.11% and 20.07%, respectively. The mixer speed and concentration have the smallest effect on the mass yield with a contribution of 19.55% and 3.27%, respectively. In addition, an increase in the heating load and mixer speed leads to an increment in the crystal yield.
The optimal combination of process parameters and their levels for achieving maximum crystal yield is A2B1C3D3 i.e. concentration at level 2 (0.248 g of NaCl/g of solution), mixer speed at level 1(830 rpm), residence time at level 3 (50 minutes), and heating load at level 3 (1400 W). The combination of parameters and their levels,
A3B1C3D2 (feed concentration of 0.259 g NaCl/g of solution, mixer speed of 830 rpm, residence time of 50 minutes, and heating load of 1200 W) yield the optimum quality characteristic with a minimum variance about the target value.
The results from the present work are useful for the control of the crystallization process to produce crystals of desired properties from the lake brine. Furthermore, for a better understanding of the crystallization process, a study of the nucleation mechanism should be undertaken.
A
CKNOWLEDGEMENTSThis study was funded in part by the Government of Sweden through the Swedish International Development Cooperation Agency (Sida) in conjunction with Makerere University.
R
EFERENCES[1] Adler, S., Beaver, E., Bryan, P., Robinson, S., Watson, J. 2000. Separations Roadmap. AIChE in cooperation with the DOE (Department of Energy), New York, USA.
[2] Ballabh, A., Trivedi, D.R., Dastidar, P., Ghosh, P.K., Pramanik, A., Kumar, V.G. 2006. A practical approach to produce near-spherical common salt crystals with better flow characteristics Crytal Growth and Design 6: 1591-1594.
[3] Mukhopadhay, I., Mohanda, V.P., Desale, G.R., Chaudhary, A., Ghosh, P.K. 2010. Crystallization of spherical common salt in the submillimeter size range without habit modifier. Industrial Engineering and Chemistry research 49: 12197-12203.
[4] Westphal, G., Kristen, G., Wegener, W., Ambatiello, P., Geyer, H., Epron B, Bonal C, Steinhauser G, and Götzfried F. 2010. ―Sodium Chloride‖. 2010 Wiley-VCH
Verlag GmbH & Co. KGaA, Weinheim
10.1002/14356007.a24_317.pub4.
[5] Choi, B.S., 2005. Crystallization characteristics of NaCl crystal size distribution associated with a CMSMPR crystallizer. Ph.D. Thesis. The University of Utah, USA.
[6] Kasedde, H., Kirabira, J.B., Bäbler, M.U., Tilliander, A., Jonsson, S., 2014. Characterization of Brines and Evaporites of Lake Katwe, Uganda. Journal of African Earth Sciences 91: 55-65.
[7] Kasedde H, Bäbler MU, Kirabira JB, Tilliander A, Jonsson S. 2013. Mineral recovery from Lake Katwe brines using Isothermal evaporation. Reliable Mine Water Technology. 2013; 2:855-860.
[8] Kirabira, J.B., Kasedde, H., Semukuuttu, H. 2013. Towards the Improvement of Salt Extraction at Lake Katwe, International Journal of Scientific & Technology Research 2, (1), 76 – 81.
[9] Phadke, M.S., 1989. Quality engineering using robust design. Englewood Cliffs, NJ: Prentice Hall.
[10] Roy, R. K., 1990. A primer on Taguchi method. New York: Van Nostrad Reinhold.
[11] Ross, P.J., 1989. Taguchi Techniques for Quality Engineering. McGraw-Hill, Singapore.
[12] Minitab Corp., 2015. Mintab user manual release 17. Making data analysis easier. Minitab Corp, MC Graw-Hill Companies, Massachusetts, USA.
[13] Fakatselis, T.E., 2002. Residence Time Optimization in continuous crystallizers. Crystal Growth and Design 2:
Heating load 20.1%
Residence time 57.1%
Mixer speed 19.6% Concentration
165 5375-379.
[14] Mullin, J.W., 2001. Crystallization. Fourth Ed. Butterworth-Heinemann, Oxford.