AFDGA: Defect Detection and Classification of
Apple Fruit Images using the Modified Watershed
Segmentation Method
A. Raihana R. Sudha
Assistant Professor Assistant Professor
Department of Computer Science & Engineering Department of Information Technology PSNA College of Engineering & Technology Dindigul-624619,
India
PSNA College of Engineering & Technology Dindigul-624619, India
Abstract
One of the commercial industry is Food industry, which utilizes image processing for investigating the product at the time of harvesting. Various imperfections on the fruit’s skin can help to analyze the quality of the fruit. Several agriculture based softwares were developed to find out the quality of the products using image processing techniques. The main objective of this paper is to detect the defected fruits using AFDGA-[Apple Fruit Detection, Grading and Analyzation] approach, where it uses Modified Watershed Segmentation to segment the defection and analyze the Fruits using GLCM based feature extraction method, and finally classify the images by SVM in terms of the its features. Statistics, Textural and some geometrical features are utilized to classify the apple fruits and grade it. To improve the efficiency [detection and grading] it is confirmed the computer based AFDGA procedure is verified in FPGA environment. VLSI code is created and using the binary factors the Fruit is decided as Good fruit or Defected Fruit. The simulation results obtained from MATLAB and VLSI are compared for performance evaluation.
Keywords: Fruit Detection, Apple Fruit Analyzation, Feature Extraction, SVM Classifier
________________________________________________________________________________________________________
NOMENCLATURE
Symbols Description FO Fruit Objects AFO Apple Fruit Objects GLCM Gray Level Co-occurrence Matrix AFDGA Apple Fruit Grading &Analyzation
SVM Support Vector Machine
I. INTRODUCTION
Conventional investigation of fruit foods grown from the ground is performed by human masters. However, automation of this methodology is important to reduce error, variety, weariness and cost because of human specialists and also to expand speed. Fruit quality relies on upon sort and size of deformities and additionally skin color and tree grown foods size. Investigation of fruits in respect to skin color and tree grown foods size is now computerized by machine vision, while a vigorous and exact programmed framework reviewing pieces of fruit as for deformities is still in examination stage in view of exceptionally differing imperfection sorts and skin color and also stem/calyx territories that have comparable ghastly attributes with a few deformities.
Deformity discovery for review of nature of pieces of fruit has been picking up criticalness everywhere. The consistency in size, shape and other quality parameters of fruits are needed for choosing the general acknowledgement quality for clients. In numerous businesses, at present, reviewing of fruits is performed by hand, and this is an extremely work serious. Work deficiencies and an absence of general consistency to the procedure brought about a quest for computerized results. Color, size and measure of deformities are critical viewpoints for review and reviewing of crisp fruits; numerous machines have been constructed for the same.
Products of the soil Recognition Systems that exist for foods grown from the ground collecting, tree yield monitoring, infection identification and different operations use machine vision techniques that think about features like color, shape and surface for distinguishment. This paper proposes tree grown foods distinguishment framework outline that uses a base separation classifier that soaks up first request measurable features alongside shape characteristic for productive products of the soil ID. FPGA based configuration for the above framework has been reproduced utilizing Verilog.
as image or video frames. The outcome of an image will be a sequence of characteristic, parameter or an image. Generally image processing techniques comprise treating the image as standard signal processing technique or two dimensional signals. It is mainly used to process 2D image by a computer. To manipulate multi-dimensional signals modern digital technology is used that collection from simple digital circuits to advanced parallel computers. The objective of this manipulation can be shared into three categories:
Image Processing (imagein->imageout) Image Analysis (imagein->measurementsout) Image Understanding (imagein->high-leveldescriptionout)
The main image can contain a set of sub images that have regions − of − interest (ROIs).this explains that images frequently contain collections of objects each of which can be the origin for a region. To select anactual region from the input image we can use refined image processing system it should be possible to apply specific image processing. One part of an image is monitor the images in motion blur while another part might be handled to improve color rendition.
Object detection is one among the computer technology to detect illustration of semantic objects of a convinced class in the digital image. Face detection and pedestrian detection are researching domains in object detection. Object detection application areas are: image retrieval, computer vision and video observation. In that feature extraction is a special form of dimensionality reduction in image processing and in pattern recognition. Converting the input data into the set of features is calledfeatureextraction. The features set will extract the relevant information by the selection of feature extraction. By the exact feature set the relevant information from the input in order to perform the desired task using this concentrated representation instead of the full size input.
The intention behind the paper was to execute ongoing products of the soil distinguishment framework. This brought about FPGA based fittings execution. To develop FPGA based experiment, VLSI code is programmed. The binary pattern of apple fruit image is retrieved and verified.
The Verilog recreations were done in Xilinx ISE 10.1 & ISIM. To designate a huge set of information precisely emphasize extraction includes streamlining the measure of advantages compulsory. A concise writing review is given underneath about the prior examination considers about the image transforming, division and about characteristic extraction procedures.
II. RELATED WORKS
In this paper different systems proposed in prior studies are offered here to know an overview about fruit apples and oranges location, investigation and evaluating. Paper [1] presents the late advancement and requisition of image investigation and machine vision framework in quality assessment of items in the field of agrarian and sustenance. It is really fundamental to through light on essential ideas and advances connected with machine vision framework, an instrument utilized as a part of image investigation and mechanized sorting and evaluating is highlighted. The article [2] indicates that acoustic estimation might be a valuable device to separate distinctive fruit clumps with a low lapse rate. Beginning from the range of the indicator recorded by a mouthpiece after the effect of a little mallet on the products of the soil, 18 key characteristics were recognized and utilized for the arrangement of fruits fitting in with 10 separate mixtures. Creator in [3] proposes an effective combination of shade and surface characteristics for apples and oranges distinguishment. The distinguishment is carried out by the base separation classifier based upon the factual and co-event characteristics determined from the Wavelet converted sub- groups. In [4] mass and external measurements (tallness and width) of fruit were measured and an appraisal focused around mass and external measurements was proposed. Paper [5] proposed a novel provision work for evaluating of fruit foods grown from the ground by machine vision. Taking after exact division of imperfections by negligible perplexity with stem/calyx zones on multispectral images, measurable, textural and geometric characteristics are concentrated from the fragmented region. Utilizing these characteristics, factual and linguistic classifiers are prepared for two- and multi-class reviewing of the tree grown foods.
[15]-[16], Oil Palm Fruits [17-18], Strawberries [19], Citrus [20] , Oranges [21], Mangoes [22], Lemons [23], Dates[24] and so on. From the related work it is clear that catching and evaluating fruit products of the soil needs a grouping of methodology ought to be followed in image handling.
III. EXITING SYSTEM
S.Arivazhagan et al, proposed a productive combination of shade and composition features for products of the soil distinguishment. The distinguishment is carried out by the base separation classifier based upon the measurable and co-event features determined from the Wavelet changed sub- groups. Since fruit tree grown foods may fluctuate in size, harmed area and imperfections and so on, the more faultless discovery and arrangement methodology requirement for fruit apples and oranges recognition and characterization under different imperatives. AFDGA can give faultless arrangement of fruit products of the soil in light of GLCM characteristic extraction strategy removes about 25 or more number of features.
IV. PROPOSED APPROACH
These features are the detail ascertained from the first pixel values without any [5] need of pixel relations or utilization of network converts. Factual measures, for example, mean, difference, skewness, kurtosis, normal vitality, entropy and scattering fall into this class. Throughout the MATLAB investigation an experimentation methodology was considered acknowledging the fittings execution. Distinctive mixtures of these features were attempted and it was figured out that mean and fluctuation had a significant effect on the adequacy and they were easy to be actualized too. In this paper the MEAN, VARIANCE, and a portion of the shape features [area, perimeter] are taken for FPGA examination.
Image division is utilized to portion a image into different parts. It is ordinarily a preprocessing step and is possible to divided the primary protest under test from its experience. Of the distinctive division systems like limit based, edge based, and locale based, the paper utilizes edge based procedure for division. AFDGA apply its arrangement of systems and section the absconded divide in the products of the soil image.
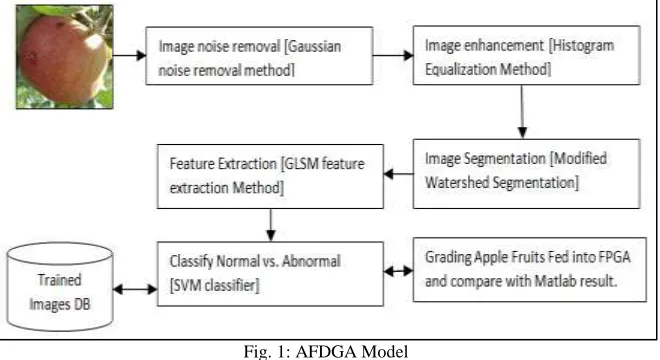
AFDGA approach brings exact category of apple fruit after a series of process done on the image. The overall functionality of AFDGA is shown in figure-1. The series steps are read input image, remove the noise from the image, enhance the image and segment the image. After successful segmentation the features are extracted using GLCM method and classified using SVM.
Fig. 1: AFDGA Model
An input image consists of apple fruits in various conditions like healthy, injured, and red injured, red healthy, green injured and green healthy and so on. Apple in the image may be in good or injured or defect condition. The various kind of input image is shown in Figure-2.
Fuji Injured Golden Injured Fuji Healthy Golden Health Red Healthy Red Injured Fig. 2: Input Image Conditions
Noise Removal
quality of the image. Statistical noise represents Gaussian noise having probability density function (PDF) equal to that of the normal distribution, which is named as Gaussian distribution. The actual pixel value in the image will be changed from its inventive value by a minute amount in the Gaussian noise. According to the central bound theorem Gaussian distribution is usually a good quality representation. The probability density function 𝑝of a Gaussian random variable 𝑧is given by:
𝑃𝐺(𝑍) = 1
𝜎√2𝜋𝑒
−(𝑧−𝜇)2 2𝜎2
Alternatively, a process is Gaussian if and only if for every finite set of indices𝑡1 … . . 𝑡𝑘in the index set 𝑇 𝑋𝑡1, … … 𝑡𝑘 = (𝑋𝑡1, … … , 𝑋𝑡𝑘)
It is a multivariate gaussian random variable. The Gaussian property can be formulated by using the features functions of random variables as: { 𝑋𝑡; 𝑡 ∈ 𝑇}, such that
𝐸 (𝑒𝑥𝑝 (𝑖 ∑ 𝑡𝑙
𝑘
𝑙=1
𝑋𝑡𝑙)) = 𝑒𝑥𝑝 (−
1
2∑ 𝜎𝑙𝑗𝑡𝑙𝑡𝑗+ 𝑖 ∑ 𝜇𝑙𝑡𝑙
𝑙 𝑖,𝑗
)
Image Enhancement
The process of correcting the color, brightness imbalances and other features are comes under image enhancement to increase the image quality. The automatic operations such as image cropping, zooming, adjustment of sharpness and red eye removal these are done automatically without the user interaction. By the using of image editors the noise may be add/ remove from the image and enhance its quality. Noise removal mainly defines the elimination of state of the scene in an image and produces the highly enhanced image with cleaner.
Grayscale imaging is the process of histogram equalization. This method is mainly applicable for color images and by applying the same method separately to the red, green and blue color values of the images that can apply some dramatic changes in the images quality. The histogram equalization result in “whitening” where the bright pixels probability is higher than that of dark one.
The general histogram equalization formula is:
h(v) = round(cdf(v) − cdfmin
(M×N) − cdfmin
×(L − 1))
Where,
cdfmin is the minimum non zero value of the cumulative distribution function
M×N is the number of pixels of images
List he grey level used in the images.
Image Segmentation
Image segmentation is the process of separating the set of pixels into a multiple segments from the digital image. The objective of image segmentation is to shorten the depiction of image to analyze easily. It is the process of assigning labels to every pixel, boundaries, and objects in an image such that a pixel with the same labels comes under the same characterization. Each pixel that is presented in the images has some features such as color, intensity or texture. The regions that are near to this are something different from this image. Different watershed lines may be computed in the image processing. It may define on the edges, nodes or on edges and nodes. Inter pixel watershed algorithm have the following procedures such as:
Initialized a set S with a labeled nodes and label each minimum with a distinct labels.
Extract from S a node x of minimal altitude F, that is to say F(x) =min{F(y)│y∈S}. Attribute the label of x to each non labeled node y adjacent to x, and insert y in S.
Repeatstep2untilSisempty.
The watershed consistencies are evenly defined by the “catchment basins” or by the “dividing lines” that separates the catchment basins.
Feature Extraction
In gray level Co-occurrence matrices, the number of rows and columns are equal to the number of gray levels. Indexing and retrieving the visual contents in an image can be obtained by the Feature Extraction method. The GLCM is a L×L square matrix of the gray scale image I of spatial dimension M×N with gray level in the rangeT = [ti,j]L×L .It can be represented by T = [ti,j]L×L matrix. Every element in the matrix specifies the number of transitions among all pairs of gray values in a specific manner. Every pixel in the image at spatial coordinates (m, n) including its gray value specified by f(m, n), it deliberates all its nearest adjacent pixels in the locations of
(m + 1, n), (m − 1, n), (m, n + 1) and (m, n − 1)
There are various occurrence matrix are possible and it duly depends on the gray level I follows the gray level j. The co-occurrence matrix by considering horizontally right and vertically lower transitions can be given as
ti,j= ∑ ∑ δ
N
n=1 M
m=1 Where
δ = 1 if {f(m, n) = iandf(m, n + 1) = j
f(m, n) = iandf(m + 1, n) = j}
δ = 0 otherwise
Normalizing the entire number of transitions in the co-occurrence matrix, a desired transition probability ij
p from gray level I
to gray level j is obtained as follows.
𝑃𝑖,𝑗= 𝑡𝑖,𝑗 ∑𝐿𝑖=1∑𝐿𝑗=1𝑡𝑖,𝑗
Using the feature extraction method the texture properties of the Apple images are extracted. These feature values are used by the classifier after some times to categorize the images accurately. Textural features are the features of the surface of Apple images and the relationship among the nearest neighbor pixels on the surface. There are several textural features available a DRFI, but in this scenario the mean, standard deviation, entropy and homogeneity of the pixels are calculated and compared for evaluating the performance of the WSS(full form). The spatial distribution of the gray level features can be obtained from Co-Occurrence matrix of the image.
Area of AO
The area of the AO is calculated and computed by counting the pixels in an iterative manner by row wise or by column wise.
𝐴𝑟𝑒𝑎 = ∑ 𝑝(𝑖, 𝑗) 𝑚,𝑛
𝑖=0,𝑗=0
𝑆 = ( 𝑎𝑟𝑒𝑎
𝑝𝑒𝑟𝑖𝑚𝑒𝑡𝑒𝑟)
2 ×4𝜋
𝑚𝑒𝑎𝑛 = 1
𝑚 ×𝑛∑ ∑ 𝐼(𝑖, 𝑗)
𝑛
𝑖=1 𝑚
𝑖=1
𝑣𝑎𝑟𝑖𝑎𝑛𝑐𝑒 = 1
𝑚 ×𝑛∑ ∑(𝐼(𝑖, 𝑗) − 𝑚𝑒𝑎𝑛) 2 𝑛 𝑗=1 𝑚 𝑖=1 Standard Deviation
𝑆𝑡𝑎𝑛𝑑𝑎𝑟𝑑𝐷𝑒𝑣𝑖𝑎𝑡𝑖𝑜𝑛[𝜎] = √ ∑ ∑[𝑃(𝑖, 𝑗) − 𝜇]2
𝑛−1
𝑗=0 𝑚−1
𝑖=0
Third moment
𝑇ℎ𝑖𝑟𝑑𝑚𝑜𝑚𝑒𝑛𝑡[𝜇𝑖] = ∑(𝑍𝑖− 𝑚)3𝑝(𝑍𝑖)
𝐿−1
𝑖=0
Entropy
𝐸𝑛𝑡𝑟𝑜𝑝𝑦 = − ∑ 𝑝 𝑙𝑜𝑔2𝑝
Homogeneity
Closeness of the distribution of the image GLCM diagonal can be mathematically written as
Homogeneity = ∑ ∑ Pij
(1 + |i − j|) N−1
j=0 N−1
i=0
Colour mean (μ) = 1
N(∑ Pi)
N i=1
For our proposed work 80 normal images and 80 injured affected images (totally 160 images) are taken as input images and their features are extracted and the classification results are shown below.
Feature Selection
A total of more than 35 features is extracted from fruit image, the extracted 35 feature set is a collection of 7 textural features, 21 statistical features for various color channels and 4 shape based features used to grade the apples based on the extracted features. All the features of entire fruit do not give the discriminant features. So it includes some redundant or irrelevant features it does not differentiate the normal apple skin with the defected parts of the apple surface. In this paper only 23discriminating features are selected from the features set, they are area and perimeter from the shape features set, mean, standard deviation, max and gradient from the statistical features set and finally, the contrast, homogeneity and energy are from the texture features set.
SVM Classification
Another statistical classifier is SVM, which first non-linearly maps data to a high-dimensional space by kernels and then tries to find the hyper plane that separates data with maximum margin in that new space (Burges, 1998; Vapnik,1998). Originallyproposedfor2-classproblems, SVM can be easily extended to multiclass problems by one or one-against-all strategies, where the latter is used in this work.
Several features are extracted using GLCM methodology. In this scenario only 6 features are taken to classify the AO. One is area and remaining textural features. The SVM classifier is employed to infect Apples in the images. The selected features feed as input to SVM classification parameters and it classifies the normal and abnormal categories. Also the classification stage is applied to define the grade of apples based on the defects occur on the surface. This procedure is carried out to differentiate the apples into various categories, i.e., grade-A, grade-B and grade-C. We have used SVM algorithm with Euclidean distance for classification. Consider this Matlab results are stored in to FPGA memory.
Apple Grading
The color features give detailed features compared to gray level features. After detecting actual defected part in the apple images, in order to represent defected area, we extract color statistical and color texture features for individual Red (R), Green (G) and Blue (B) channels. The shape features are extracted for Red channel.
Consider image I read from a database or from an input folder where I is an m x n sized RGB image. Using the Red, Green and Blue channels of I, it is converted into true color 3D image by copying the monochrome image into all the three Red, Green and Blue color channel.
The discriminant features are selected using sequential forward selection method. The apples are graded using SVM classifier with Euclidean distance.
Algorithm
The input fruit is converted into other color space [RGB2Gray] Noise is removed using Gaussian Noise Removal Method Enhance the image using Histogram Equalization Method Modified Watershed Segmentation method for detecting Object Feature Extraction using GLCM
Classify the features using SVM Grade the apple
Categorize normal vs. abnormal images.
the fruit features, centroid is obtained from MATLAB and stored into FPGA memory The COE file of the test image is burnt on the IP core.
From 1 to 6 repeated
The Euclidean Distance between the test values obtained from Step 3 and that of the already stored Centroid values obtained from training are calculated using edge detection equation.
Find out the minimum distance amongst all the distances (each class) and assign the test image to the class with minimum distance.
The Results of Eucledian Distance based classifier is in Table 1
Data Set
A trained dataset is created with 100 apple images where 35 images are abnormal images and the remaining 65 images are normal images taken from a CASC IFW Database.
V. RESULTS AND DISCUSSION
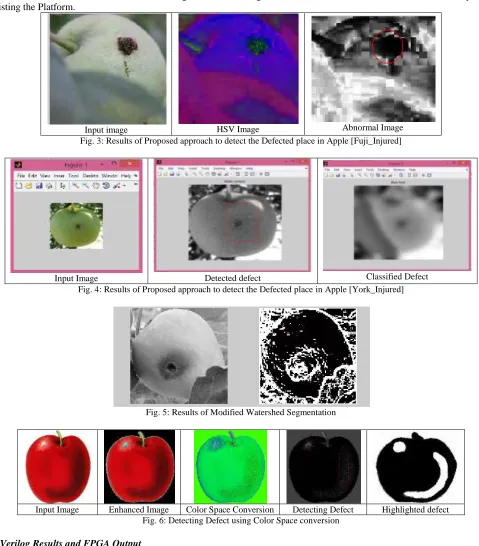
FPGA results. The visual examination indicates that the reproduction comes about and trial result are precisely for more images and simply same for a portion of the images. The surrendered divide on the fruit image is gotten from the divided images. The shade features are concentrated and chose utilizing SFS. The Verilog coded results and the MATLAB results were comparedfor persisting the Platform.
Input image HSV Image Abnormal Image
Fig. 3: Results of Proposed approach to detect the Defected place in Apple [Fuji_Injured]
Input Image Detected defect Classified Defect
Fig. 4: Results of Proposed approach to detect the Defected place in Apple [York_Injured]
Fig. 5: Results of Modified Watershed Segmentation
Input Image Enhanced Image Color Space Conversion Detecting Defect Highlighted defect Fig. 6: Detecting Defect using Color Space conversion
Verilog Results and FPGA Output
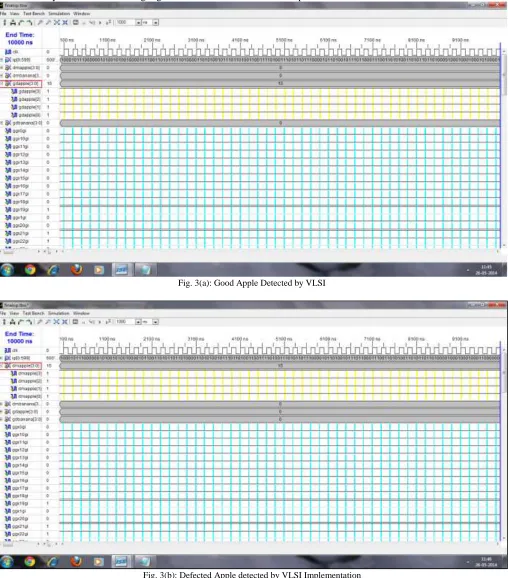
xc6xls16-3csg324 or Virtex6. I/O planning and Clock planning is done and the model is implemented for JTAG hardware co-simulation. The System generator parameters are set and generated. On compilation the netlist is generated and a draft for the model and programming file in VLSI is created which can be accessed using Xilinx ISE. The module is checked for behavioral syntax check, synthesized and implemented on FPGA. The Xilinx System Generator itself has the feature of generating User constraints file (UCF), Test bench and Test vectors for testing architecture. The following display shows results displayed by VLSI simulator when a test bench was generated. The display shows simulation waveforms near the end of the test bench.
To evaluate the performance of AFDGA it is implemented in VLSI and the fruit is classified as Normal fruit or defected fruit due to its binary value. The following Figure-3 show the results of VLSI implementation.
Fig. 3(a): Good Apple Detected by VLSI
Table – 1
Binary value of the Good apple and defected apple
0000110100100000001011100010101000010110001011100000101000011001001011100011110100000101101010100010101100001100000 0101000001101001010110010111001101010110100101000101000011101110111001100010110001111111001100010111000000101001010 0100001011001101011011010000110101001011101101001100111101001110101101110000101101001011101100011100110101001101011 0110100001000100010001010000101001011010010101111010111001110100011100111000110001110100010101111001100001011110010 1010110000100011110100000010000110000000100100101110110101010010111100101101110100100011010100001010000011100010110 1001010100000111100000010 [Good Apple]
0000110100100000001011100010101000010110001011100000101000011001001011100011110100000101101010100010101100001100000 0000000000000001010110010111001101010110100101000101000011101110111001100010110001111111001100010111000000101001010 0100001011001101011011010000110101001011101101001100111101001110101101110000101101001011101100011100110101001101011 0110100001000100010001010000101001011010010101111010111001110100011100111000110001110100010101111001100001011110010 1010110000100011110100000010000110000000100100101110110101010010111100101101110100100011010100001010000011100010110 1001010100000111100000010 [Defected Apple]
The above table shows the Binary value of the Good apple and defected apple. The code developed in VLSI is given in Appendix.
GLCM Matrix
The GLCM matrix for the apple fruit fed as input image is obtained from Matlab software and given here. All the possible features of the apple fruit image is extracted by GLCM and the co-occurrence matrix is given below.
{
1 8 0 0 0 0 0 0
7 160 45 5 3 0 0 0
1 45 903 125 15 3 0 0
1 5 121 7479 227 7 0 0
0 2 7 193 1513 182 0 0
0 0 0 5 177 4971 18 0
0 0 0 0 0 0 10 0
0 0 0 0 0 0 0 0}
Gray Level Co-Occurrence Matrix
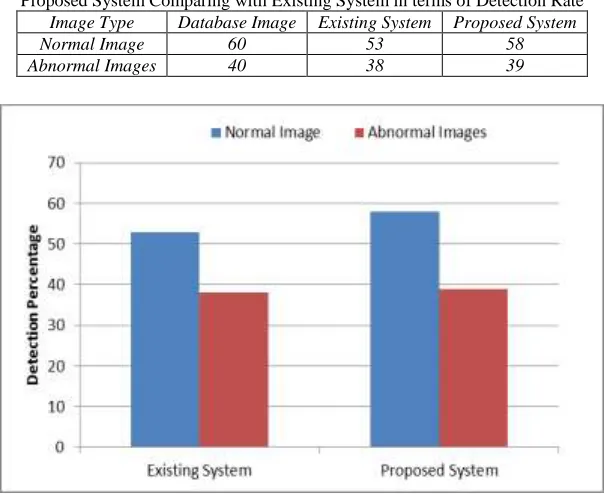
The following table shows the detection and classification accuracy obtained from Matlab simulation and VLSI simulation. Table - 1
Proposed System Comparing with Existing System in terms of Detection Rate Image Type Database Image Existing System Proposed System
Normal Image 60 53 58
Abnormal Images 40 38 39
Fig. 7: Proposed Vs. Existing Approach Comparison in terms of Detection Rate
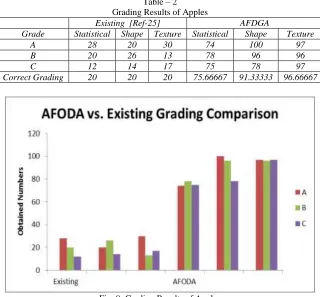
Table – 2 Grading Results of Apples
Existing [Ref-25] AFDGA
Grade Statistical Shape Texture Statistical Shape Texture
A 28 20 30 74 100 97
B 20 26 13 78 96 96
C 12 14 17 75 78 97
Correct Grading 20 20 20 75.66667 91.33333 96.66667
Fig. 8: Grading Results of Apples
All the feature values are extracted for entire images in the DB using in proposed approach. If the apple having more than one defects, then the features are averaged for all defected parts; if the apple having one defected area, then the features are from that defected area otherwise the features are extracted for whole fruit. The apples are graded into three classes such as grade-A (very good) i.e, the apples without defects, grade-B (good) i.e., the apples those having 1 to 3 defects with very small size, and finally, the apples those having more defects and with large size are belonged to grade-C (poor).
VI. CONCLUSION
Industrial systems benefit more and more from machine vision in order to provide high and equal quality products to the consumers. Accuracy of such systems depends on the performance of image processing algorithms used by machine vision. Food and beverages industry is one of the industries where machine vision is very popular and widely employed. Among the goods of this industry, fruits and vegetables have notoriously varying physical appearances. Apple fruits, in particular, are even more problematic due to high natural variation of their skin color and numerous defect types present. In this paper the proposed approach provides more good detection and classification result in both experiment and simulation based results and shown in figures. The last characteristic vector MEAN, VARIANCE and SHAPE fed into FPGA. A set of 100 images each image tried on Xc3s200-5pq208 and the achievement rate was discovered to be 96.66%.
REFERENCES
[1] Narendra V, G Hareesh K S,” Quality Inspection and Grading of Agricultural and Food Products by Computer Vision- A Review”, International Journal of Computer Applications, Volume 2 – No.1, May 2010.
[2] T. Tiplica, P. Vandewalle, S. Verron,” Identification of apple varieties using acoustic measurements”, CAFMET – 2010.
[3] S.Arivazhagan, R.Newlin Shebiah, S.Selva Nidhyanandhan,”Fruit Recognition using Color and Texture Features”, JETCIS,VOL. 1, NO. 2, Oct 2010. [4] Fereydoun Keshavarzpour and Majid Rashidi,” Classification of Apple Size and Shape Based on Mass and Outer Dimensions,” American-Eurasian J.
Agric. & Environ. Sci., 9 (6): 618-621, 2010.
[5] Devrim Unaya, Bernard Gosselin, Olivier Kleynen, Vincent Leemans,” Automatic grading of Bi-colored apples by multispectral machine vision,” Elsevier-2010.
[6] Farshad Vesali, Masoud Gharibkhani and Mohmmad Hasan Komarizadeh,” An approach to estimate moisture content of apple with image processing method”, AJCS 5(2):111-115 (2011).
[7] Hetal N. Patel, Dr. R.K.Jain,” Fruit Detection using Improved Multiple Features based Algorithm”, IJCA -Volume 13– No.2, January 2011.
[8] Cristóbal Garrido-Novell, Dolores Pérez-Marin, Jose M. Amigo,” Grading and color evolution of apples using RGB and hyperspectral imaging vision cameras”,Journal of Food Engineering 113 (2012).
[10] Mohana S.H., Prabhakar C.J., and Praveen Kumar P.U.,” Surface Defect Detection and Grading of Apples”, Association of Computer Electronics and Electrical Engineers, 2013.
[11] P.Deepa, Dr.S.N.Geethalakshmi, ”A Comparative Analysis of Feature Extraction Methods for Fruit Grading Classifications”, IJETCAS – 2013. [12] Ms.Rupali S.Jadhav1, PROF. S.S.Patil, “A Fruit Quality Management System Based On Image Processing”, IOSR-JECE –December – 2013. [13] Harish Sahu, Praveen Bhanodia, “An ANALYSIS OF TEXTURE CLASSIFICATION: LOCAL BINARY PATTERN”, JGRCS – 2013.
[14] Ojala, T., Pietik¨ainen, M., M¨aenp¨a¨a, T.: Multiresolution Gray-scale and Rotation Invariant Texture Classification with Local Binary Patterns. IEEE Transactions on Pattern Analysis and Machine Intelligence 24 (2002) 971-987
[15] Vijay Paul Sharma and Dinesh Jain. (2011, July) [Online]. www.iimahd.ernet.in:8181/assets/upload/faculty/HighValueAgriWorkingPaper.pdf.
[16] Z. May and M. H. Amaran, "Automated Oil Palm Fruit Grading System using Artificial Intelligence," International Journal of Video & Image Processing and Network Security, vol. 11, no. 03, June 2011.
[17] Meftah Salem M. Alfatni , Abdul Rashid Mohamed Shariff , Helmi Zulhaidi Mohd Shafri, Osama M. Ben Saaed, and Omar M. Eshanta , "Oil Palm Fruit Bunch Grading System Using Red, Green and Blue Digital Number," Journal of Applied Sciences, vol. 8, no. 8, pp. 1444-1452, 2008.
[18] Xu Liming and Zhao Yanchao, "Automated strawberry grading system based on image processing," Computers and Electronics in Agriculture, vol. 71, no. Supplement 1, pp. S32-S39, April 2010.
[19] U. Ahmad, M. Suhil, R. Tjahjohutomo, and H.K. Purwadaria, "Development of Citrus Grading System Using Image Processing".
[20] Naoshi Kondo, Usman Ahmad, Mitsuji Monta, and Haruhiko Murase, "Machine vision based quality evaluation of Iyokan orange fruit using neural networks,"
[21] Computers and Electronics in Agriculture, vol. 29, no. 1-2, pp. 135-147, October 2000.
[22] Tajul Rosli Bin Razak, Mahmod Bin Othman(DR), Mohd Nazari Bin Abu Bakar(DR), Khairul Adilah BT Ahmad, and AB.Razak Bin Mansor, "Mango Grading By Using Fuzzy Image Analysis," in In proceedings of International Conference on Agricultural, Environment and Biological Sciences, Phuket, 2012.
[23] M. Khojastehnazhand, M. Omid, and A. Tabatabaeefar, "Development of a lemon sorting system based on colour and size," African Journal of Plant Science, vol. 4(4), pp. 122-127, April 2010.
[24] Yousef Al Ohali, "Computer vision based date fruit grading system: Design and implementation," Journal of King Saud University - Computer and Information Sciences, vol. 23, no. 1, pp. 29-39, January 2011.