Development of Relationship Between Saturation
Flow & Capacity of Mid-Block Section of urban
Road - A Case Study of Ahmedabad City
N. G. Raval Dr. P. J. Gundaliya
Ph.D. Scholar Professor
Department of Civil Engineering Department of Civil Engineering
KSV University L. D. College of Engineering
Dr. Gargee Rajpara
Professor
Department of Civil Engineering KSV University
Abstract
In India, Traffic consists of all type of motorized and non-motorized vehicles. All vehicles are of different static and dynamic characteristics. Traffic flow consists of different classes of vehicles and no lane is followed. The traffic management becomes very difficult due to higher growth rate of vehicles and non-availability of sufficient space in urban area. It leads to congestion, excessive delay and accidents on urban roads. All types of vehicles are converted into Passenger Car Unit (PCU). Due to fundamental differences in operating conditions on road and vehicles, the standard western relationships for predicting the saturation flows are not appropriate for countries like India. The existing model of Saturation flow estimates lower value of saturation flow compared to field saturation flow. Capacity is a key parameter for planning, design and operation of any type of urban roads. In the present study, Saturation flow and Capacity of mid-block section of urban roads are studied. It is necessary to develop the relationship between saturation flow and capacity at mid-block section of urban roads. In present study, the saturation flow is developed considering width and composition of various type of vehicles for the selected stretches of Ahmedabad city. The speed-flow relationship is developed for selected stretches of Ahmedabad city. The relationship is developed between saturation flow and capacity of mid-block section of urban road. The width of road and observed capacity are considered as variable, which are significantly affecting on saturation flow. The developed models are validated using statistical‘t’ test.
Keywords: Capacity, Composition of vehicles, Saturation flow, Traffic Volume, Width of road
________________________________________________________________________________________________________
I. INTRODUCTION
The urbanization is increased at rate of 35 to 40% in India. Due to rapid urbanization and increase in vehicle ownership, rate of growth of vehicles are also increased in urban area. The observed vehicular growth is in Ahmedabad city is about 12 to 15% per annum. The space available in the urban area is limited. It leads the problems related to control and regulate the traffic at intersection. The models available for measuring saturation flow are for homogeneous traffic condition. It is necessary to predict the saturation flow for designing the signalized intersection. In the present study, model is developed considering width of roads and traffic composition. The estimation of capacity is important parameter for deciding the adequacy or deficiency of any traffic facility in the urban area. Capacity is the maximum hourly volume (vehicles per hour) at which vehicle can reasonably be expected to traverse a point or a uniform section of a lane or roadway during a given time period under the prevailing roadway, traffic and control conditions. The estimation of field capacity is essential for deciding the facilities to be provided for any type of roads. It helps the planner for fulfilling the requirement of improving traffic facilities on the road. The capacity is measured in Passenger Car Unit (PCU) per hour. The speed-flow relationship is developed for selected stretches. The relationship is developed between capacity of mid-block section and saturation flow.
II. OBJECTIVE OF STUDY
Followings are the main objectives of present study:
1) To develop model for predicting saturation flow at selected intersection 2) To determine the capacity of mid-block section of selected stretches.
III. LITERATURE REVIEW
Sarna and Malhotra (1967)[1] developed the relationship between the saturation flow and the approach road width at signalized intersection. The Effect of approach volume and increasing percentage of bicycles on the saturation flow has been studied. Highway Capacity Manual (2000) [2] suggested the model for determining saturation flow considering base saturation flow rate, no of lanes in a lane group, adjustment factor for lane width, heavy vehicles, approach grade, parking activity, blocking effect of buses, area type, lane utilization, left turn, right turn, pedestrian adjustment factor etc. Webster (1958)[3] suggested the model for estimation of saturation flow considering road width. Bhattacharya and Bhattacharya (1982) [4] modified the model for estimating saturation flow. Chandra (1994) [5] also modified the model for estimating of saturation flow. Raval & Gundaliya (2012)[6] developed the relationship between saturation flow and width of road, traffic composition of various categories of vehicles. The developed models are statistically validated. Satish Chandra et al (2003)[7] studied the effect of lane width on capacity under mixed traffic conditions. The effect of carriage way width on Passenger Car Unit (PCU) values of various categories of vehicles was analyzed. The relationships were derived between capacity and carriage way width. The adjustment factors were determined for estimating capacity of road. In this study, it was concluded that the capacity increases with increment of width of carriageway. Satish Chandra (2004)[8] carried out research on effect of road roughness on capacity of two-lane roads of National Highways and State Highways of India. The data of speed and volume were collected for free flow speed of highways. He analyzed effect of road roughness of selected stretches. The study showed that free flow speed of a vehicle decreases with the roughness of the road surface. S. Velmurugan et al (2010)[9] determined capacity of multilane high speed corridors for heterogeneous traffic condition using the traditional and microscopic models. In this study, speed-flow equations and roadway capacities were critically evaluated. Ahmed Munawar (2011)[10] conducted various experiments for determination of capacity of urban road for Yogyakarta city. It was concluded that side friction is responsible factor for reduction of capacity. Hashim Ibrahim Hassan et al (2012)[11] studied on capacity loss due to effect of highway geometric. It was observed that capacity is reduced at curve due to reduction of speed and increases the spacing between the vehicles. Patel Chirag et al (2013)[12] estimated field capacity and level of service for urban arterial road for heterogeneous traffic condition for six lane divided road. The speed – flow relationship was developed for Surat city of Gujarat state of India. The field capacity for the six lane roads was determined and compared with recommended values given by Indian Road Congress (IRC). Raval & Gundaliya (2017)]13] developed the models for estimating capacity of urban arterial rods. The observed capacity and capacity suggested by IRC : 106 – 1990 are compared. The observed capacity is 49 to 80% higher than the capacity suggested by IRC: 106-1990. All developed models for estimating capacity are statistically validated.
IV. DATA COLLECTION AND ANALYSIS
Following are the intersection selected for the study: 1) Paldi Intersection
2) Nehru bridge Intersection 3) Shastrinagar Intersection
Data are collected during the period of November to April, 2017. Traffic data are collected manually on the field. All signals are pre-timed signals. The traffic data were recorded for about 120 minutes for each approach. The widths of approach are measured. About 780 sets of data are collected for development of model.
Table – 1
Composition of Vehicular Growth at various Intersections
Sr. No. Approach Two Wheelers Three Wheelers Car Bus LCV HCV Cycle Nehru bridge Intersection
1 North 54% 22% 17% 3% 2% 0% 2%
2 South 57% 22% 16% 2% 2% 0% 1%
3 East 73% 15% 9% 1% 0% 0% 1%
4 West 55% 26% 13% 0% 2% 0% 5%
Paladi Intersection
1 North 49% 33% 11% 2% 3% 0% 2%
2 South 54% 31% 9% 1% 3% 0% 2%
3 East 64% 16% 12% 3% 2% 0% 3%
4 West 57% 25% 10% 3% 2% 0% 3%
Shastrinagar Intersection
1 North 72% 7% 15% 1% 1% 0% 4%
2 South 66% 11% 16% 1% 2% 0% 3%
3 East 59% 15% 16% 1% 2% 0% 6%
4 West 70% 13% 13% 1% 2% 0% 2%
Model 1:
Saturation flow = 1046W + 27TW – 38Auto – 30Car – 296Bus – 124LCV + 259HCV + 72CY (1) Where, W = width of road in meter
TW = Share of two wheelers in % age Auto = Share of auto in %age Car = Share of Car in %age Bus = Share of Bus in %age
LCV = Share of Light Carrier Vehicle in %age HCV = Share of Heavy Carrier Vehicle in %age Cy = Share of Cycle in %age
R square = 0.95
The developed model 1 is validated using statistical‘t’ test at significance level of 0.05 with degree of freedom of 767.
Variables t observed Model 1
W 21.12
TW 4.57
Auto -3.92
Car -1.70
Bus -5.70
LCV -2.09
HCV 1.63
Cy 1.77
Absolute t 1.96
In Model-1, the absolute value of‘t’ is significantly high for width of road, traffic composition of two wheelers (TW), auto, bus and LCV than absolute ‘t’. It can be concluded that the slope coefficient is useful in estimating the saturation flow for intersection of urban roads considering width of roads and traffic composition of two wheelers (TW), auto, bus, LCV and cycle.
V. SPEED – FLOW RELATIONSHIP
The Speed – Flow study is carried out on selected mid-block sections of Ahmedabad city. All selected approaches are sub arterial roads of Ahmedabad city. The detail of the study area is shown in the Table 2.
Table – 2
Details of selected mid-block stretches of urban roads Sr.
No. Mid-block Stretch of the road
Width of road in meter (one sided)
Number of lanes and width of roads (As per IRC:106-1990)
1 Manav Mandir to Gurukul 10 4 lane divided (two way)
2 Sattadhar cross road to Sun-n-Step
road 8.8 4 lane divided (two way)
3 Shastrinagae to Pragatinagar 10.7 4 lane divided (two way)
4 C. G. road 7.2 4 lane divided (two way)
5 Paldi to Elis bridge road 8.75 4 lane divided (two way)
6 Nehru bridge to Times of India road 8.85 4 lane divided (two way)
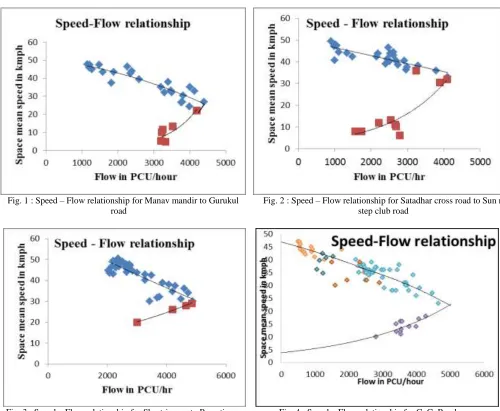
Fig. 1 : Speed – Flow relationship for Manav mandir to Gurukul road
Fig. 2 : Speed – Flow relationship for Satadhar cross road to Sun n step club road
Fig. 3 : Speed – Flow relationship for Shastrinagar to Pragatinagar road
Fig. 4 : Speed – Flow relationship for C. G. Road
Fig. 5 : Speed – Flow relationship for Paldi to Elis Bridge road Fig. 6 : Speed – Flow relationship for Nehru bridge to Times of India road
VI. RELATION BETWEEN CAPACITY OF MID-BLOCK SECTION AND SATURATION FLOW
Capacity of selected urban roads is determined from fig. Saturation flow is determined using Model 1. The width of road and capacity of urban road is considered as a variable and regression technique is used for development of relationship between saturation flow and capacity of urban roads.
Table – 3
Details of selected urban road sections Sr.
No. Name of section
Width of road in meter
Observed Capacity in PCU/hour/direction
Saturation flow PCU/hour
1 Manav Mandir to Gurukul road 10 4400 10565
2 Satadhar to Sun n step club road 8.8 4090 9690
3 Shastrinagar to Pragatinagar
road 10.7 4850 11571
4 C. G. Road 7.2 5000 7751
5 Paldi to Elisbridge road 8.75 4700 8369
6 Nerubridge to Time of India road 8.85 4578 8967
Model – 2:
Saturation flow = 1113W – 0.12 C (2) Where, W = Width of road in meter
C = Capacity of urban road in PCU/hour/direction R square = 0.99
Model – 3:
Saturation flow, S = 2 C (3) Where, C = Capacity of urban road in PCU/hour/direction
R square = 0.97
Table – 4
The developed model (2) and (3) are validated using statistical ‘t’ test at significance level of 0.05
Variables t observed Model 2 Model 3
W 7 --
C -0.42 13
Absolute t 2.77 2.57
In Model-2, the absolute value of ‘t’ is significantly high for width of road than absolute ‘t’. It can be concluded that the slope coefficient is useful in estimating the saturation flow for intersection of urban roads considering width of roads and capacity of mid block section
In Model-3, the absolute value of ‘t’ is significantly high for absolute ‘t’. It can be concluded that the slope coefficient is useful in estimating the saturation flow for intersection of urban roads considering capacity of mid-block section
VII.CONCLUSION
Saturation flow is an important parameter for design of signalized intersection. Accurate determination of saturation flow is necessary to find optimum signal cycle timing.
The model 1 is developed for predicting saturation flow at selected intersections of Ahmedabad city. The developed model is validated statistically by using ‘t’ test.
The speed – flow relationship is developed for selected mid-block section of urban roads. The observed capacity is used for finding out relationship between capacity and saturation flow.
The Model 2 estimates the saturation flow using variables like capacity and width of road. The r square value indicates good relationship between dependent and independent variables. The developed model is validated using ‘t’ test.
The Model 3 indicates relationship between saturation flow and capacity of urban roads. It indicates good relationship between capacity and saturation flow. The model is validated using ‘t’ test.
It is observed from the study that percentage share of two wheelers, auto and car affects significantly on saturation flow.
REFERENCES
[1] Sarna, A.C. & Malhotra, S.K. (1969), “Traffic Delays at Signalized Intersections”, Road Research Paper No. 107, CRRI, New Delhi. [2] Highway Capacity Manual, Transportation Research Board, Washington, DC, 2000
[3] Webster, F.V. (1958), “Traffic Signal Settings”, Road Research Technical Paper No. 3, HMSO, London, England.
[4] Bhattacharya, P.G. & Bhattacharya, A.K. (1982), “Observation and Analysis of Saturation Flow Through Signalized Intersection in Calcutta” – Indian Highways, Vol. 10(4), Indian Roads Congress, New Delhi, PP 11-33.
[5] Chandra, S. (1994), “Development of Capacity Analysis Procedure for Urban Intersection”, Ph. D. Thesis, University Of Roorkee, Roorkee, India. [6] Raval N. G. and Gundaliya P. J. (2012), “Modification of Webster’s Delay Formula using Modified Saturation Flow Model for Non-lane based
[7] Chandra Satish and Kumar Upendra (2003). “Effect of Lane width on Capacity under Mixed Traffic Conditions in India”, Journal of Transportation Engineering, 155-160.
[8] Chandra S. (2004), “Capacity Estimation Procedure for Two-Lane Roads Under Mixed Traffic Conditions”, Indian Road Congress, Paper No – 498, page – 139-169
[9] Velmurugan S., Errampalli Madhu, Ravinder K., Sitaramanjaneyulu K. and Gangopadhyay S. (2010). “Critical Evaluation of Roadway Capacity of Multi-lane High Speed Corridors Under Heterogeneous Traffic Conditions Through Traditional and Microscopic Simulation Models, Paper no 566, Indian Road Congress, October – December – 2010.
[10] Munawar Ahmad (2011). “Speed and Capacity for Urban Roads, Indonesian Experience, Procedia – Social and Behavioral sciences, 16, 382-387. [11] Hassan Hashim Ibrahim and Talaat Ali Abdelwahed (2012). “Effect of Highway Geometric Characteristics on Capacity Loss”, Journal of Transportation
Engineering System and Information Technology, Volume – 12, No. 5, 65-75
[12] Patel Chetan R. and Dr. Joshi G. J. (2012). “Capacity and LOS for urban arterial road in Indian mixed traffic condition”, Procedia – Social and Behavioral sciences, 48, 527-534.