http://www.sciencepublishinggroup.com/j/ijmea doi: 10.11648/j.ijmea.20170503.13
ISSN: 2330-023X (Print); ISSN: 2330-0248 (Online)
Optimization of Molding Sand Composition for Casting Al
Alloy
Sumaiya Shahria, Md. Tariquzzaman, Md. Habibur Rahman
*, Md. Al Amin, Md. Abdur Rahman
Department of Industrial Engineering and Management, Khulna University of Engineering & Technology (KUET), Khulna, Bangladesh
Email address:
[email protected] (Md. H. Rahman)
*
Corresponding author
To cite this article:
Sumaiya Shahria, Md. Tariquzzaman, Md. Habibur Rahman, Md. Al Amin, Md. Abdur Rahman. Optimization of Molding Sand Composition for Casting Al Alloy. International Journal of Mechanical Engineering and Applications. Vol. 5, No. 3, 2017, pp. 155-161.
doi: 10.11648/j.ijmea.20170503.13
Received: March 6, 2017; Accepted: April 5, 2017; Published: May 17, 2017
Abstract:
In the aluminum casting industry, the foundry manufacturers find the quality of the sand mold as important fact to achieve high quality aluminum castings. The aim of this research is to reduce aluminum casting defects by optimizing proportion of water and bentonite added to a recycled sand mold. Aluminum 356 alloy was preferred for this research based on the traditional method of trial and error twelve castings were performed with the different proportion of sand, bentonite, and water. A five scale rating method has been applied to rate the casted product upon number of defects. This research has been carried out by analyzing the variance (ANOVA) by using Minitab 17.0 software and finally concludes with the optimum level of composition for casting Al with the result of 90% sand, 5% bentonite, and 5% water.Keywords:
Aluminum Casting, Foundry, Molding Sands, Bentonite, Optimum Level of Composition1. Introduction and Literature Review
Among all the castings, sand casting is the most widely used (over 70%) metal casting process in manufacturing industry. A great advantage of sand in manufacturing application is that sand is inexpensive. Sand casting can range in size from very small to extremely large. Some examples of items manufactured in modern industry by sand casting process are pump housings, engine blocks, cylinder heads, machine tool bases, and valves, just to name a few. Usually sand used to manufacture a mold for casting process is held together by a mixture of water and clay. A typical mixture by volume could be 89% sand, 7% clay, and 4% water. Casting is a very versatile process capable of being used in mass production items in very large shaped pieces, with intricate designs and having properties unobtainable by any other methods. The major activities involved in making a casting are molding, melting, pouring, solidification, fettling, cleaning, inspection and elimination of defective castings [1]. To some extent, the severity of these defects may result in a complete rejection of the part there by losing a huge amount of resources spent from product and casting design to final
production [2]. Actually this discontinuity starts with the inappropriate method of preparing mold. Various methods of casting are renowned, but among all these sand casting is the most primitive one and is used worldwide due to its simplicity and cost effectiveness. It is natural to have certain defects on the casted product but there also exists the solution to minimize those defects primarily before reaching the finishing operation.
time [6]. Ramón Ángel et al. aimed to optimize the production of grey cast pump impellent castings using Response Surface Methodology (RSM) approach in a foundry producing grey cast iron components [7]. Manjunath Patel et al. discuss about the advantages and limitations of some conventional and non-conventional modelling tools applied for various casting processes and the necessary steps for prediction and optimization are high lightened by identifying the trends in the literature [8]. However, it was observed that processing methods [9-11], casting geometry and size [12], physical and chemical conditions [13], mold and casting material properties [14], process variables [15-17] and so on directly affect the Heat Transfer Coefficient (HTC). Casting defects such as, Shrinkage, sand drop, sand blow holes, scabs, pinholes and optimal process parameter, output ratio of metal, shorten manufacturing period, energy saving sources, reduction of pollution and improvement of the competitiveness of enterprises are analyzed in [18-20]. Composition of molding sand, on hardness, tensile strength and density of Aluminium alloy castings are studied and optimization aspects of casting process, necessity of investigation of the process parameters and process optimization and technical solution for minimizing various casting defects are investigated in [21-24]. M. Viquar Mohiuddin et al. showed the amount of clay and the amount of moisture are the parameters making significant influence on mechanical properties of casting based on optimum level of parameters, and also showed the performance of verification test and the results of confidence level and confirmation of the validity of selected approach in enhancing and optimizing the sand mold casting process for Aluminium alloys [25].
The purpose of this study is to make a result of optimal level of molding sand composition for the improvement of aluminum casting is necessary for the reduction of casting defects. The objectives of this research deal with (1) the determination of the optimum percentage of sand, bentonite, and water (2) observation of the microstructure of the aluminum (al-356) casted flywheel and (3) make a visible comparison of the conventional microstructure of al-356 with the casted flywheel. The research also established the optimum percentage of sand, water, and clay for Al-356 casting alloy and to make a visible comparison of the conventional microstructure of Al-356 with the casted product.
2. Methodology
Experimental Process
Experiments were performed in a small scale foundry shop producing aluminum alloy parts. The proposed method of casting defects analysis involves two techniques, therefore according their requirements; different castings with different defects were identified.
2.1. Casting Process
Sand casting requires some sequential steps. The
conventional sand casting procedure is given below through theflow chart in Figure 1
Figure 1. Flow chart of conventional sand casting process.
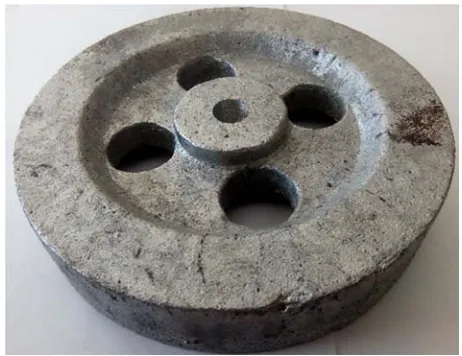
The casting process for this research has been completed through the sequential steps (1) obtaining the casting geometry (2) casting patternmaking (3) core making & molding (4) alloy melting and pouring and (5) cleaning the casted product. The final product has been shown in Figure 2.
Figure 2. Casted product.
2.2. Green Sand Processing
Green sand is made up of basic sand (shell sand), bentonite or another binder, and Water. Green sand properties cannot be standardized for all foundries and castings as such, yet place to place and job to job the specifications can be set to maintain minimal amount of rejection. A basic set of parameters to test are fineness number of the base sand, moisture content in the mixture, permeability, total clay content (dust content), active clay content and compressive strength.
2.3. Materials
Green sand casting is one of the most widely used manufacturing technique. The molding sand mixture consisted of three components (1) molding sand (2) bentonite and (3) water.
2.4. Procedure
conducting the mixture experiments as follows:
2.4.1. Setting the Objective
The main objective was to optimize the proportions of molding sand, bentonite, and water.
2.4.2. Determining the Upper and Lower Limits of the Mixture
The proportion ranges of the one-time recycled molding sand, bentonite, and water were 90%, 2-9%, and 3.5-5% respectively. These proportion ranges were selected from literature and foundry. There have been performed 12 experiments separately with the different proportion of sand, bentonite and water within the predefined range.
2.4.3. Developing the Design Matrix Experiments
The sand mixture was not remained constant. Bentonite and water was varied in percentage. The research was conducted with 12 separate run of variable proportion of sand (87-93%), bentonite (2-9%) and water (3.5-5%).
2.4.4. Choosing the Most Defect Free Casted Product
All the 12 Al-356 casted product was observed very carefully on the basis of various defects produced on the
product. Among variety of defects, defects like blow holes, pin holes, sand spot were the most concerning ones in our products. The defects were rated within the 5 rating scale. Then the sample no. or the product with the least average number of defects was chosen as the most defect free product.
Rating, 1 = very small amount, 2 = small amount, 3 = medium amount, 4 = large amount, 5 = very large amount
2.4.5. Analyze the Relation of Components with the Defects
Different types of graphs have been plotted using one way ANOVA analysis that shows the degree of defect with the changing in the amount of sand, bentonite and water
2.4.6. To Make a Comparison of Microstructure with the Conventional One
Both the microstructure of the most defect free casted product and the product from conventional proportion was observed using the optical microscope.
Different types of composition and various defects have been integrated with the defects rating that has been shown in the following Table 1.
Table 1. Defect rating.
Sample no. Composition in percentage (%) Blow holes (no. of holes) Pin holes(Rating) Sand spot(rating) Avg. rating Sand bentonite water
1 90 6.00 4.00 1 3 1 1.67
2 90 5.00 5.00 0 3 1 1.33
3 90 5.50 4.50 1 3 2 2.00
4 93 3.50 3.50 1 2 2 1.67
5 93 3.00 4.00 0 5 4 3.00
6 93 2.00 5.00 0 3 3 2.00
7 88 7.00 4.00 1 3 2 2.00
8 88 7.50 4.50 1 4 2 2.33
9 88 8.00 4.00 3 3 3 3.00
10 88 8.50 3.50 1 2 5 2.67
11 87 9.00 4.00 0 3 5 2.67
12 87 8.50 4.50 0 4 5 3.00
2.5. Casting Defects
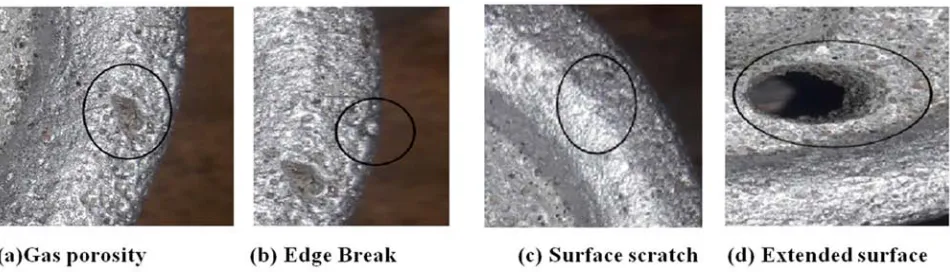
The research has integrated different types of casting defects like gas porosity, edge break, surface scratch and extended surface created in the casting process that are shown in the following Figure 3 (a-d).
Figure 3. Casting defects.
One of the commom casting defects occures as breakage of edges. This may be caused, because of shortage of
breaks are shown in the casted product marked with a circle in the magnified form. They are comparatively difficult to identify with naked eye. As they are clearly visible under the magnifying microscope. A circle helps to merely notice the possibility no scratches in the certain area in the figure. These types of casting defects causes due to low green strength, low mold hardness, using hot sands, insufficient reinforcement. Position of runner riser is also a vital concern even poor handling of cope and drag.
3. Data Analysis
3.1. Defect Identification and Rating
Following are 12 separate product (flywheel) after casting. Defects mentioned previously were analyzed visually and rated on 5 scale rating method.
3.2. Graph Plotting
We have plotted graphs to show the severity of defects occurred with different proportion of sand, bentonite and water.There are three types of graph (1) Defect vs. Sand (2) Defect vs. Bentonite and (3) Defect vs. Water
The Figure 4 shows that defects are caused due to the smaller proportion of sand. When the sand is near 87% the defect rate is up to 3, whereas with 90% sand defects reduced to 1.5 and started to increase with increasing in sand proportion. But this is not the only fact that causes different defect rates.
Figure 4. Graph of detect vs sand.
Figure 5. Graph of detect vs bentonite.
The Figure 5 shows different rates of defects due to the variation of proportion of bentonite. Defect rate is high for 3% bentonite so as in 8% but substantially low at the percentage of 5 and the Figure 6 shows in which rare defects appeared with different proportion of water. Normally water is kept within 2-6%. In our proposed method the least amount of defect occurred with 5% of water. Though the amount fluctuated merely 4-4.5% of water, it is visibly less in 5% water as dictated below.
Figure 6. Graph of detect vs bentonite.
3.3. ANOVA Analysis
This research has identified the differences between groups on some variables with the help of Analysis of variance (ANOVA) that is shown in Table 2-4 to investigate and model the relationship between a response variable and one or more independent variables.
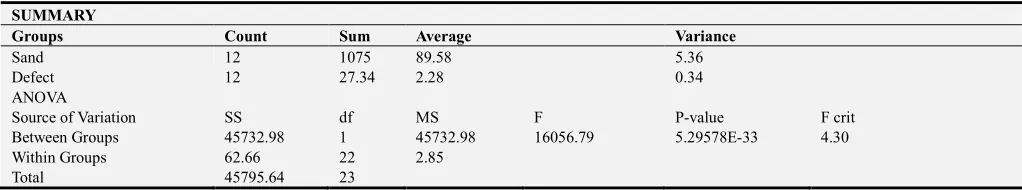
Table 2. One-way ANOVA: Defect versus Sand (ANOVA- Single Factor). SUMMARY
Groups Count Sum Average Variance
Sand 12 1075 89.58 5.36
Defect 12 27.34 2.28 0.34
ANOVA
Source of Variation SS df MS F P-value F crit
Between Groups 45732.98 1 45732.98 16056.79 5.29578E-33 4.30
Within Groups 62.66 22 2.85
Total 45795.64 23
93 90
88 87
3.0
2.5
2.0
1.5
Sand
D
e
fe
c
t
Casting Defect for Sand proportion
9.0 8.5 8.0 7.5 7.0 6.0 5.5 5.0 3.5 3.0 2.0 3.0
2.5
2.0
1.5
Bentonite
D
ef
ec
t
Casting Defect for Bentonite proportion
5.0 4.5
4.0 3.5
3.0
2.5
2.0
1.5
Water
D
e
fe
c
t
Table 3. One-way ANOVA: Defect versus Bentonite (ANOVA- Single Factor). SUMMARY
Groups Count Sum Average Variance
Bentonite 12 73.5 6.125 5.55
Defect 12 27.34 2.278 0.34
ANOVA
Source of Variation SS df MS F P-value F crit
Between Groups 88.78 1 88.78 30.14 1.62291E-05 4.30
Within Groups 64.81 22 2.95
Total 153.58 23
Table 4. One-way ANOVA: Defect versus Water (ANOVA- Single Factor). SUMMARY
Groups Count Sum Average Variance
Water 12 51.5 4.29 0.29
Defect 12 27.34 2.28 0.34
ANOVA
Source of Variation SS df MS F P-value F crit
Between Groups 24.32 1 24.32 76.73 1.26759E-08 4.30
Within Groups 6.97 22 0.32
Total 31.294 23
3.4. Microstructure Analysis
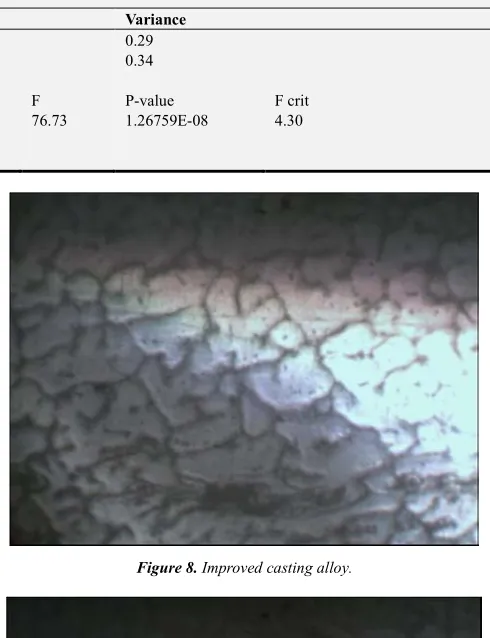
The microstructure of the components analyzed consists of a primary phase, α-Al solid solution, and a eutectic mixture of aluminum and silicon. The primary phase precipitates from the liquid in the form of dendrites. The addition of strontium changes the eutectic silicon aspect ratio from acicular to fibrous. Fibrous eutectic silicon particles improve the mechanical properties of cast aluminum-silicon alloys [26]. The microstructure of the castings realized, by means of the two different kinds of core, has been compared in order to evaluate whether the different thickness of cores has a role in the microstructural and mechanical properties of the alloy. The distribution of eutectic silicon particles is generally uniform and globular.
The microstructure shows rounded void with small walls and occurred due to gas dissolved in metal during melting and pouring. We can also see the angular voids with dendrite arms protruding into the voids a fine micro porosity that is shown in Figure 7
Figure 7. Casting realized with empty core.
Figure 8. Improved casting alloy.
Figure 9. Conventional casting alloy.
free than the convetional casted products. The above figures of microstructural view represents the microstructure of the research alloy and conventional alloy with certain defects and suggests the composition of the impoved research alloy.
4. Results and Discussion
All the twelve Al-356 casted products were observed very carefully on the basis of various defects produced on the product. Among variety of defects, defects like blow holes, pin holes, sand spot were the most concerning ones in our
products. The defects were rated within the 5 rating scale. Then the sample no. or the product with the least average number of defects was chosen as the most defect free product. Our research finds that sample No. 2 has the least number of defects having 90% sand, 5% bentonite, and 5% water was selected as the desired product. With the help of DOE (design of experiment) software it has shown the amount of defects with various proportions of sand and bentonite simultaneously that is easily visualized this with the help of 3D view of Figure 10.
Figure 10. 3D surface graph.
5. Conclusion
Casting defects occur because optimum conditions are not met during casting process and that is not possible to get rid of these defects completely. Comparison between the product with conventional mixture and our proposed proportion of mixture showed significant differences in the number of defects. This study concludes that the data obtained can be applied to set the parameters at optimum level so as to minimize defects and improve quality of aluminum alloy sand casting.
References
[1] Ganesh G. Patil, Dr. K. H. Inamdar, Optimization of Casting Process Parameters using Taguchi Method, International Journal of Engineering Development and Research (IJERD), Vol. 2, No. 2, pp. 157 – 164 (2014).
[2] Achamyeleh A. Kassie1, Samuel B. Assfaw, Minimization of Casting Defects, IOSR Journal of Engineering (IOSRJEN),
Vol. 3, No. 5, pp. 31-38 (2013).
[3] Charnnarong Saikaew, Sermsak Wiengwiset, Optimization of molding sand composition for quality improvement of iron castings, ELSEVIER, Vol. 67-68, pp. 26-31 (2012),doi.org/10.1016/j.clay.2012.07.005.
[4] Shun-cheng WANG, Nan ZHOU, Wen-jun QI, Kai-hong ZHENG, Microstructure and mechanical properties of A356 aluminum alloy wheels prepared by thixo-forging combined with a low superheat casting process, ELSEVIER, PP. 2214-2219, (2014), DOI:10.1016/S1003-6326(14)63335-5.
[5] Mekonnen Liben Nekere, Ajit Pal Singh, Optimization of Aluminium Blank Sand Casting Process by Using Taguchi’s Robust Design Mrthod, International Journal for Quality research, Vol.6, No.1, pp.81-97 (2012).
[6] S. U. Behm, K. L. Gunter, J. W. Sutherland, ‘An Investigation into the Effect of Process Parameter Settings on Air Emission Characteristics in the Lost Foam Casting Process’ American Foundry Society,(2003).
[7] Ramón Ángel Pons Murguía1, Eulalia María Villa González del Pino, Yanko Bermúdez Villa, Janeisy Hernández del Sol,
‘Quality improvement of a casting process using design of experiments’, Enero - Junio de2016, Vol. 14, No. 1, pp. 47-53.
Design-Expert® Software Factor Coding: Actual Std Error of Design Std Error Shading
1.500 0.500 X1 = A: Sand X2 = B: Bentonite Actual Factor C: Water = 4.25
2 3 4
5 6 7
8 9 87 88 89 90 91 92 93 0.000
2.000 4.000 6.000 8.000 10.000
S
td
E
rr
o
r
o
f
D
e
s
ig
n
A: Sand (%)
[8] Manjunath Patel GC, Krishna P and Parappagoudar MB, Modelling in Squeeze Casting Process-Present State and Future Perspectives, Advances in Automobile Engineering, Vol. 4, No. 1, pp.1-9 (2015),doi:10.4172/2167-7670.1000111.
[9] Narayan Prabhu K, Ravishankar BN, Effect of modification melt treatment on casting/chill interfacial heat transfer and electrical conductivity of Al–13% Si alloy, Materials Science and Engineering: A, Vol.360, No.1-2, pp. 293-298 (2003).
[10] Lynch RS, Olley RS, Gallaher PCJ, Squeeze casting of aluminium. AFS Trans 122:569-576 (1975). 18. Williams G, Fisher KM, Squeeze forming of aluminium-alloy components. Metals Technology 8: 263-267 (1981).
[11] Sun Z, Zhang X, Hu H, Niu X, Section thickness-dependant interfacial heat transfer in squeeze casting of aluminum alloy A443. In IOP Conference Series: Materials Science and Engineering 27: 12073 (2012).
[12] Kim TG, Lee ZH, Time-varying heat transfer coefficients between tube-shaped casting and metal mold. International journal of heat and mass transfer, Vol.40, pp.3513-3525 (1997).
[13] Hamasaiid A, Dargusch MS, Davidson CJ, Tovar S, Loulou T, et al.,Effect of mold coating materials and thickness on heat transfer in permanent mold casting of aluminum alloys, Metallurgical and materials Transactions A, Vol.38, No.6, pp.1303-1316 (2007).
[14] Chattopadhyay H, Simulation of transport processes in squeeze casting, Journal of materials processing technology,ELSEVIER, Vol.186, pp. 174-178(2007), doi:10.1016/j.jmatprotec.2006.12.038.
[15] Nishida Y, Matsubara H, Effect of Pressure on Heat Transfer at the Metal Mold-Casting Surface, Br. Foundryman Vol.69, pp. 274-278 (1976).
[16] FardiIlkhchy A, Jabbari M, Davami P, Effect of pressure on heat transfer coefficient at the metal/mold interface of A356 aluminum alloy, International Communications in Heat and Mass Transfer Vol.39, pp.705-712 (2012), DOI:10.1016/j.icheatmasstransfer.2012.04.001
[17] Gunasegaram DR, Nguyen TT, Comparison of heat transfer parameters in two permanent molds, AFS Trans Vol.105, pp. 551-556 (1997).
[18] Saravana kumar. M, Jeya prakash. K, ‘OPTIMIZATION OF
CASTING PROCESS PARAMETERS USING TAGUCHI ANALYSIS’, International Journal of Mechanical Engineering and Research, Vol. 5 No.1, pp.134-136,(2015).
[19] Kidu Geberecherkos Weldeanenia, Asmamaw Tegegne Abebe, ‘Optimization of Sand Casting Process Parameters for 46MnSi4 Alloy Steel Trash Plate Castings Applicable for Roller Stand’, International Journal of Engineering Trends and Technology (IJETT), Vol.41 No.8 (2016).
[20] Raghwendra Banchhor, S. K. Ganguly, OPTIMIZATION IN GREEN SAND CASTING PROCESS FOR EFFICIENT, ECONOMICAL AND QUALITY CASTING, International Journal of Advanced Engineering Technology, Vol.5, No. 6, pp. 25-29(2014).
[21] Yazad N. Doctor, Dr. Bhushan T. Patil, et al., Review of Optimization Aspects for Casting Processes, International Journal of Science and Research (IJSR), Vol. 4, No.3, pp. 2364-2368(2015).
[22] M. Viquar Mohiuddin, A. Krishnaiah, S. Ferhathullah Hussainy, Effect of Composition of Sand Mold on Mechanical Properties and Density of Al-Alloy Casting Using Taguchi Design Approach,Int. Journal of Engineering Research and Applications, Vol. 5, No.3, pp.37-41(2015).
[23] Sunil Chaudhari, Hemant Thakkar, Review on Analysis of Foundry Defects for Quality Improvement of Sand Casting,
Int. Journal of Engineering Research and Applications, Vol. 4, No.3, pp.615-618(2014).
[24] Mohammed Viquar Mohiuddin, Syed Ferhathullah et al., Experimental Study of Sand Mold Process Parameters on Al-Alloy Sand Castings Using DoE,IOSR Journal of Mechanical and Civil Engineering (IOSR-JMCE), Vol. 11, No. 6, PP 01-06(2014).
[25] M. Viquar Mohiuddin, A. Krishnaiah, S. Ferhathullah Hussainy, INFLUENCE OF SAND MOLDING PROCESS PARAMETERS ON PRODUCT QUALITY OF AL-SI ALLOY CASTING - AN ANOVA APPROACH, International Journal of Advance Research In Science And Engineering (IJARSE), Vol.4, No.1, pp.1751-1760(2015).