This is a repository copy of
Tanzanian forest tree plot diversity and elevation
.
White Rose Research Online URL for this paper:
http://eprints.whiterose.ac.uk/1548/
Article:
Lovett, J.C. (1999) Tanzanian forest tree plot diversity and elevation. Journal of Tropical
Ecology. pp. 689-694. ISSN 1469-7831
https://doi.org/10.1017/S0266467499001108
[email protected] https://eprints.whiterose.ac.uk/ Reuse
Items deposited in White Rose Research Online are protected by copyright, with all rights reserved unless indicated otherwise. They may be downloaded and/or printed for private study, or other acts as permitted by national copyright laws. The publisher or other rights holders may allow further reproduction and re-use of the full text version. This is indicated by the licence information on the White Rose Research Online record for the item.
Takedown
If you consider content in White Rose Research Online to be in breach of UK law, please notify us by
SHORT COMMUNICATION
Tanzanian forest tree plot diversity and
elevation
JON C. LOVETT
Environment Department, University of York, Heslington, York YO1 5DD, UK
KEY WORDS: Diversity, elevation, Tanzania, forest, trees
Observed variation in species richness on ecological gradients and between regions has attracted several different explanations. Climatic factors, such as energy availability, precipitation and mean annual temperature, are frequently cited to explain differences in species richness (Wrightet al. 1993). The relative amount of variation in these variables may be of importance as well as absolute values (Stevens 1989, 1992). Alternatively, the history of colonization and extirpation have been used to explain regional variation in diversity (Guo et al.1998; Latham & Ricklefs 1993a, b). Area is an important factor, for example on an elevational gradient the tops of mountains are not only cooler than the bottoms, but they are also much smaller (Rahbek 1997).
In tropical Africa declines in forest tree species richness with elevation have been reported in both fixed area plots and elevational bands (reviewed in Ham-ilton 1989). However, a study in the Eastern Arc forests of Tanzania using plots in which a fixed number of stems were enumerated (200 plots each of 20 trees ofM20 cm dbh) did not show a decline in species richness of the plots with elevation (Lovett 1996). In this paper additional data (a further 163 plots) are used to confirm this observation and to demonstrate that the number of species found in a plot is independent of the potential pool of species. Examina-tion of some of the plots that are known to be from old secondary forests shows that disturbance may be a factor that leads to low diversity.
A total of 363 plots from the Eastern Arc forests were available for analysis from published and unpublished sources for the following mountains (Table 1): West Usambara (Lovett 1996, Hall 1991); East Usambara (Hamilton et al. 1989); Southern Nguru (Lovett 1996); Malundwe (Lovett & Norton 1989); Northern Udzungwa (Lovett 1996); and Southern Udzungwa (Lovettet al. 1997,
J . C . L O V E T T
[image:3.595.110.481.126.200.2]690
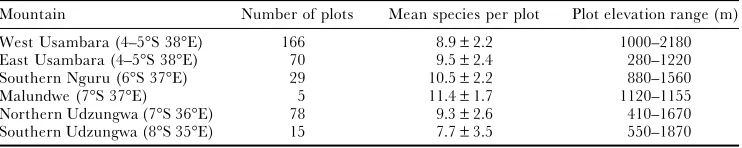
Table 1. Eastern Arc mountains (with approximate latitude and longitude) where plots were enumerated with number of plots, mean number of species per plot with standard deviation and elevation range of the plots.
Mountain Number of plots Mean species per plot Plot elevation range (m)
West Usambara (4–5°S 38°E) 166 8.9±2.2 1000–2180 East Usambara (4–5°S 38°E) 70 9.5±2.4 280–1220 Southern Nguru (6°S 37°E) 29 10.5±2.2 880–1560
Malundwe (7°S 37°E) 5 11.4±1.7 1120–1155
Northern Udzungwa (7°S 36°E) 78 9.3±2.6 410–1670 Southern Udzungwa (8°S 35°E) 15 7.7±3.5 550–1870
J. Lovett unpubl. data). The Eastern Arc mountains of eastern Tanzania and southeastern Kenya are defined as those mountains on ancient crystalline gneissic rocks under the direct climatic influence of the Indian Ocean from the Makambako Gap (8°51′S 34°49′E) to the Taita Hills (3°25′S 38°20′E) (Lovett 1990). The Eastern Arc forests are unusual in that they contain a high proportion of restricted range species, leading them to be regarded as an important biodiversity ‘hotspot’ (Mittermeier et al. 1998, Myers 1990). This feature of the forests has been attributed to an exceptionally long period of environmental stability in the area (Lovett & Friis 1996).
The plots were assessed using the twenty-tree variable-area plotless tech-nique (Hall 1991) in which the nearest 20 trees ofM20 cm diameter at breast height (dbh) to an objectively chosen point were measured and identified. Most of the plots were enumerated in moist forest on the eastern slopes with a mean annual rainfall in excess of 1000 mm, the exception being plots from the distinctive dry montane Juniperusforests with a rainfall of 600–900 mm y−1
from the western West Usambara mountains. There are few meteorological stations in the forested area so it is not possible to directly correlate plot divers-ity with rainfall. Data from the CIAT/FAO climate database show that rainfall for stations in eastern (M35°E) Tanzania receivingM1000 mm y−1is not
cor-related with elevation (n=167, elevation range 0–1921 m, r2=0.015, P=0.11).
Temperature is correlated with elevation. Eastern Tanzanian meteorological stations receiving M 1000 mm y−1
show a lapse rate of 0.5–0.6°C per 100 m elevation (mean monthly maximum temperature = −0.50x+28.55, r2=0.96;
mean monthly minimum temperature= −0.57x+24.32, r2=
0.96; where x=(m)/100 elevation).
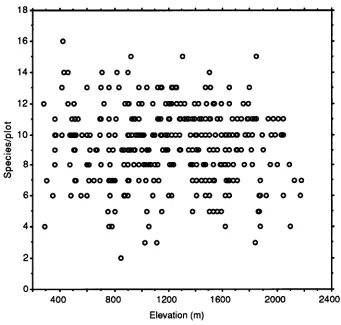
Figure 1. Relationship of number of species in each 20-tree plot and elevation (n=363).
are 91 species, in submontane forest (800–1400 m) there are 114 species, in montane forest (1200–1800) there are 120 species, in dry montane forest (1500–2400 m) there are 57 species and in upper montane forest (1800– 2400 m) there are 42 species (forest definitions from Lovett 1993).
For the aggregated plot data from the 363 plots the lowest number of species found in a plot was two, and the highest was 16. The mean number of species/ plot is 9.2±2.4, the mode 10 and the median 9. The species richness data is normally distributed with a kurtosis of−0.21 (Kolmogorov–Smirnov normality test D=0.026, P > 0.15). The distribution is slightly skewed towards lower species numbers (skewness −0.16). There is a slight negative correlation between the number of species in each plot and elevation (Figure 1, r2=0.011,
J . C . L O V E T T
692
If the five plots from the driest and structurally different forest type, the montane Juniperusforest of the West Usambara mountains (mean species per plot=5±1.6, elevation 1840–1880 m, Lovett 1996), are removed from the pool to leave only moist forest plots, then there is no significant correlation between plot species richness and elevation (n=357, r2=
0.005, P=0.17). The mean rises to 9.3±2.4, the mode stays at 10 and the median rises to 10. The kurtosis also falls to −0.19 and the skewness to −0.15. The Juniperus forest plots are significantly less diverse than the other plots (two-tailed t-test P < 0.0001).
Anthropic disturbance for cultivation is associated with low species richness. Three low diversity plots from the Southern Udzungwa mountains at around 750–1025 m elevation in the Kihansi Gorge are dominated byFilicium decipiens
(Wight & Arn.) Thw. (Sapindaceae), a tree that occurs throughout eastern Africa and in Asia. TheFilicium forest is adjacent to species rich forest at the same elevation (Lovett et al. 1997). The Filicium forest plots are significantly less diverse than the other plots (mean species per plot=3±1.5, two-tailed t-test, P < 0.0001). Although the area is now not cultivated, parts of the Filic-ium forest are on places that have been cultivated in living memory. Other parts of theFiliciumdominated forest are not so recently disturbed, with some
Filiciumtrees in the plots up to 95 cm dbh. There are no Eastern Arc endemic tree species in the Filicium plots.
In another Southern Udzungwa forest at Mufindi, three plots in montane forest (1860–1870 m elevation) growing over old cultivation as evidenced by the remains of an undulating ridge and furrow system (Greenway 1973), also have significantly fewer species than other Eastern Arc plots (mean number of species in Mufindi plots=5.3±0.56, two-tailed t-test, P=0.005). The age of forest regeneration on cultivation at Mufindi has not been dated, but is beyond local memory. A marked qualitative difference between the Mufindi forests and other Eastern Arc montane forests can be demonstrated by pooling the three Mufindi plots to create a 60 tree sample and comparing them with three pooled plots from similar elevations elsewhere in the Eastern Arc. Data for the West Usambara, Southern Nguru and Northern Udzungwa were obtained by taking a random sample of three montane forest plots obtained from the same forest location on each mountain at as near an elevation as possible to the Mufindi plots. Plot elevations (m asl) are: West Usambara 1890, 1850, 1850; Southern Nguru 1480, 1500, 1560; Northern Udzungwa 1650, 1670, 1670; and Southern Udzungwa 1860, 1860, 1870. There are no Eastern Arc endemic tree species in the Mufindi plots compared to 20–30% of species from three other areas being Eastern Arc endemics (Table 2). With the Juniperus,
Filicium and Mufindi plots excluded from the data pool the mean number of species per plot rises to 9.4±2.3 (n=352, mode=10, median=10, kurtosis= −0.28, skewness= −0.07) and there is no correlation between plot species rich-ness and elevation (r2=0.005, P=0.18).
Table 2. Comparison of numbers of species and endemism in samples of 60 trees from four montane forests in the Eastern Arc mountains of Tanzania. The 60-tree sample was obtained by combining three 20-tree plots.
Species Endemics
West Usambara 26 5
Southern Nguru 21 4
Northern Udzungwa 20 6
Southern Udzungwa 9 0
species richness in the Eastern Arc forests of Tanzania, measured as number of species in a sample of 20 treesM20 cm dbh, does not decline with elevation. Neither does the number of species per plot appear to be related to the richness of the potential pool of species at different elevations. As elevation is closely correlated with temperature, it can be assumed that plot species richness is independent of temperature. The driest forest type is less diverse than most of the other moist forests. This may be a function of precipitation or another factor, such as fire, which is associated with forests growing in low, seasonal rainfall. Forest regenerating on formerly cultivated ground has a comparatively low diversity and no endemic species.
A C K N O W L E D G E M E N T S
I gratefully acknowledge permission from the Tanzania Commission for Science and Technology to conduct research in Tanzania, to Dr Alan Hamilton for use of data from the East Usambara mountains, and to Dr John B. Hall for use of data from Mazumbai in the West Usambara mountains. Comments on an earlier draft of the paper were provided by Luis Daniel Llambi Cartaya and two reviewers.
L I T E R A T U R E C I T E D
GREENWAY, P. J. 1973. A classification of the vegetation of East Africa.Kirkia9:1–68.
GUO, Q., RICKLEFS, R. E. & CODY, M. L. 1998. Vascular plant diversity in eastern Asia and North America: historical and ecological explanations. Botanical Journal of the Linnean Society128:123–136. HALL, JOHN B. 1991. Multiple-nearest-tree sampling in an ecological survey of Afromontane catchment
forest. Forest Ecology and Management42:245–266.
HAMILTON, A. C. 1989. African forests. Pp. 155–182 in Lieth, H. & Werger, M. J. A. (eds). Ecosystems of the world 14B. Tropical rain forest ecosystems, biogeographical and ecological studies. Elsevier, Amsterdam. HAMILTON, A. C., RUFFO, C. K., MWASHA, I. V., MMARI, C. & LOVETT, J. C. 1989. A survey of
forest types on the East Usambara using the variable-area tree plot method. Pp. 213–225 in Hamilton, A. C. & Bensted-Smith, R. (eds). Forest conservation in the East Usambara Mountains, Tanzania. IUCN, Gland.
LATHAM, R. E. & RICKLEFS, R. E. 1993a. Global patterns of tree species richness in moist forests: energy-diversity theory does not account for variation in species richness. Oikos67:325–333. LATHAM, R. E. & RICKLEFS, R. E. 1993b. Continental comparisons of temperate-zone tree species
diversity. Pp. 294–314 in Ricklefs, R. E. & Schulter, D. (eds). Species diversity in ecological communities: historical and geographical perspectives. University of Chicago Press, Chicago.
LOVETT, J. C. 1990. Classification and status of the Tanzanian forests.Mitteilungen aus dem Institut fu¨r Allgemeine Botanik in Hamburg 23a:287–300.
J . C . L O V E T T
694
LOVETT, J. C. 1996. Elevational and latitudinal changes in tree associations and diversity in the Eastern Arc mountains of Tanzania.Journal of Tropical Ecology 12:629–650.
LOVETT, J. C. 1998. Continuous change in Tanzanian moist forest tree communities with elevation. Journal of Tropical Ecology 14:719–722.
LOVETT, J. C. & FRIIS, I. 1996. Some patterns of endemism in the tropical north east and eastern African woody flora. Pp. 582–601 in van der Maesen, L. J. G., van der Burgt, X. M. & van Medenbach de Rooy, J. M. (eds). The biodiversity of African plants. Proceedings XIVth AETFAT Congress 22–27 August 1994, Wageningen, The Netherlands. Kluwer Academic Publishers, Dordrecht.
LOVETT, J. C., HATTON, J., MWASUMBI, L. B. & GERSTLE, J. H. 1997. Assessment of the impact of the lower Kihansi hydropower project on the forests of Kihansi Gorge, Tanzania. Biodiversity and Conservation6:915–933.
LOVETT, J. C. & NORTON, G. W. 1989. Afromontane rain forest on Malundwe Hill, Mikumi National Park.Biological Conservation 48:13–19.
MITTERMEIER, R. A., MYERS, N., THOMSEN, J. B., FONSECA, G. A. B. & OLIVIERI, S. 1998. Biodiversity hotspots and major tropical wilderness areas: approaches to setting conservation priorities. Conservation Biology 12:516–520.
MYERS, N. 1990. The biodiversity challenge: expanded hot-spots analysis. The Environmentalist 10:243– 256.
RAHBEK, C. 1997. The relationship among area, elevation, and regional species richness in neotropical birds. American Naturalist 149:875–902.
STEVENS, G. C. 1989. The latitudinal gradient in geographical range: how so many species coexist in the tropics.American Naturalist133:240–256.
STEVENS, G. C. 1992. The elevational gradient in altitudinal range: an extension of Rapoport’s latitudinal rule to altitude.American Naturalist140:893–911.