Simulation and Model Validation of Batch PHB Production
Process Using
Ralstonia eutropha
Shahhosseini, Shahrokh*+ and Sadeghi, Mohammad Taghi
Department ofChemical Engineering,Iran University of Science and Technology, P.o. Box 16765-163 Tehran, I.R. IRAN
Khosravi-Darani, Kianoush
Department of Biotechnology, School of Engineering, Tarbiat Modares University, Tehran, I.R. IRAN
ABSTRACT: Mathematical modeling and simulation of microbial Polyhydroxybutyrate (PHB) production process is beneficial for optimization, design, and control purposes. In this study a batch model developed by Mulchandani et al., [1] was used to simulate the process in MATLAB environment. It was revealed that the kinetic model parameters were estimated off the optimal or at a local optimal point. Therefore, an optimization program was written using MATLAB codes to estimate those parameters again. It resulted in a significant improvement in the accuracy of Mulchandani’s kinetic model. The batch model was evaluated using two batch experiments performed in this work and also Mulchandani’s batch data when kinetic model parameter values estimated in this work were used. Visual comparisons between the model profiles and experimental data indicate that the model represents the process reasonably. A goodness of fit criterion used in this work and some similar researches proved higher accuracy of Mulchandani’s model using this work’s kinetic parameter values compared to other models. Theoretical model verification was also performed that lead to identification of the possible limitations of the model.
KEY WORDS: Poly (ß-hydroxybutyrate) (PHB), Ralstonia eutropha, Batch culture, Modeling
INTRODUCTION
Poly (ß-hydroxybutyrate) (PHB) is an intracellular storage compound that provides a reserve of carbon and energy in several microorganisms [2]. Both prokaryotes and eukaryotes produce it although its accumulation occurs only in some prokaryotes. It accumulates as distinct inclusions in the cell and comprises up to 80% of cell dry weight for strains of Ralstonia eutropha, under
conditions of nitrogen or phosphate limitation and excess carbon source [3]. The polymer is the best known and characterized by Lemoigne in 1925 [4].
The use of PHB as biodegradable plastic is desirable because the disposal of non-biodegradable plastics after they are used causes significant ecological problems. That is, the availability of landfills is limited and the
* To whom correspondence should be addressed. + E-mail : [email protected]
incineration of plastics increases greenhouse gases and releases toxic compounds. PHB is a biodegradable, biocompatible thermoplastic and has similar physical properties to polypropylene. It has similar piezoelectric properties to natural bone and is optically active (all of its monomers are the D-isomer). PHB has many potential applications in medicine, veterinary practice and agriculture due to its biodegradability.
Its biocompatibility is the reason of medical applications such as surgical pins and sutures. Finally PHB can be produced from renewable substrates, which perhaps is the most important advantage of PHB compared to petrochemical polymers [5].
Currently the main problem, which limits the widespread use of PHB and its copolymers, is its relatively high cost compared to polypropylene. The fermentation process, substrates and product recovery are major costs [6]. Research has focused on reducing these costs by optimizing fermentation processes of R. eutropha and expressing the operon responsible for PHB production in other organisms such as Escherichia coli [7] and transgenic plants [8].
A mathematical model that represents PHB production fermentation is useful for design, optimization and control of the process. A mathematical model can be best developed when the process is well understood. To develop such a model for bioprocesses, compositional variable of the organisms must be considered and that model is called a structured model. In the absence of such understanding, the development of mathematical models can still be useful for designing experiments to screen certain mechanisms. For practical engineering applications, the development of unstructured models, which look at the organisms as a black box, has become widely accepted. In this work several batch culture model for PHB production were investigated and the model of Mulchandani [1] was modified. Several batch culture experiments of PHB production using Ralstonia eutropha in a defined medium were also conducted. The modified model was then evaluated against experimental data. The model sensitivity to parameter changes was also studied.
EXPERIMENTAL
The bacterium, Ralstonia eutropha was selected for this study due to its potentially high cell PHB content and simple nutritional and cultural requirement [9]. The
chemical for media and preparation and sample analysis were analytical grad, or of the highest quality available. Stock culture of the microbe was maintained on PYEA (peptone yeast extract agar).
The chemicals for media preparation and sample analysis were analytical grade, or of the highest quality available. An analytical grade PHB standard, purchased from the chemical company SIGMA, was used in the GC analysis of PHB in standard samples. The trace metal solution included in the experimental medium was made using "Hortico trace element fertiliser" (composition: 22% K, 2% Mg, 1% Fe, 1% Mn, 0.8% Cu, 0.8% Zn, and 0.1% Mo as sulphates, 0.2% B as borax, and 13% S as sulphates). Ralstonia eutropha was maintained on PYEA (peptone yeast extract agar). The medium was adjusted to pH 7.0, autoclaved and poured into sterile Petri dishes. Once the agar was set and cooled, the agar plates could be streaked or kept in the refrigerator to be used later. Streaked plates were incubated at 30C for 2 to 3 days, and were stored at 4C until required. The cultures were subcultured every 3 weeks to ensure the availability of sufficient stock culture.
Cultures were grown in a 2 L Setric Genie Industrial fermenter. The agitation rate in the fermenter was 500 rpm. The pH level was controlled to stay in a range of 6.9-7.3. Temperature was at 30C throughout all experiments. The medium for batch culture experiments designed by Bradford [10] was modified to provide a source of carbon, nitrogen and trace metals in a phosphate buffer. The strain of R. eutropha used in this work, like other freshly isolated strains of R. eutropha cannot utilize any sugar except fructose [10].
To prepare a seed culture, either a PYEA plate was inoculated over the entire plate surface to achieve the maximum amount of growth or three plates were streaked (16-streak dilution) to achieve the same amount of the cells. The inoculated plates were incubated at 30C for 48 hours. The resultant culture was transferred to a 500-ml flask containing 150 ml of the seed medium. The flask was incubated for 24 hours at 30C and agitated at 200 oscillations per minute in a shaker. This produced a viable inoculum that was at 10% of final fermenter working volume (1.5 L).
RESULTS AND DISCUSSION Kinetic model
Experiments performed by Mulchandani et al. [1] showed the specific growth rate of R. eutropha ATCC 17697 depends upon the ratio of ammonium sulfate (nitrogen source) and fructose (carbon source) concentration used for production of PHB. Thus a mathematical expression (equation 1) was proposed to fit the substrate inhibition kinetics [1]:
n
sr m
i [1 Sr/Sm]
K Sr
Sr μ
μ
(1)
Where i is the specific growth rate (h-1), m is the
maximum specific growth rate (h-1), k
S is saturation
constant dimensionless), n is a exponent with no physical significance (dimensionless), Sr is the ratio of (NH4)2SO4
to fructose concentration (dimensionless), Sm is the ratio of
(NH4)2SO4 to fructose concentration at which specific
growth rate is zero (dimensionless).
The values of the model parameters, m, Ksr, Sm and n
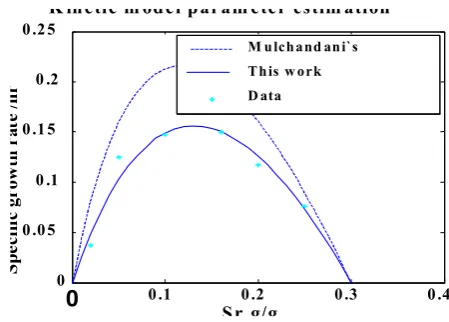
were determined by fitting the substrate inhibition data to Equation (1) using a non-linear regression technique (Mulchandani et al., 1989). These values respectively are 0.72 h-1, 0.15, 0.3 1.22. Figure 1 indicates the data used to
estimate those parameters and the profile produced by the kinetic model applying the same parameters. This figure shows the curve produced by equation (1), using the parameter values as quoted in his paper, does not really fit to the data. Therefore, in this study the data were used to fit another curve and estimate new values for kinetic model parameters. These values are shown in Table 1. A comparison between the sums of residual squares (σ2) in
Table 1 indicates that parameter estimation in this work is more accurate. Since the solid line profile of Figure 1 is closer to the experimental data compared to the dashed line curve, it also visually confirms the results of Table 1.
Batch culture model
The kinetic model (Equation 1) was incorporated into a mathematical model that describes growth, substrate utilization, and production rates in batch culture. The model is developed based on the experimental data of the batch fermentation to represent PHB biosynthesis employing R. eutropha. The kinetic model used in this mathematical model considers substrate inhibitory effect on the growth of R. eutropha. Equations (2) to (5) show the mathematical model proposed by Mulchandani [1] for batch culture.
Fig. 1: Comparison between the growth equation profiles using two different sets of parameter values.
Table 1: Growth kinetic equation parameter estimation.
Parameters Mulchandani`s parameter estimation
Parameter estimation in this work
μm (h-1) 0.72 0.78
Ksr 0.15 0.29
Sm 0.3 0.3
n 1.22 1.24
σ2 0.007 0.001
Equation (2) is the rate of biomass accumulation.
Xr Sr/Sm] [1
K Sr
Sr μ dt
dx n
sr m
r
(2)
Where Xr is the residual biomass concentration. Equation (3) is the rate of PHB accumulation and P is the concentration of PHB.
X k + dt dX k = dt dP
r 2 r
1 (3)
Where k1is the yield of product from biomass (gprod/gcell)
and k2 is the specific rate of product formation (gprod/gcell.h).
Equation (4) represents the rate of ammonium sulfate consumption.
dt dX k dt
dS r
3
n
(4)
Where k1 is the reverse of the growth yield from
ammonium sulfate (gsub/gcell) and S2 is concentration of
ammonium sulfate (g/l). Equation (5) shows the rate of fructose utilization,
0
0 .1 0 .2 0 .3 0 .40 0 .0 5
0 .1 0 .1 5
0 .2 0 .2 5
S r g/g
Sp
e
cif
ic
g
r
o
wt
h
r
a
te
/
hr
K in e tic m od e l p ar am e te r es tim ation
M u lch a nd an i`s
T h is w o rk
X k + dt dX k = dt dS
r 5 r 4 f
- (5)
where Sf is concentration of fructose (g / L), k4 is the inverse
of the growth yield from fructose (gsub/gcell) and k5is the
specific rate of fructose consumption (gsub/gcell.h).
Parameter estimation and experimental validation of the batch model
Mulchandani and his co-workers have estimated parameters k1-k5. However, since the strain of R.
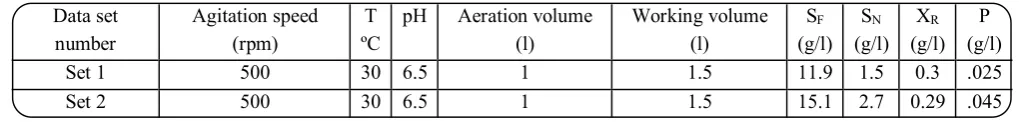
eutropha used in this work (ACM1296) is different from that used by Mulchandani, these parameters had to be determined for this strain. Therefore, several batch experiments were performed using this strain to obtain experimental data needed for parameter estimation. Two sets of batch data besides Mulchandani`s data were selected to estimate parameters k1-k5 and to validate the
batch model. The data in each of these two sets are in fact averaged data of two replicate experiments. Table 2 shows culture conditions and the average initial concentration related to each of two data sets.
Table 3 shows the values of k1-k5 estimated using data
of batch 1 and 2 when kinetic model parameters values estimated in this work were applied in the batch model. Since σ2 obtained for batch 2 is lower the parameter
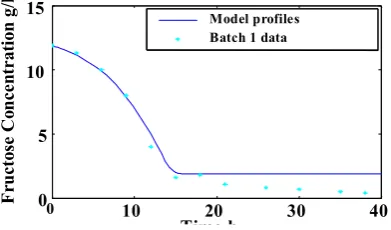
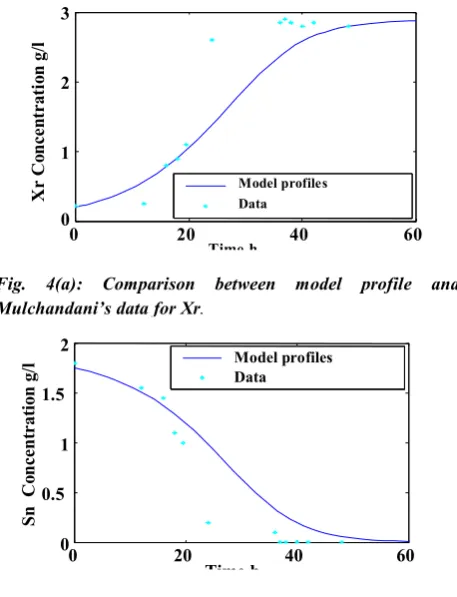
values obtained using batch 2 were inserted into the model equations and than the model was evaluated against batch 1 and Mulchandani`s experimental data. Figures 2(a-d) to 4(a-d) show the model predictions and data of batches 1, 2 and Mulchandani’s data respectively.
The comparison between model profiles and experimental data in these figures indicate the model
represents the process reasonably. A goodness of fit criterion (σ2) is also applied to evaluate the model. It is
defined as the sum of squares of the errors between model predictions and experimental data divided by the degrees of freedom (number of data fitted minus number of parameters estimated).
Yoo and Kim [11] reported σ2 for their model, the
model of Asenjo and Suk [12] and Mulchandani’s model.The reported values were 0.256, 1.431 and 2.2 respectively. The value of σ2 for batch 2 data is 0.24.
Therefore, according to this criterion Mulchandani’s model using kinetic parameters estimated in this work fits the data slightly better than Yoo’s model and much better than others.
Theoretical evaluation of the model
The model described experimental data reasonably. However, its capability to make reasonable predictions under other conditions had yet to be investigated to identify the conditions under which model structure does not allow reasonable predictions. Therefore, the model was employed to simulate the process and produce profiles using various initial concentrations of the substrates, product and residual biomass to verify those profiles. The values were chosen in a manner to provide a wide range of Sr at the beginning of a batch culture. The simulation results indicate that the model fails under some conditions. Sm in equation (1) is a constant with a value of 0.3. Therefore, whenever Sr is equal to 0.3, (Sr/Sm)n becomes equal to 1 and [1-(Sr/Sm)n] lead to
zero. Consequently, whenever Sr equals 0.3 then dXr/dt and dSn/dt are zero. However, in practice dXr/dt is not necessarily equal to zero whenever Sr is 0.3.
Table 2: Culture conditions and average initial concentrations for batch cultures 1 and 2.
Data set number
Agitation speed (rpm)
T ºC
pH Aeration volume (l)
Working volume (l)
SF
(g/l) SN
(g/l) XR
(g/l) P (g/l)
Set 1 500 30 6.5 1 1.5 11.9 1.5 0.3 .025
Set 2 500 30 6.5 1 1.5 15.1 2.7 0.29 .045
Table 3: Parameters k1-k5 estimated for the batch model, using batch 1 and 2 experimental data.
Batch number k1 (gProd/gcell) k2 (gProd/gcell.h) k3 (gAmm/gcell) k4 (gFru/gcell.h) k5 (gFru/gcell.h) σ2
Fig. 2(a): Comparison between model profile and batch 1 experimental data for Xr.
Fig. 2(b): Comparison between model profile and batch 1 experimental data for Sn.
Fig. 2(c): Comparison between model profile and batch 1 data for PHB.
Fig. 2(d): Comparison between model profile and batch 1 data for Fructose.
Fig. 3(a): Comparison between model profile and batch 2 experimental data for Xr.
Fig. 3(b): Comparison between model profile and batch 2 experimental data for Sn.
Fig. 3(c): Comparison between model profile and batch 2 data for PHB.
Fig. 3(d): Comparison between model profile and batch 2 data for Fructose.
0 10 20 30 40
0 1 2 3
T im e h
X r Co ncen tra ti o n g/ l
M odel p rofile s B atch 1 data
0 10 20 30 40
-0.5 0 0.5 1 1.5 Time h Sn Co ncent rat io n g /
l M odel p rofiles
B atch 1 data
0 10 20 30 40
0 1 2 3 4 Time h P H B C on c ent r at io n g/
l Model profiles
Batch 1 data
0 10 20 30 40
0 5 10 15 Time h F ructo se Co ncen tra tio
n g/l Model profiles
Batch 1 data
0 10 20 30 40
0 1 2 3 4 Time h X r Co nce n tr a ti o n g/ l
Model profiles -Batch 2 data *
0 10 20 30 40
0.5 1 1.5 2 2.5 3 Time h Sn Co ncent rat io n g /
l Model profiles
-Batch 2 data *
0 10 20 30 40
0 1 2 3 4 Time h PH B Co ncent rat io n g
/l Model profiles
-Batch 2 data *
0 10 20 30 40
0 5 10 15 20 Time h F ruc to se Co ncen tr a tion g/l
Fig. 4(a): Comparison between model profile and Mulchandani’s data for Xr.
Fig. 4(b): Comparison between model profile and Mulchandani’s data for Sn.
Fig. 4(c): Comparison between model profile and Mulchandani’s data for PHB.
Fig. 4(d): Comparison between model profile and Mulchandani’s data for Fructose.
Equation (4) implies ammonium sulfate is utilized only in the growth phase. However, ammonium sulfate is needed slightly in the absence of the growth as well, for maintenance functions. In equation 1, giving n = 1.22 and Sm = 03 results in Sr>0.3 and in turn dXr/dt<0 which means negative growth. However, experimental results show cells can still grow very slowly when Sr = 0.33.
CONCLUSIONS
The sum of error squares between the kinetic model profile and experimental data were seven times less when parameters estimated in this work were used in the model compared to the case when Mulchandani’s parameters were used (see Table 1). The goodness of fit criterion and visual comparison of the model profiles and experimental data where used to evaluate Mulchandani’s model using the kinetic parameters estimated in this research study. The model predictions agree with the data reasonably. Theoretical evaluation of the model indicate the model is reliable only when 0<Sr<0.3. However, researches performed by Bradford [10] and Mulchandani et al., [1] showed the optimal initial value of Sr fall in the range of 0.12 to 0.17 which satisfies the above requirement.
Received: 30th September 2002 ; Accepted: 6th May 2003
REFERENCES
[1] Mulchandani, A., Substrate inhibition kinetics for growth and production of PHB by Alcaligenes eutrophu, Applied Microbiology and Biotechnology, 30, 11 (1989).
[2] Anderson,A. J. and Dawes, E. A., Physiology and Ultra structure of Leptothrix discophora SS-1., Archives of Microbiology, 145,126 (1990).
[3] Dawes E.A., Senior P.J., The role and regulation of energy reserve polymers in microorganisms. Polyhydroxybutyrate., Advances in Microbial Physio-logy, 10, 203 (1973).
[4] Schlegel, H., Gottschalk,G., and Von Bartha, R., Formation and Utilization of Poly-β-hydroxybutyric Acid by Knallges Bacteria (Hydrogenomonas) Nature, London, 191, 463 (1961).
[5] Howells, E., Opportunities in Biotechnology for the Chemical industry, Chemistry and Industry, 7, 5008 (1982).
0 20 40 60
0 1 2 3
Time h
X
r
Co
ncen
tra
ti
o
n
g/
l
Model profiles Data
0 20 40 60
0 0.5
1 1.5
2
Time h
Sn
Co
ncent
rat
io
n g
/l Model profiles
Data
0 20 40 60
0 1 2 3 4
Time h
PH
B Co
ncent
rat
io
n g
/l M odel profiles
Data
0 20 40 60
25 30 35 40 45
Time h
Fru
c
to
se
Co
nce
n
tra
tion g/l
[6] Byrom, D., Polymer Synthesis by Microorganisems: Technology and Economics, Trends in Biotechnology, 5, 246 (1987).
[7] Brandl,H., Gross, R.A., Lenz, R.W., Fuller, C., Plastics From Bacteria and for Bacteria, Advances in Biochemical Engineering, 41, 77 (1990).
[8] Poirier, et al., Production of Polyhydroxybutyrate in Transgenic plants, Science, 256, 520 (1992).
[9] Leibergesell, M., Hustede, E., Timm, A. and Stein- buchel., A., Fuller, R.C., Lenz, R.W. and Schlegel, H.G., Formation of poly(3-hydroxyalkanoates) by Phototrophic and Chemolithotrophic Bacteria, Archives of Microbiology, 155, 415(1991).
[10] Bradford, D., Growth and Accumulation of Poly-β-hydroxybutyric Acid by Alcaligenes eutrophus, Honours Thesis, Department of Chemical Engineering, University of Queensland (1992). [11] Yoo,S.and Kim,W.S. Cybernetic model for synthesis
of Poly--hydroxybutyric acid in Alcaligenes eutrophus, Biotechnology and Bioengineering, 43, 1043 (1994).