Recovering Data For Optical Head Tracker Using
Auto-Regression
Saket Kumar, Rajesh Mehra
Abstract—In this paper, optical head tracker is used for head tracking of the operator‘s head. Head tracking basically deals with the motion of the operator‘s head. It mainly discovers the exact position and orientation of the operator‘s head. Position suggests the linear motion and translational distance of the head along x, y & z-axes respectively. In other hand orientation gives the non-linear motion and angular distance of the head i.e. yaw, pitch & roll along x, y & z-axes respectively. So there are six different set of coordinates used for locating the head movements and they are collectively called as degree-of-freedom (DOF). It performs pivotal part in the working of head mounted applications. TrackIRTM 5 optical head tracker was employed to collect the information of the operator‘s head behavior in terms of 6-DOF data during real time head motion. Throughout the course of acquisition process 6-DOFs data were collected by using the optical tracker. But as a result of various occlusions present in the environment in the form of stray light interference, noise and sensor malfunctioning, the data for various instances may get missed and its accuracy is affected. So in order to remove the error the missing data is need to be recovered. To recover the missing data instances Auto-regression (AR) process was applied. The recovered data was analyzed by using Mean Absolute Percentage Error (MAPE) in case of 30% of the missing instances for 2nd, 3rd and 4th order AR process. It was found that the error of the recovered data decreases as the order of the AR process increases.
Index Terms—Head Tracking, Auto Regression, Prediction, Optical Tracker, Recovery
—————————— ——————————
1 I
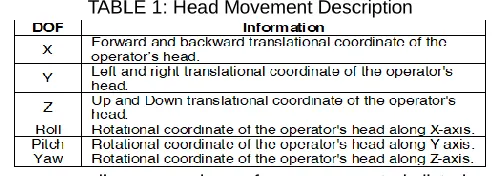
NTRODUCTION One of the main motives behind tracking is to transact human and computer system directly for communication purpose [1, 2]. Tracking is the process of sensing the operator‘s head movements and communicating its location to the system. It is implemented by using trackers and cameras together in real time [3, 4]. During the tracking process a stream of images and videos are detected by the tracker to collect the information related to the head motion and to roughly approximate the direction, position and orientation of the operator‘s head [5]. Usually head tracking system depends on the limitation and the confinement of an infrared (IR) pattern mounted on the operator‘s head. The IR pattern can be easily sensed by the tracking system as it lies outside visible range and not visible to the operator [6, 7]. The information gathered regarding the head behavior is categorized into two different types of head motion i.e. linear and non-linear. Linear motion involves the position of the head and its translational distance along x, y and z-axes. While non-linear motion implies the orientation of the head and its angular distance i.e. yaw, pitch and roll along x, y and z-axes respectively. Rotation of head around vertical axis, side-to-side axis and front-to-back axis is called yaw (azimuth), pitch (elevation) and roll respectively. So a total of six motions defines the complete head behavior and is known as 6-DOF is shown in Table 1 [8, 9].TABLE 1: Head Movement Description
Our surroundings comprises of many unwanted disturbance
which creates troublesome environment for head tracking. Some of the occlusions which mainly affect the operation of the head tracking system are stray light interference, shadows, weather conditions, background clutter, camouflage and sensor malfunctioning [10]. There are several tracking methods [11] which can be used for tracking and head pose estimation [12, 13] namely optical tracking, magnetic tracking, inertial tracking and acoustic tracking. Optical trackers have reasonably superior performance than other trackers due to their various properties [14]. While recording 6-DOF data using optical tracker trackIRTM 5 in presence of occlusions, the data get corrupted and various instances of the operator‘s head motion get missed. This distorted data introduced error in the collected data sets and exact coordinates of the location of the operator‘s head is not acquired. So to improve the accuracy of the data, the missed instances should be recovered. In this paper the concept of auto-regression process is used to recover or predict the missed data [15].
2
M
ETHODS ANDM
ATERIALSOptical head tracking system mainly consist of IR emitters and location detecting device fixed on the operator‘s head [16, 17]. The whole system is set-up to record the position and orientation of the head motion. Sensitive to sunlight and confined Field-of-Regard (FOR) are some of the demerits of this tracking system. The fundamental concept of optical tracking is to locate the operator‘s head position, communicate the real time coordinates to the sensor; the sensor‘s motion should be in correct Line-of-Sight (LOS), then image acquisition is done by the sensor & eventually fetching the ultimate imagery on the display devices assembled on the operator‘s head [14]. Optical trackers have superior resolution, higher accuracy and broader availability. It has minimal lag, lesser weight and portable shape and size. One of the parameter which made optical tracker a standout choice among the users is its ability to operate wirelessly means there is a freedom to work in bigger volume of space.
______________________________
Saket Kumar is a M.E. Scholar at ECE Department, NITTTR Chandigarh, India, e-mail: [email protected]
2898 2.1 Lab Set-up
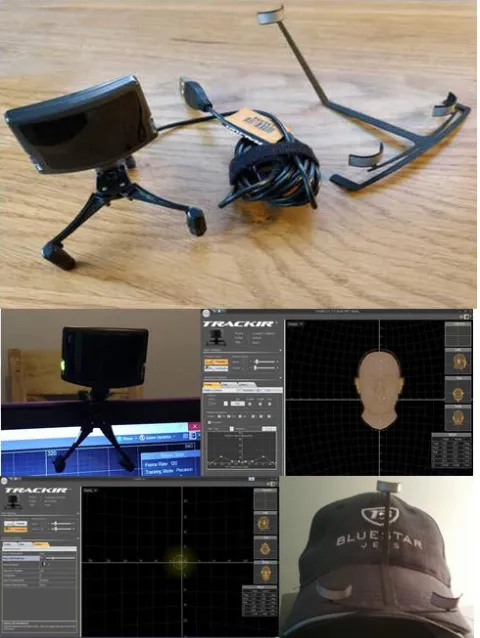
Optical head tracking system was smooth enough to set-up, perform and calculate the entire complex task in real time, required to identify the position and orientation of the operator‘s head. Both software and hardware are equally vital during the demonstration of experiment. TrackIRTM 5, track clip, work station and connecting cables were few hardware equipment used in this test. Software part consists of windows operating system, natural point tracker software and MATLAB programming language. Installation of both hardware and software can be easily done by following the corresponding user manuals. After the installation once the tracker software is allowed to run, the system is ready to record the operator‘s head motion. The complete test set-up for data collection using optical head tracker system is shown in the Figure 1. The 6-DOF data collected by the optical tracker in real time is shown in Table 2 in the form of sample data set. The IR light generated by the optical tracker hit the operator‘s head [18] and gets reflected by the retro-reflector markers assembled in the track clip. The reflected light was further sensed by the camera [19] of the optical tracker and was employed for tracing the position and orientation of the operator‘s head [20]. Sample data sets were recorded randomly from various individuals. It consists of 505different set of instances having 3030 DOF data values. Sample data sets were cross-checked to identify the missing data instances, which is marked as ‗0‘ and predicted by AR process. Due to availability of noise and defective tracker some instances got missed during data acquisition of the operator‘s head motion. This degrades the performance and accuracy of the optical tracker.
Fig. 1. Lab Setup of Optical Head Tracking System along with software interface
The error in the collected data set can be reduced by recovering the missed data instances. Since the work is demonstrated in the lab so noise and interference in the Field-of-View (FOV) of the optical tracker was created intentionally by introducing stray light. The missing data was recovered by employing auto-regression (AR) process. The estimated data was examined and measured with respect to the original data set. MATLAB was used for simulating the AR process.
2.2 Auto-regression Process
Auto-regression process is derived from the concept that the present value of the sequence ‗Yt‘ can be solved as a linear combination of q past values, Yt-1, Yt-2… Yt-q, plus a noise term. This AR process is linear, reversible and Gaussian in nature. This is a time series method consists of previous values of the series used for the prediction of the future or next values of the series by using a linear data sequence. The AR process is comparatively simple to interpret and easy to implement even in case of sizeable data sequence. The auto-regression process of order q, AR (q), is shown in the following equation [21]:
Yt = K + Ψ1Yt-1 + Ψ2Yt-2 + Ψ3Yt-3 +…+ ΨqYt-q + Nt
= K + + Nt (1) Where Ψ is AR coefficient, q is a positive integer representing
length of the series, Yt is regressed on q previous or most recent consecutive terms of the series, K is a constant and Nt is an error term representing random Gaussian noise having zero mean and constant variance. The noise can be neglected for lower order AR process as it is negligible, but in case of higher order its significant value can‘t be neglected.
TABLE 2 Sample Data Set
Yaw Pitch Roll X Y Z
4.3 -7.7 4.1 -3.7 0.7 -2.03
6.6 -11.1 8 -3 0.3 -1.29
8.3 6.7 5.6 -4.4 1.5 -2.19
11.6 8.8 8.4 -4.8 2.5 -3.38
-7.6 -4.3 -5.3 4.3 0.6 -4.26
-12.4 -6.9 -7.8 2.4 0.2 -4.8
12 -6.8 7.6 -3.3 0.6 -5.26
10.1 11.7 4.2 -0.3 1.7 -4.13
-12.7 12.2 -0.6 2.3 1.3 -4.84
-12 -9.2 -9 1.5 0 -3.75
3 S
IMULATION ANDR
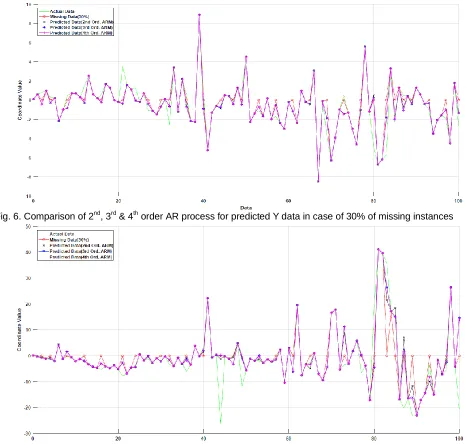
ESULTSThe simulation of AR process is performed in MATLAB. The sequence of data for which the missing instances is to be recovered is primarily imported to the MATLAB. Now the required AR equation of the particular order is constructed using econometric modeller present in the application section of the updated version of MATLAB. Then by running the proper syntaxes and m-codes using the imported data, the related parameters like AR coefficients are generated. Thereafter, other m-codes are used along with the generated AR parameters and data sequence for which the missing data is to be predicted. Likewise for every data set and for every order the missing data is recovered. Once all the required missing data instances are recovered, the waveform is generated using MATLAB for proper comparison and analysis of the result with the actual data values. The percentage of the missing data considered is 30% and 2nd, 3rd and 4th order AR process is used to predict the missing data instances. The complete set of data consists of 6-DOFs i.e. Yaw, Pitch, Roll, X, Y, & Z. So initially Yaw data is recovered for 2nd, 3rd and 4th order AR process. Likewise for all the DOF, missing data instances are predicted using AR process. The waveform generated between head motion coordinates and the number of data instances collected. Waveforms presented in figure 2-7 are showing the comparison of all the three order of AR process discussed earlier. So from the waveform it can be easily noted that as the order of the AR process increases, the accuracy of the predicted value improves. All 6-DOF are shown separately for 30% of missing data instances. Green, red, black, blue and magenta colour indicates original data, missing data instances, predicted data for 2nd order AR process, predicted data for 3rd order AR process and predicted data for 4th order AR process respectively.
By inspecting the waveforms one can discover that the predicted data which is having negligible error is almost imbricating the actual data. Whereas if the predicted data is having excessive variation or deflection as compared to the actual data denoted by different colour in the waveform can be observed easily. The divergence between the recovered data and the original data mainly indicates the error and this error is clearly visible in graphs in the form of shift between the two different coloured lines. This deviation or error can be nullified by implementing higher order auto-regression (AR) process. With each regression variation decreases and error reduced which improves the accuracy of the recovered data. The error in the predicted data for 30% of missing instances by implementing AR process for 2nd, 3rd, & 4th Order is shown in Table 3. MAPE (Mean Absolute Percentage Error is used to compute the error and show the comparative results. It basically estimates size of the error in term of percentage and can be calculated as the average of percentage error by using following equation:
(1 n Σ
|Original data - Predicted data| |Original data| )*100
MAPE is generally used to compute the estimated result of forecasting or prediction. It is used as loss function for model evaluation and regression problems. The result obtained by the MAPE is very sensitive to the volume of the data used. It should be avoided if data is less but in this paper large data volume is used so it has given correct and precise result. Since this work is just a prototype so only up to 4th order auto-regression (AR) process is used. But in real time for practical applications higher order AR process up to 14th & 15th order can be used to reduce the amount of error close to zero.
2900 Fig. 3. Comparison of 2nd, 3rd & 4th order AR process for predicted Pitch data in case of 30% of missing instances
Fig. 4. Comparison of 2nd, 3rd & 4th order AR process for predicted Roll data in case of 30% of missing instances
Fig. 6. Comparison of 2nd, 3rd & 4th order AR process for predicted Y data in case of 30% of missing instances
Fig. 7. Comparison of 2nd, 3rd & 4th order AR process for predicted Z data in case of 30% of missing instances
TABLE 3
MAPE Comparison of Auto-regression Process
4 C
ONCLUSIONOptical head tracking system when used for practical applications in real time then due to the presence of noise and interferences caused the error in the data collected in the form of 6-DOF indicating position and orientation of the operator‘s head motion. The efficiency and the performance of the
To eliminate this distortion in the result the missed data need to be recovered, and auto-regression (AR) process is implemented to predict the missing data. Total of 505 different data set of instances having 3030 DOF data values were collected from random individuals. MATLAB is used for simulation of all sets of data for 30% of missing instances. The data recovered is for 2nd, 3rd & 4th order AR process. For all 6-DOF i.e. Yaw, Pitch, Roll, X, Y, & Z, data was predicted separately. By examining the waveforms it can be easily noted that as the order of the AR process increases, the accuracy of the predicted value improves. Since this work is just a prototype so only up to 4th order auto-regression (AR) process is used. But in real time for practical applications higher order AR process up to 14th & 15th order can be used to reduce the amount of error close to zero. The idea of parallel computing can be applied further to make the system more efficient. Parameters Mean Absolute Percentage Error (%)
Order 2nd 3rd 4th
Yaw 43.39 43.67 44.73
Pitch 1.86 1.82 2.50
Roll 72.55 85.97 87.55
X 6.89 7.12 7.08
Y 0.69 2.25 2.37
2902
R
EFERENCES[1] Jih-fang Wang, Vernon Chi and Henry Fuchs, ―A Real-time Optical 3D Tracker For Head-mounted Display Systems‖, ACM, Vol. 90, no. 03, pp.205-215, 1990 [2] Liu, Y.Storring, M. Moeslund, T. Madsen, C. Granum, E.,
―Computer vision Based Head Tracking from Re-Configurable 2D Markers for AR‖, In Proceedings of the Second IEEE and ACM International Symposium on Mixed and Augmented Reality, Tokyo, Japan, October 8– 10,pp. 264–267, 2003
[3] Alper Yilmaz, Omar Javed, and Mubarak Shah, ―Object tracking: A survey‖, ACM Computing Surveys (CSUR), 38(4):13, 2006
[4] Ya Liu, Haizhou Ai, and Guang-you Xu, ―Moving object detection and tracking based on Background subtraction,‖ International Society for Optics and Photonics, pp. 62-66, 2001
[5] Al-Rahayfeh A & Faezipour M, ―Eye Tracking and Head Movement Detection: A State of Art Survey‖, IEEE J Trans Engg in Hea and Med, vol. 1, 2013
[6] Heuring, J. and Murray D., ―Visual Head Tracking and Slaving for Visual Telepresence‖, In Proceedings of the 1996 IEEE International Conference on Robotics and Automation, Minneapolis, MN, USA,April 22–28, 1996; pp. 2908–2914
[7] Fernando Caballero, Iv´an Maza, Roberto Molina, David Esteban and An´ıbal Ollero, ―A Robust Head Tracking System Based on Monocular Vision and Planar Templates‖ ,sensors,Vol. 9, pp. 8924-8943, 2009
[8] Aman Kataria, Smarajit Ghosh and Vinod Karar, ―Data Prediction of Optical Head Tracking using Self-Healing Neural Model for Head Mounted Display‖, Journal of scientific & industrial research, vol. 77, pp. 288-292, 2018 [9] Aman Kataria, Smarajit Ghosh and Vinod Karar, ―Data
Prediction of Electromagnetic Head Tracking using Self-Healing Neural Model for Head Mounted Display‖, Romanian Journal of Information Science and Technology, 2018
[10]J Cezar Silveira Jacques, Claudio Rosito Jung, and Soraia Raupp Musse, 18th Brazilian Symposium on, ―Background subtraction and shadow detection in greyscale video sequences‖, IEEE, pp. 189–196, 2005 [11]Frank J. Ferrin, ―Survey of helmet tracking technologies‖,
Large-Screen-Projection, Avionic, and Helmet-Mounted Displays, SPIE Vol. 1456, pp. 86-94, 1991
[12]Chen, Q., Wu, H., Fukumoto, T., Yachida, M., ―3D Head Pose Estimation without Feature Tracking‖, Proceedings of the Third International Conference on Automatic Face and Gesture Recognition, pp. 88-93, 1998
[13]M. Karjalainen, M. Tikander, and A. Härmä, ―Head-tracking and subject positioning using binaural headset microphones and common modulation anchor sources‖, in Proc. of IEEE Int. Conf. On Aoust, Speech, and Sig. Proc. (ICASSP‘04), Montreal, Canada, 17-21 May, 2004
[14]Harjot Singh, Vinod Karar, Naresh Kumar and Surender Singh Saini, ―Performance Comparison: Optical and Magnetic Head Tracking‖, International Journal of IT, Engineering and Applied Sciences Research (IJIEASR), Vol. 2, No. 3, pp. 27-322013
[15]Fadi Dornaika, Franck Davoine, ―Facial Expression Recognition using Auto-regressive Models‖, The 18th International Conference on Pattern Recognition (ICPR'06), IEEE, pp. 1-4, 2006
[16]Y. Nishida, T. Hattori, S. Omori, J. Suzuki, K. Katayama, and S. Sakuma, ―Simplification of infrared illumination of stereoscopic liquid crystal TV,‖ in Proc. SPIE, Stereoscope. Displ. Virt. Real Syst. II, vol. 2409, pp. 96– 100, 1995
[17]K. Meyer, H. L. Applewhite and F. A. Biocca, ―A Survey of Position Trackers‖, Presence, Vol. 1, pp. 173-200, 1992
[18] Rafael Muñoz-Salinas , E. Yeguas-Bolivar, A. Saffiotti and
R. Medina-Carnicer, ―Multi-camera head pose
estimation”, Machine Vision and Applications, vol. 23, pp. 479–490, 2012
[19]Yashar Deldjoo and Reza Ebrahimi Atani, ―A low-cost infrared-optical head tracking solution for virtual 3D audio
Environment using the Nintendo Wii-remote‖, Entertainment Computing vol. 12, pp. 9–27, 2016
[20]Czupryński B & Strupczewski A, High accuracy head pose tracking survey, International Conference on Act Med Tech, 11 July 2014.