SEMANTIC INVESTIGATION OF
UNSTRUCTURED DATUM ON EVENT
MINING ANALYSIS
MRS.V.NARAYANI Research Scholar Department of Computer Science
St.Xavier’s College Tirunelveli, Tamilnadu, India.
DR.S.P.VICTOR Associate Professor and Head Department of Computer Science
St.Xavier’s College Tirunelveli, Tamilnadu, India.
MR.S.RAJKUMAR Assistant Professor / CSE
Nehru Institute of Engineering & Techmology Coimbatore, Tamilnadu, India.
Abstract:
The semantics about events is essential in real time decision analysis and support. In earlier stages different approaches have been developed to build models and logical algorithms that relied on the concept of events. Nowadays several modelling techniques are available in processing events with its mining scenarios, but the process of handling unstructured datum in Event mining is a little bit tedious approach. In this paper we will show an outline for handling unstructured datum through the conversion of layered structured datum with its various levels of implications.
Keywords: Event, event mining, classification, cluster, transition, modelling.
I Introduction
a) Structured data
Structured data is used every day. Structured data is data that is organized in a structure so that it is identifiable. The most universal form of structured data is a database like SQL or Access. For example, SQL (Structured Query Language) allows selecting information based on columns and rows in a field. To look for all the rows containing a particular date or ZIP code or name -- this is structured data, and it is organized and searchable by data type within the actual content.
b) Unstructured data
non-textual. Textual unstructured data is generated in media like email messages, PowerPoint presentations, Word documents, collaboration software and instant messages. Non-textual unstructured data is generated in media like JPEG images, MP3audio files and Flash video files. Some current technologies used for content searches on unstructured data require tagging entities such as names or applying keywords and meta tags. Therefore, human intervention is required to help make the unstructured data machine readable.
II Materials and Methods
unstructured structured Observation
datum datum
unstructured structured
datum datum
unstructured structured
datum datum
Fig.1 Proposed Model for handling unstructured datum
System Model 1:
Events implied by changes in observation. Ex. Vehicle moves
Observation => green signal System Model 2:
Future events based on changes in observation. Ex. If signal = red => vehicle will stop
System Model 3:
Future observation based on changes of events
Ex. If more vehicle on one side then signal will be green soon. Event Mining System:
E’ = { O,T, δ, E, e0} O -> set of all observations T -> Time intervals E -> Event states as a set e0 -> Initial event δ -> Transition function δ : OXT -> E
where
O = { O1,O2, …, On} T = { t1, t2, ... , tn}
III Experiment and Results
Consider the real time scenario of a shopping mall which contains 10 floors of which each floor can be allotted for different business purposes. The datum associated with this shopping mall is clearly an unstructured datum; we can convert this into a layered structured datum and then handle it with an optimal option.
e
1e
2e
3Model II System Model III
Model I
Analysis
o
Table 1: Floor details in the shopping mall
Floors Details F10 Hotel, Ice cream Parlour
F9 Cosmetics
F8 Electronics – A/C, Laptops etc F7 Share consultancy F6 Jewellery
F5 Young gents
F4 Young ladies F3 Kids
F2 Old women
F 1 Old men
GFloor Entrance and Car parking
Data Classification and Clustering:
Consider only members present shops as family
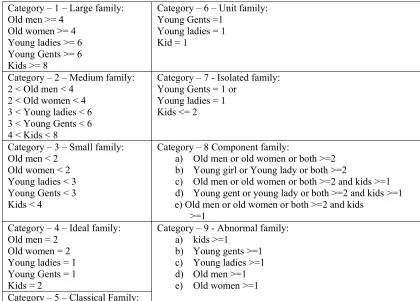
Table 2: Category table
Category – 1 – Large family: Old men >= 4
Old women >= 4 Young ladies >= 6 Young Gents >= 6 Kids >= 8
Category – 6 – Unit family: Young Gents =1
Young ladies = 1 Kid = 1
Category – 2 – Medium family: 2 < Old men < 4
2 < Old women < 4 3 < Young ladies < 6 3 < Young Gents < 6 4 < Kids < 8
Category – 7 - Isolated family: Young Gents = 1 or
Young ladies = 1 Kids <= 2
Category – 3 – Small family: Old men < 2
Old women < 2 Young ladies < 3 Young Gents < 3 Kids < 4
Category – 8 Component family:
a) Old men or old women or both >=2 b) Young girl or Young lady or both >=2
c) Old men or old women or both >=2 and kids >=1 d) Young gent or young lady or both >=2 and kids >=1 e) Old men or old women or both >=2 and kids >=1
Category – 4 – Ideal family: Old men = 2
Old women = 2 Young ladies = 1 Young Gents = 1 Kids = 2
Category – 9 - Abnormal family: a) kids >=1
Young Gents = 1 Young ladies = 1 Kids > 2
These 9 categories are put into several clusters as
Clusters = {Old men, old women, Young lady, Young gent, Kid}
Family comprises the following mixture, so that any family can fall within these sets irrespective of count
Table 3: Clusters table
1)Old man 17) old men, old women, young gent 2)Old woman 18) old men, old women, kids 3)Young lady 19) old men, young lady, young gent 4)Young gent 20) old men, young lady, kids 5)kids 21) old men, young gent, kids
6)old men, old women 22) old women, young lady, young gent 7)old men, young lady 23) old women, young lady, kids 8)old men, young gent 24) old women, young gent, kids 9)old men, kids 25) young lady, young gent, kids
10) old women, young lady 26) old men, old women, young lady, young gent 11) old women, young gent 27) old men, old women, young lady, kids 12) old women, kids 28) old men, old women, young gent, kids 13) young lady, young gent 29)old men, young lady, young gent, kids 14) young lady, kids 30) old women, young lady, young gent, kids 15) young gent, kids 31) old men, old women, young lady, young gent,
kids 16) old men, old women, young lady
1 day -> 15 hours working – > 8am to 11 pm
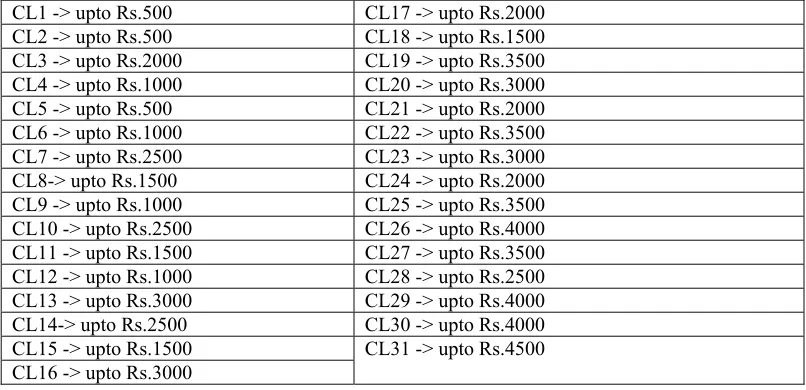
Table 4: Cluster Evaluation table
CL1 -> upto Rs.500 CL17 -> upto Rs.2000 CL2 -> upto Rs.500 CL18 -> upto Rs.1500 CL3 -> upto Rs.2000 CL19 -> upto Rs.3500 CL4 -> upto Rs.1000 CL20 -> upto Rs.3000 CL5 -> upto Rs.500 CL21 -> upto Rs.2000 CL6 -> upto Rs.1000 CL22 -> upto Rs.3500 CL7 -> upto Rs.2500 CL23 -> upto Rs.3000 CL8-> upto Rs.1500 CL24 -> upto Rs.2000 CL9 -> upto Rs.1000 CL25 -> upto Rs.3500 CL10 -> upto Rs.2500 CL26 -> upto Rs.4000 CL11 -> upto Rs.1500 CL27 -> upto Rs.3500 CL12 -> upto Rs.1000 CL28 -> upto Rs.2500 CL13 -> upto Rs.3000 CL29 -> upto Rs.4000 CL14-> upto Rs.2500 CL30 -> upto Rs.4000 CL15 -> upto Rs.1500 CL31 -> upto Rs.4500 CL16 -> upto Rs.3000
Table 5: Pivot table
Event Mining Table: A sample table on a Sunday.
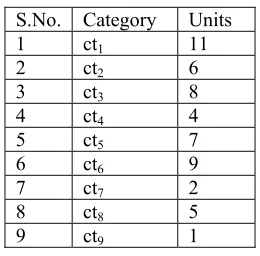
Table 6: Category evaluation table1
S.No. Category Units 1 ct1 11 2 ct2 6 3 ct3 8 4 ct4 4 5 ct5 7 6 ct6 9 7 ct7 2 8 ct8 5 9 ct9 1
Table 7: Category – Cluster relation table1
S.
No. Category Clusters Total (Rs.) Amount
1 ct1 CL31,CL30,CL29,CL28,CL27,CL24,CL23,CL22,CL31,CL30,CL30 39500
2 ct2 CL31,CL30,CL28,CL26,CL20 18000
3 ct3 CL18,CL21,CL22,CL23,CL21,CL22,CL18,CL24 19000
4 ct4 CL16,CL15,CL17,CL16 9500
5 ct5 CL3,CL9,CL6,CL5,CL7,CL8,CL7 11000
6 ct6 CL3,CL8,CL2,CL1,CL6,CL4,CL2,CL9,CL8 9500
7 ct7 CL2,CL9 1500
8 ct8 CL3,CL2,CL1,CL2,CL1 4000
9 ct9 CL1 500
A sample table on a weekday.
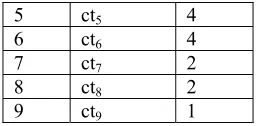
Table 8: Category evaluation table2
S.No. Category Units 1 ct1 8 2 ct2 3 3 ct3 4 4 ct4 2
Category
values Pivotal value
5 ct5 4 6 ct6 4 7 ct7 2 8 ct8 2 9 ct9 1
Table 9: Category – Cluster relation table2
S.No. Category Clusters Total Amount (Rs.)
1 ct1 CL31,CL30,CL29,CL28,CL27,CL24,CL23,CL22 27000
2 ct2 CL31,CL30, CL20 11500
3 ct3 CL18,CL21,CL22,CL23 10000
4 ct4 CL16,CL15 4500
5 ct5 CL3,CL9,CL6,CL5 4500
6 ct6 CL3,CL8,CL2,CL1 4500
7 ct7 CL2,CL9 1500
8 ct8 CL3,CL1 2500
9 ct9 CL1 500
IV Discussions
We analyze the sales for the shopping mall with various versions in a month. We obtain the results as surprising objectives. If we take the normal sales percentage as 100% then the approximate variation for the Government holidays and religious functions are increased by 75%, Sundays, Marriage and Aadi(Seasonal) period with the increase as 20%,50% and 50%. Specific events such as Fathers day, Advertisements and stock clearance consumes the increase as 25%, 50% and 50% respectively whereas abnormal events(Bandh) and month end diminishes the sales as 60% and 40% respectively.
Table 10: Event comparison table
Occasions Increase in % Govt. Holidays / Religious functions + 75%
Sundays + 20%
Marriage / Muhoortham + 50%
Akshaya tritiyi / Mothers day/Fathers day + 25% Aadi(Seasonal) / Discounts + 50% Year end stock clearance + 50% Advertisement new products + 25% Bandh/Strike/Abnormal events - 60% Month End/Yet to get Salary -40%
V Conclusion
This paper deals with the approach for handling unstructured event datum with its layered statistics. The conversion of unstructured event datum to the structured event datum plays the vital role for implementing the scales and measurements for unstructured event sets, moreover it is used to perform the analysis and establish pivotal statistics to skip from fuzziness to the crispy culture. In future we will develop a neuro-fuzzy model for handling unstructured event datum including its deeper level of implications.
VI References
[1] S. Agarwal and D. Roth. Learning a sparse representation for object detection. In Proc. ECCV, pages 113–130, 2002.
[2] Bill Inmon, Matching Unstructured Data and Structured Data, Published in TDAN.com July 2006.
[4] Jain, A., Algorithms for clustering data. Englewood Cliffs, NJ, Prentice Hall, 1991.
[5] Kantardzic M., Data Mining, Wiley-Interscience, 2003.