Lincoln
University
Digital
Thesis
Copyright
Statement
The
digital
copy
of
this
thesis
is
protected
by
the
Copyright
Act
1994
(New
Zealand).
This
thesis
may
be
consulted
by
you,
provided
you
comply
with
the
provisions
of
the
Act
and
the
following
conditions
of
use:
you
will
use
the
copy
only
for
the
purposes
of
research
or
private
study
you
will
recognise
the
author's
right
to
be
identified
as
the
author
of
the
thesis
and
due
acknowledgement
will
be
made
to
the
author
where
appropriate
you
will
obtain
the
author's
permission
before
publishing
any
material
from
the
thesis.
Using Mobile Devices to Access Remote Visualisations
A thesis
submitted in partial fulfilment
of the requirements for the Degree of
Master of Software and Information Technology
at
Lincoln University
by
Zitian Li
Lincoln University
Abstract of a thesis submitted in partial fulfilment of the requirements for the
Degree of Master of Software and Information Technology.
Abstract
Using Mobile Devices to Access Remote Visualisations
by
Zitian Li
Visualisation is widely used in many areas to help people interpret data. People may wish to share the visualisation that they are currently using with others. Mobile devices provide one way to share a visualisation, but they have limitations for visualisation compared to the use of standard desktop in terms of memory, graphics hardware and CPU performance.
In this thesis, a remote visualisation approach is used to overcome some of these limitations. As the Paraview visualisation system can operate in client-server mode, the focus is on investigating a solution that can efficiently transfer visualisations from the Paraview system onto a smart phone. The solution developed is an application that can view and update the rendered image generated from the existing visualisation system. The visualization system does not need to be re-built or installed on the smart phone. End users can easily retrieve the correct visualization without complex user configuration. In order to generate correct visualisation without having to re-build the client for the mobile device, the thesis uses a gateway approach acting as middleware to communicate between the render server (Paraview system) and our generic client (running on smart phone). The gateway handles all of the requests between the user and the server which runs locally to the gateway. The gateway passes the final rendered image to the smart phone via the network for display and interacting.
An end user trial is conducted to evaluate and compare the usability of the smart phone client with the traditional desktop client. The results showed that using gateway as a middleware is a useful approach for a smart phone to manipulate the visualisation with the Paraview system. The
customised visualisation application on the smart phone is simple, without having to store data and without installing Paraview system on the device.
Acknowledgements
It finally comes the time to write my acknowledgement page after countless nights that struggled with the writing. I would like to first express my deep gratitude to my supervisors, Stuart Charters and Keith Unsworth, who gave me constant help and guidance. This thesis would not have been possible without the support and assistance of them.
Secondly, I would like to express my gratitude to other professors and teachers at the Applied Computing Department in Lincoln for the friendly studying environment. Thank the postgraduates in Lincoln University, who helped me with my research for their enthusiastic participation.
I also own my sincere gratitude to my friends who offer me their helps in helping me work out my problems during the difficult time.
Table of Contents
Abstract ... 1
Acknowledgements ... 2
Table of Contents ... 3
List of Tables ... 5
List of Figures ... 6
Chapter 1 Introduction ... 7
1.1 Objectives ... 10
1.2 Structures of thesis ... 10
Chapter 2 Literature Review... 11
2.1 Steps of Visualisation ... 11
2.2 Mobile device trends ... 11
2.3 Collaborative Visualisation ... 13
2.4 Distributed Visualisation ... 15
2.5 Mobile Visualisation in use ... 24
2.6 Summary ... 26
Chapter 3 Analysis and Design ... 28
3.1 Requirements ... 28
3.2 Objectives of thesis ... 30
3.3 Analysis ... 31
3.4 Design ... 32
3.4.1 Direct communication approach ... 32
3.4.2 Gateway approach ... 33
3.4.3 Selected approach ... 33
3.5 System Design ... 34
3.6 System architecture ... 35
3.6.1 Server ... 36
3.6.2 Gateway ... 37
3.6.3 Mobile client ... 39
3.6.4 Communication between server-gateway & gateway-client ... 41
3.6.5 Functions on mobile device ... 43
3.7 User perspective of application flow ... 44
3.8 Summary ... 45
Chapter 4 Implementation ... 46
4.1 System overview ... 46
4.2 System environment ... 46
4.3 Programming language ... 47
4.4 Gateway implementation ... 47
4.4.1 Sever-Gateway implementation ... 48
4.5 Mobile Client Application Implementation ... 51
4.5.1 Mobile client user interface ... 51
4.5.2 Update functions ... 53
4.6 Network connection implementation ... 59
4.7 Summary ... 61
Chapter 5 Evaluation ... 63
5.1 End user trial ... 63
5.1.1 User trial environment ... 64
5.1.2 User trial procedure ... 64
5.2 Results & discussion ... 66
5.2.1 Observation ... 66
5.2.2 Completion Time ... 68
5.2.3 Questionnaire results and discussion ... 72
5.2.4 Interview results and discussion ... 78
5.2.5 Evaluation objectives: results and discussion ... 81
5.3 Summary ... 83
Chapter 6 Conclusion and future work ... 84
6.1 Conclusion ... 84
6.2 Future work and development ... 87
6.3 Summary ... 89
Appendix A User Trial Mobile Task ... 90
A.1 Mobile Task ... 90
Appendix B User Trial Desktop Task ... 91
B.1 Desktop tasks: ... 91
Appendix C User Trial Questionnaire ... 92
C.1 Interview Questionnaire ... 92
Appendix D User Trial Introduction Session ... 97
D.1 Instructions to participants ... 97
D.2 Mobile phone and web browsing familiarization ... 98
D.3 Demonstration ... 98
D.4 Functions on Mobile ... 99
D.5 Desktop Functions ... 102
List of Tables
List of Figures
Figure 1-1 Construction model and mobile phone interaction (Sørensen K, 2009) ... 8
Figure 2- 1 Haber-McNabb Visualisation Pipeline (Haber & McNabb, 1990) ... 11
Figure 2- 2 eResearch Visualisation Scenario (Charters, 2010) ... 13
Figure 2-3 Heer's Time-Space matrix (Heer, 2008) ... 14
Figure 2-4 Client-server approach (Garbow, Yuen, Erlebacher, Bollig, & Kadlec, 2003) ... 16
Figure 2-5 Dataflow in scientific visualisation applications (Luke & Hansen, 2002) ... 17
Figure 2-6Design architecture and result (Lamberti et al., 2003) ... 18
Figure 2-7 RAVE architecture (Grimstead et al., 2005) ... 19
Figure 2-8 Interactions between client and server for the RAVE system (Grimstead et al., 2005) ... 20
Figure 2-9 RAVE service manager (Grimstead et al., 2005) ... 21
Figure 2-10 WEB-IS system architecture (Yuen et al., 2004) ... 22
Figure 2-11 WEB-IS system ... 23
Figure 2-12Architecture overview (Diepstraten et al., 2004) ... 25
Figure 3-1 Classic Client-server Architecture ... 31
Figure 3-2 Direct Communication approach design... 32
Figure 3-3 Gateway design ... 33
Figure 3-4 System architecture ... 35
Figure 3-5 Flow chart of system design ... 36
Figure 3-6 Server flow chart ... 37
Figure 3-7 Gateway flow chart ... 38
Figure 3-8 Mobile Client flow chart ... 40
Figure 3-9 Server- Gateway flow chart ... 41
Figure 3-10 Client - Gateway flow chart ... 42
Figure 3-11 User perspective of application flow ... 44
Figure 4-1 Gateway data workflow ... 47
Figure 4-2Server - Gateway communication ... 48
Figure 4-3 Commands text file format ... 49
Figure 4-4 Connection Panel of Mobile client interface ... 51
Figure 4-5 Invalid input alert for gateway connection ... 52
Figure 4-6 Function Panel of Mobile client interface ... 53
Figure 4-7 Zoom function input ... 54
Figure 4-8 Rotation diagram ... 56
Figure 4-9 Rotation & Zoom visualisation ... 57
Figure 4- 10 “Wireframe” representation ... 58
Figure 4-11 Gateway – Mobile client network connection ... 60
Figure 4-12 Client infinite loop in python ... 61
Figure 5-1 (a) Average Completion Time for mobile tasks ... 69
Figure 5-1 (b) Mobile tasks first vs. mobile tasks second ... 70
Figure 5-1 Mobile tasks comparison figures ... 70
Figure 5-2 Average completion time for different tasks using Desktop ... 71
Figure 5-3 Smart phone usage among participants ... 72
Figure 5-4 Smart phone download file frequency ... 73
Chapter 1
Introduction
Visualisation is widely used in different areas such as medicine, architecture, geography, to help people interpret physical data and objects (Zhou, Qu, Wu, & Chan, 2006). For example, scientists use visualisation to interpret collected raw data such as air flow; engineers use visualisation to view the mechanical parts of engines to solve possible problems; doctors also use visualisation to check the functions of the human body.
Visualisation is defined as transforming data or information into visual pictures (Schroeder, Martin, & Lorensen, 2002). It is the process of exploring, transforming, and manipulating data to gain insight and understanding, which provides a way of seeing the unseen for scientists, physicians, and engineers.
There are different types of visualisation namely: scientific visualisation to help scientists transform data into scientific views; information visualisation to translate collected data to a visual form in order to help with decision-making processes. In terms of different types of displays: 2D visualisation represents a flat display of a scene while 3D visualisation shows a three-dimensional view.
Just as there are different types of visualisation, there are also various types of display device for presenting visualisations in different environments. The most common device is a standard monitor. Others include stereoscopic displays, Cave Automatic Virtual Environments (CAVE) and mobile devices, which are less common and used in particular circumstances due to their capabilities and size. However, since new technologies started to develop rapidly, mobile devices, such as Personal Digital Assistants (PDAs) and smart phones have become much more popular in our everyday life. Mobile devices act as smaller computers.
architects’ experiences, Sørensen, Christiansson & Svidt (2009) have developed a prototype system with Radio-frequency identification (RFID) to support construction processes at different project management levels.
(Figure 10 in web link: http://www.it.civil.aau.dk/it/reports/2009_06_itcon_ksb.pdf)
Figure 1-1 (a) Virtual model and physical components in construction (Sørensen et al., 2009)
(Figure 8 in web link: http://www.it.civil.aau.dk/it/reports/2009_06_itcon_ksb.pdf)
Figure 1-1 (b) Using mobile phone to interact with different resources (Sørensen K, 2009)
Figure 1-1 Construction model and mobile phone interaction (Sørensen K, 2009)
different resources such as mobile phones and virtual models. It shows how different users can exchange their construction project information through different devices. Figure 1-1 (b) shows how people can exchange information efficiently using mobile phones while working on the construction site.
Although Sørensen et al. mainly focus on developing a conceptual prototype system for a construction company, it demonstrates that visualisation on mobile devices is becoming more and more important in current and future technology development.
In general, people use standard monitors (either a desktop or laptop monitor) to view and update visualisations. However, in certain situations, people may wish to share visualisations with co-workers in different geographical locations. For example, scientists may need to look at an updated visualisation while they are out of the office; or architects may need to retrieve and send amended drawings to other team members who are at construction areas; or engineers may wish to view complex mechanical parts while they are working outside the office. The mobility and size of mobile devices, such as smart phones, make them convenient devices to carry out such tasks.
Since a smart phone can actually act as a small computer, in addition to using a mobile device to present a scientific visualisation, people may also wish to interact with the visualisation.
1.1
Objectives
In this thesis, we describe the design and development of a solution to generate and subsequently update a scientific visualisation, using a mobile device, with an existing visualisation system. Such a system must be easy to use and not require users to work with a complex visualisation system.
The overall aim of the research is to provide this mobile device functionality, allowing users to interact and view a visualisation, on the mobile device through simple inputs using a customised visualisation application.
1.2
Structure of Thesis
Chapter 2 discusses related work in the areas of visualisation. It reviews the literature on the use of mobile devices in visualisation together with fundamental concepts of remote visualisation, summarising the limitations of using a mobile device. It compares different approaches when applying remote visualisation to a mobile device. Chapter 2 also suggests guidelines that are appropriate for mobile applications.
Chapter 2
Literature Review
In this chapter, we will introduce the steps in the visualisation process and discuss the increasing role of mobile devices in current and future technology. Then we will describe the use of collaborative visualisation for user interaction. In section 2.3, remote visualisation will be discussed in different real world scenarios. The limitation of using mobile devices in visualisation will be described in section 2.4. Finally, section 2.5 concludes by outlining an approach that is appropriate for mobile applications.
2.1
The Visualisation Process
Haber & McNabb (1990) describe the visualisation process in three major steps: filter, map and render as shown in Figure 2-1.
Figure 2- 1 Haber-McNabb Visualisation Pipeline (Haber & McNabb, 1990)
The pipeline illustrates how data are transformed into an image through those three steps. The quantity of data decreases as it moves from left to right in the pipeline. The filter stage is referred to as data enhancement. This first transformation deals with filtering the raw data and modifying the data for subsequent visualization operations. The second step maps the filtered data to a geometrical representation. Finally the rendering stage generates a visible image from the geometrical representation.
From raw data to finally present a visualisation, there are various techniques and platforms for generating a visualisation. Platforms for displaying visualisation have changed over time in recent decades.
2.2
Mobile device trends
into a simple mobile device. In terms of visualisation, smart phones offer improved 3D rendering capabilities compared to a PDA.
Nowadays, mobile devices are playing an increasingly important role in visualisation. The motivation is that mobile devices and applications have been primarily designed to increase efficiency and productivity for people outside the office (Rodrigues, Barbosa, & Mendonça, 2006). Mobile devices such as PDAs and smart phones are widely used in modern society, and smart phones have seen very rapid technological development.
The performance of mobile devices is constantly improving. In particular, smart phones now have more capabilities than just phoning, including collaborative applications that allow different users to communicate with each other in real time, for instance, people now can easily post comments on the Facebook wall of other users through mobile devices.
Visualisation plays an increasingly important role in modern life. People use visualisation widely to analyse collected data and interpret trends in the real world. In order to satisfy different users’ needs in terms of mobile device applications, necessary changes will need to be made to visualisation systems. Different devices will then be able to adopt these systems (Charters, 2010).
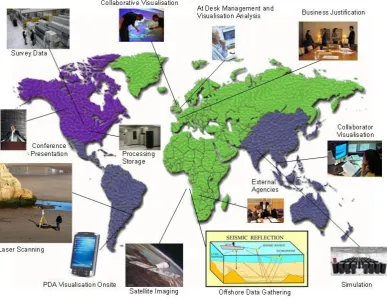
Figure2-2 shows a scenario for a scientist undertaking earthquake research while working at different locations.
Figure 2- 2 eResearch Visualisation Scenario (Charters, 2010)
As visualisation systems and computing technology have developed significantly over the years, current visualisation systems need to be adapted and developed to support different devices in order to meet the needs of researchers in the future. Thinking of the rapid changes on mobile devices, especially smart phones, it is not surprising that there will be new demands of visualisation systems that are required to be supported on these mobile platforms.
2.3
Collaborative Visualisation
Data sets that are large may require more than one person to interpret them. Therefore such scientific research is carried out by teams rather than individuals. Collaborative systems allow multiple users to interact with the visualisation analysis process, for example, research scientists needing to look at a visualisation result, can contribute their ideas and share their interpretations with others in the team even if they are at different physical locations.
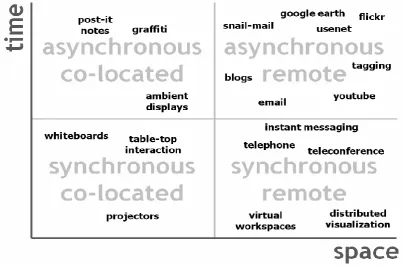
(CSCW). Applegate’s CSCW time-place matrix (1991) outlines how people are involved in different activities based on time and place dimensions. Based on Applegate’s CSCW matrix, Heer (2008) provides an updated time-space matrix for classifying collaborative applications. This is shown in Figure 2-3:
Figure 2-3 Heer's Time-Space matrix (Heer, 2008)
The Time-Space matrix also illustrates several technologies that have been applied for collaboration purposes. The time dimension indicates whether people interact at the same time or not (synchronously or asynchronously). The space dimension describes whether people are in the same (co-located) or different (remote) place. Brodlie, Duce, Gallop, Walton, & Wood (2004) also discuss asynchronous collaboration and synchronous collaboration. Asynchronous collaboration falls into different time dimensions. It refers to collaboration that involves activities such as letters, emails or faxes. Synchronous collaboration falls into the same time dimension. Activities such as video conferencing are classified as synchronous collaboration. In the synchronous remote dimension, distributed visualisation would allow people to share visualisations at the same time in different locations.
windows across networks in which scientific data and models can be discussed at a distance. It is known as “what you see is what I see”. The literature mentions that from the scientific point of view, the term “collaborative visualisation” refers to the development of scientific knowledge which is mediated by scientific visualisation tools in a collaborative context (Pea, 1993).
Other literature also states that one of the significant advantages of collaborative visualisation is that it allows for the pooling of remote computational resources (1999). Collaborative visualisation allows more users to take advantage of more advanced resources to aid the work process between members of the group.
2.4
Remote Visualisation
As mentioned earlier in section 2.1, in order to generate a visualisation, the necessary steps include data filtering, mapping and rendering (Haber & McNabb, 1990). There are many different computer rendering techniques for visualisation. Roberts (1993) states that isosurface and volume rendering are the main techniques for rendering volume data. Watt & Policarpo (1998) discuss many other important rendering techniques that have been developed, such as ray casting and ray tracing.
Depending on the rendering environment and the purpose of the visualisation, there are normally two ways for mapping graphics onto a device’s display: rendering the visualisation using a local application or through remote rendering of the visualisation (Rodrigues et al., 2006). Besides the rendering technique, user interaction is also another aspect that needs to be considered when displaying the visualisation.
Since researchers began to use more advanced and more powerful computers to process larger data sets, remote visualisation has become increasingly important (Luke & Hansen, 2002).There are situations in which scientists may need supercomputers or special graphics hardware to analyse data sets. However, those resources may be located in a different place to the scientist. In this case, remote visualisation is the solution to perform large scale visualisation using only limited resources.
which has limited resources may be an issue. One way to solve this problem is to use a remote visualisation capability. This allows users access resources from a remote system. This section describes some of the approaches to remote visualisation.
The fundamental components of remote visualisation normally include a high-performance graphics engine, such as those found in supercomputers or a desktop computer acting as a server; and another workstation in a remote location, such as other computers or mobile device, as a remote client.
(Figure 3 in web link: http://www.msi.umn.edu/~lilli/web-is.pdf)
Figure 2-4 Client-server approach (Garbow, Yuen, Erlebacher, Bollig, & Kadlec, 2003)
The server and client communicate through a network. As shown in the example in Figure 2-4, this client-server approach uses a workstation as a server to perform some visualisation tasks while other multiple clients may at different locations interact with the visualisation remotely via a network using different display devices (Garbow et al., 2003).
Brodlie et al.(2004) claim that since the early 1990s the client-server approach to visualisation has developed along with the Internet revolution. Client-server interaction varies depending on how much of the computation of the visualisation is done by the client and how much by the server.
(Figure 1 in web link: http://dl.acm.org/citation.cfm?id=602107)
Figure 2-5 Dataflow in scientific visualisation applications (Luke & Hansen, 2002)
Figure 2-5 shows different possible workloads for the server and client components of a visualisation system. Scenario 1 has the server performing most of the processing tasks, including data storage and rendering. The client only needs to display the image. In the second scenario, some of the rendering calculations are done on the server, the client finishes the rendering locally. In the third scenario, the server handles data storage and calculation, while the client performs all the rendering locally. The fourth scenario puts all the calculations and rendering on the client’s shoulders and uses the server for raw data storage only, which is less common for remote visualisation.
Based on different remote visualisation approaches, Zhou et al. (2006) also describe three different modes of remote visualisation over networks:
The simple solution for remote visualisation is a thin-client mode which means a light workload on the client side. This approach uses a high-end graphics server for complex computations, while a low-end graphics client, such as a mobile device, only needs to display the rendered image received from the server.
The fat client mode is the opposite, which means most visualisation processing tasks are performed on the client side rather than the server side.
The balanced mode divides the rendering and calculation processes between the client and server side, which sometimes is promoted as an ideal choice for mobile visualisations when the rendering tasks are not complex.
performances of the mobile devices, we need to apply those three modes of visualisation appropriately according to different situations.
There are many different projects that use a client-server architecture to develop more advanced features. Lamberti, Zunino, Sanna, Fiume, & Maniezzo (2003) develop a framework that enables interactive remote visualisation of OpenGL GLUT-based graphics applications. See Figure 2-6.
(Figure 1 in web link:
http://citeseerx.ist.psu.edu/viewdoc/download?doi=10.1.1.106.1498&rep=rep1&type=pdf)
Figure 2-6 (a) Client-server framework used in PDA
(Figure 5 in web link:
http://citeseerx.ist.psu.edu/viewdoc/download?doi=10.1.1.106.1498&rep=rep1&type=pdf)
Figure 2-6 (b)Remote visualisation in Medical use
Figure 2-6Design architecture and result (Lamberti et al., 2003)
The user would be able to explore the visualisation interactively using a navigation interface. Compared with desktop devices, it emphasises the use of a server-based framework to generate large, complex and realistic 3D visualisations in order to overcome the PDA’s limitations on high-quality 3D displays. This is a successful mobile remote 3D visualisation application but not available for general public use. It has been developed for the user who is familiar with OpenGL and is based on a PDA device.
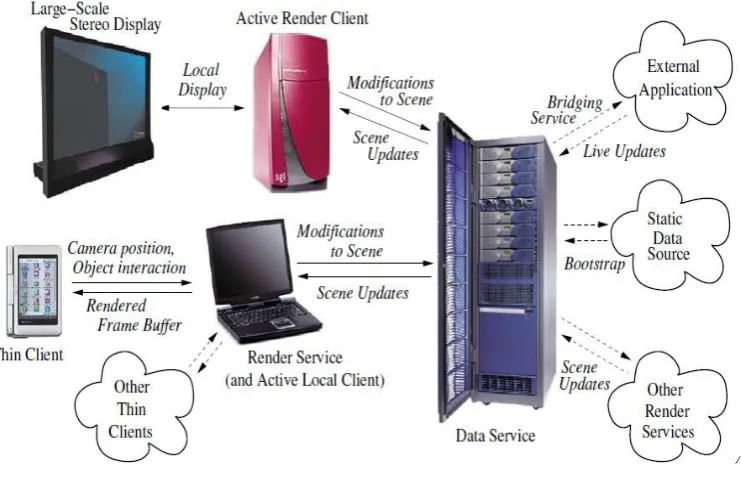
The Resource-Aware Visualisation Environment (RAVE) system is a collaborative application that shares rendering resources between different platforms (Grimstead, Avis, & Walker, 2005). The RAVE architecture includes the following components: data service, render service, active render client and thin client. This is shown in Figure 2-7.
Figure 2-7 RAVE architecture (Grimstead et al., 2005)
In the RAVE project, the PDA has insufficient internal memory to store the dataset and perform the rendering. It uses a render server to perform the rendering, a data server to store the dataset and a PDA to display the visualisation. The PDA user connects to the render server through a network and using a PDA application requests a copy of the rendering results. The render server confirms the connection with the PDA client and then sends a copy of the frame buffer over a TCP/IP socket to the PDA client.
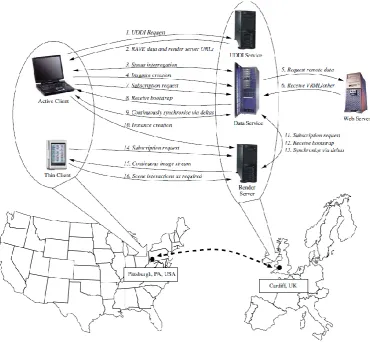
Figure 2-8 Interactions between client and server for the RAVE system (Grimstead et al., 2005)
connection was established, the render server and the client continuously passed data over the network.
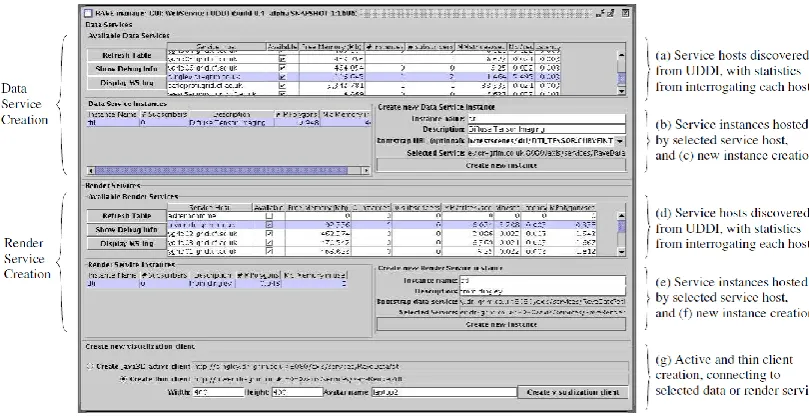
Figure 2-9 RAVE service manager (Grimstead et al., 2005)
Figure 2-9 shows the RAVE manager GUI, which is quite complex for users. Since the system is adopted across different platforms, there are many details that need to be specified in order to retrieve the visualisation output. In Figure 2-9 (g), the RAVE system will automatically generate the required rendered image from a web link on a thin client (PDA). Users can interactively choose different datasets and visualisation resolutions for display through this service manager.
The RAVE system provides the advantage of sharing resources between different platforms, particularly with regard to mobile devices, if the users need to generate visualisation results that require large amounts of computation.
generate visualisations of large datasets for data analysis purpose. The components of the advanced WEB-IS system is schematically showing as Figure 2-10:
(Figure 2 in web link: http://link.springer.com/article/10.1007%2Fs10069-003-0012-z?LI=true#)
Figure 2-10 WEB-IS system architecture (Yuen et al., 2004)
The WEB-IS system allows collaborative visualisation. Clients can remotely retrieve rendered images using middleware called the web gateway. The web gateway offers different access points to collaborative clients. The WEB-IS system stores data and renders images off-screen on the server side, which enables multiple clients to render different data simultaneously. The server and clients use a web browser to exchange requests and update the images.
(Figure 1 in web link: http://link.springer.com/article/10.1007%2Fs10069-003-0012-z?LI=true#)
Figure 2-11 (a) Web-based view via Java applets (Yuen et al., 2004)
(Figure 5 in web link:
http://link.springer.com/article/10.1007%2Fs10069-003-0012-z?LI=true#)
Figure 2-11 (b) WEB-IS system function setup (Yuen et al., 2004)
Figure 2-11 WEB-IS system
makes requests to the server using a web browser and a Java applet as the front interface. The web gateway uses a CORBA bus to transmit commands and the image buffer to the server. The server will then pass the generated image back to the client for viewing via the web browser.
2.5
Mobile Visualisation in use
In comparison with mobile devices in the last decade, there have been significant changes in the use of mobile devices, especially mobile phones. However, besides the advantages of the mobility of mobile devices, there may be limitations in using mobile devices for visualisation compared to the use of standard computers, such as:
Clarity of visualisation: small window size, lower resolution (Chittaro, 2006)
Rendering speed: limited memory, graphics hardware (Chittaro, 2006); limited wireless network bandwidth (Park, Kim, & Ihm, 2008)
Slower systems, restricted user interface, and lower processing performance (2006).
Table 2-1 outlines some hardware differences between a smart phone and a computer:
Table 2-1 HTC phone & Computer Hardware comparison
HTC Touch Pro2
smart phone General Computer
Core Single Dual Core
Processor 528 MHz 2.2 Ghz
RAM 288MB 2GB
External Storage Up to 32GB Up to 2TB Screen (pixels) 480 X 800 (3.6’’) 1400 X 900 (20’’)
Graphic Performance
Dedicated graphics chip (64MB RAM reserved for graphics)
Choice between Dedicated or Integrated graphics chips
Network
HSDPA/WCDMA – From 9.6Kbps up to 9.2Mbps WiFi – Up to 54Mbps
Wired Network: Normally 100Mbps, can up to Gbps
chips and display hardware; which means that mobile devices will become increasingly powerful compared with current specifications.
Chittaro (2006) also indicates the trend of displaying visualisations on small screen mobile devices. However, despite the significant advantage of the devices’ mobility, Chittaro (2006) outlines the mobile devices’ restrictions such as limited screen size, aspect ratio, hardware, connectivity and input techniques that may affect visualisation effectiveness.
One significant problem of mobile remote rendering is network bandwidth. Diepstraten, Görke, & Ertl (2004) address the issue of having low bandwidth compared to wired networks of desk computers when displaying 3D graphics on mobile devices, such as PDAs. The focus of their approach is to reduce the necessary network traffic when passing the rendered image to the PDA. The overall goal is to have a fair balance between client and server during the remote rendering process. Diepstraten et al. (2004) introduced a method to obtain a rendered image on a mobile device. The idea is to transfer just the 2D edge lines from the 3D image to the client device instead of the entire image.
(Figure 1 in web link:
http://cumbia.visus.uni-stuttgart.de/ger/research/pub/pub2004/cgi04-diepstraten.pdf)
Figure 2-12Architecture overview (Diepstraten et al., 2004)
In relation to the above literature, the bandwidth issue will need to be considered based on the server’s rendering speed. Therefore, in order to overcome some physical limitations of mobile devices, such as limited memory capacity and lower graphics performance, remote rendering is the most common solution adopted in the literature for mobile devices (Nadalutti, Chittaro, & Buttussi, 2006).
According to Luke & Hansen (2002), as mobile devices have limited rendering resources, the scenario 1 dataflow in Figure 2-5 is most appropriate for mobile devices using a remote rendering approach, i.e., thin client mode using the mobile device as a display client and perform data processing and visualisation rendering on a different server.
2.6
Summary
Visualisation is the process of taking raw data and then filtering, mapping and rendering it. As raw data become larger, how to effectively use available resources to generate visualisations become more complex. Collaborative visualisation enables different users to contribute and share their own understanding and views more quickly and easily to all members that are involved in an investigation or research process. In particular, the synchronous remote configuration that allows people to exchange information at the same time in different locations is the focus of this project. This technique takes advantage of sharing more advanced resources to aid in the work process between members of the group.
Mobile devices such as PDAs and smart phones have become popular to use as a small computer. Increasingly users may want to view their visualisations on a mobile device. As mobile devices have limitations in processing power and graphic hardware, the client-server architecture approach to remote visualisation is an approach that may overcome some of the issues faced when dealing with the limited capabilities of mobile devices. Network bandwidth may be an issue if there is a slow rendering speed in a remote visualisation system.
web-based applets to allow users to interact with the visualisation and choose appropriate datasets for updating visualisations.
The WEB-IS system and the RAVE system both produce visualisations via their own integrated programs and use a web server as middleware to allow the client to interactively communicate with the server. Both systems use a wide range of program tools to build the server, the middleware web server and the client; the systems program their own servers to analyse datasets in order to satisfy their particular needs, such as for geographic purposes in the WEB-IS system. The RAVE system has been developed for a particular PDA and requires visualisations to be created entirely using the RAVE system. On the other hand, both the client interfaces of those systems are complex for a general user to conduct remote rendering. The visualisation output is displayed through a web browser which may need to be reformatted for the user to view on a small mobile device such as a smart phone.
Chapter 3
Analysis and Design
Chapter 1 describes the increasing use of mobile devices in current and future technology development and the limitations in using mobile devices for visualisation compared with desktop computers for example. Chapter 2 outlines some examples of using a client-server approach to overcome the limitations in mobile device (PDA) visualisation. In this chapter, we present an analysis of the requirements of this project and investigate a remote rendering solution to solve the problems raised in Chapter 1 and Chapter 2.
3.1
Requirements
An essential factor of the system is that the visualisation application should be able to help users view and update visualisations using a mobile device. The system should operate without having to store raw data or install a full visualisation system on the device. The application should be designed to provide the mobile device with functionality which is easy to use. The expectation therefore is that a visualisation will be delivered via a network to the mobile device.
We have determined the following requirements for the application:
1. Runs on a smart phone
2. Connects to a remote server
3. Interconnects with an existing visualisation system
4. Allows users to interact with the visualisation
1. Runs on a smart phone
In Chapter 2, we have included some examples of successfully using PDAs to display visualisations based on their visualisation system, such as the RAVE system.
functions and capabilities. In this research, as the visualisation application is aimed to help users view and update visualisations displayed on a mobile device, and since other projects have used a PDA as an example, and smart phones nowadays are capable of using different programming language to develop suitable applications, we use a smart phone as a mobile display device to run the visualisation application.
2. Connects to a remote server
As mentioned in Chapter 2, a remote rendering approach can overcome the shortcomings of smart phones.
After a visualisation has been generated, the solution should allow the smart phone to render the visualisation remotely by implementing a client-server architecture, i.e., the smart phone connects with a server remotely.
3. Interconnects with existing visualisation system
The main emphasis of the thesis is on developing a solution so that a smart phone can be used to view and update visualisations in remote locations. We are not concerned with developing a new visualisation system.
In addition, if the smart phone application is developed using an existing visualisation system, it is possible that the solution may work with other visualisation software. Therefore, it is necessary that the smart phone application interconnects with an existing visualisation system.
4. Allows users to interact with the visualisation
3.2
Objectives of Thesis
The overall objective of this thesis is to describe the development of a prototype that uses a smart phone to view and update a rendered image by interacting with an existing visualisation system. The design and development of the prototype includes several key objectives as follows:
1. Develop a solution that allows users to create a connection from the mobile device to the
visualisation system in an easy way
Network configuration and interaction between server and mobile client can be complex and require knowledge of the rendering server and the network connection to the client. In order to reduce the complexity of communication between server and client, the solution should simplify this procedure as much as possible so that users can connect the smart phone with the remote server in a straightforward manner.
2. Develop a solution that allows users to interact with the visualisation system and update
visualisations from a smart phone
One of the main objectives is to send the updated visualisation from the visualisation system server to the mobile client, such as a smart phone, based on the remote visualisation framework.
The solution should not only be able to send a single static image that represents the visualisation, but also be able to allow users to manipulate the received visualisation and update it by interacting with the visualisation system.
3. Develop a user friendly interface that can provide data validation and pass useful error
messages back to the user
4. Develop a prototype that allows the solution to be deployed, using a similar visualisation
system
The concept that will be developed should be applicable to similar existing visualisation systems. In principle, the communication protocol between client and server should be able to be used for more general use.
3.3
Analysis
As described in Chapter 1 and Chapter 2, remote visualisation offers a solution for overcoming some of the limitations of mobile devices. By using a client – server architecture, users can retrieve a visualisation for display on a mobile device using a higher-end workstation to process and calculate the complex data sets, without needing to use the mobile device’s limited resources to perform the visualisation.
Depending on the hardware and the purposes of the mobile client, the client – server architecture will differ depending on whether rendering occurs locally or remotely. The principle of the proposed client-server architecture of the existing visualisation system can be illustrated as follows.
Figure 3-1 Classic Client-server Architecture
between the two. Figure 3-1 shows that the computer acts as a server to perform data storage, filtering and mapping. Depending on the size of the dataset, data rendering may occur locally on the client or remotely on the server. Display of the visualisation happens on the client.
3.4
Design
We consider two approaches to the client – server architecture:
Direct communication approach
Gateway approach
These are discussed in more detail below.
3.4.1
Direct communication approach
The concept of direct communication is to render the visualisation on a smart phone directly through the server. Basically, both the server and the client will have to install visualisation application software in order to retrieve the visualisation using the smart phone as the application’s remote client. In this approach, we process the rendering window on the smart phone. The server will stream the data directly to the mobile client. This approach is illustrated in Figure 3-2:
Figure 3-2 Direct Communication approach design
rendered on the phone using the visualisation software. Therefore, the library may also require a large amount of memory to run the application locally on the mobile client.
3.4.2
Gateway approach
The gateway approach originally came from the medical mobile collaborative display system of Park et al. (2008). However, instead of using a gateway to communicate with different collaborators, we can use a gateway to act as middleware to communicate between the server and client. In this approach, the smart phone is used for display purposes, after receiving the final rendered image. Also the user can use the smart phone to send update requests to the server via the gateway. This approach is shown in Figure 3-3:
Figure 3-3 Gateway design
We run the application in client-server mode between the server and the gateway. The server completes the configuration for rendering, and streams the geometry data to the gateway. The gateway handles interactions locally, i.e., interacting with the server; receiving update requests from the mobile client and transferring those requests back to the server. We pass the visualisation output from the gateway to the mobile client through the network for subsequent display.
In this approach, the mobile client acts as an end user. It is responsible for displaying the received image and also allows the user to update the received image by interacting with the gateway.
3.4.3
Selected approach
the gateway is developed to control the interaction. In this thesis, the gateway design is selected due to the following advantages:
Gateway controls what data or visualisation is sent to the mobile client
End users on the mobile client side do not need to know what happens between the server and the mobile client itself. The gateway is responsible for setting up the connection with the server and transmits the visualisation result to the mobile client. When the mobile client sends an update request on the client application to the server, the gateway will handle those requests and communicate with the server in order to get the updated image; when the updated image is ready, the gateway will notify the mobile client and send the image through the network.
Do not need to install the visualisation application software on the mobile client.
In comparison with the direct communication approach, the gateway design can save the mobile client’s memory space for running the visualisation application. In the gateway design, the server renders the visualisation; the gateway transfers requests and feedback while the mobile client is only used as a display device.
The mobile client does not have large memory space to store and render the visualisation, and this gateway approach allows the mobile client to access external resources, such as the visualisation system on the server, to render and store the image.
3.5
System Design
Figure 3-4 shows how the visualisation can be transferred between server and mobile client based upon the gateway design.
The system is based on three major components: server, gateway and mobile client.
These components are briefly outlined as follows. Detailed explanations are given in section 3.6.
Server
Figure 3-4 System architecture
Gateway
The gateway and server are installed on the same computer. The gateway is designed to reduce computing work at the mobile client end. All communication between server and mobile client will be recorded and transferred via the gateway.
Mobile client
It runs the visualisation application to connect with the gateway. A visualisation will be displayed via the application on the smart phone. The end user is able to use the smart phone to interact with the visualisation.
3.6
System architecture
Based on the original client-server framework, we have developed our solution which has a gateway between server and client to handle all the communication. The gateway is used to reduce the complexity of the user interface and control what is sent to the client. Figure 3-5 represents the data flow in the three major components:
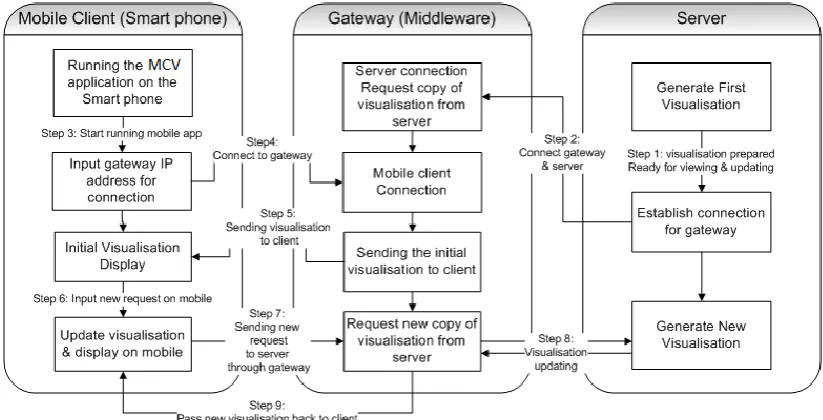
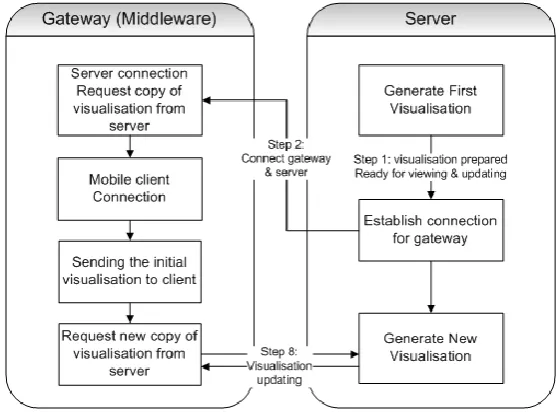
Figure 3-5 Flow chart of system design
It illustrates communication between the server, gateway and client. “MCV” in Figure 3-5 represents the mobile client visualisation (MCV) application that runs on a smart phone. The nine steps of the interaction will be described fully in the following sections.
3.6.1
Server
The server is based on the visualisation system’s built-in server. It is used for:
Data storage, including uploading raw data
Processing data or update requests and generating visualisations
Sending visualisations to the client
Figure 3-6 Server flow chart
Translating the proposed data flow shown in Figure 3-6, firstly, the server will upload data and generate the image locally through the existing visualisation system. In step 2, the server will open the connection, waiting for the gateway to connect with it. After the connection between server and gateway is established, the server will send the generated visualisation to the gateway.
The last process (step 8) is to generate a new visualisation. In this process, the server has already connected with the gateway. If the mobile client sends a request to update the visualisation, the gateway will transfer the request to the server through the connection. The server will then generate a new visualisation from the existing visualisation system and deliver the visualisation to the mobile client via the gateway.
3.6.2
Gateway
The gateway handles interactions between the server and the mobile client locally, such as receiving updated requests from the mobile client and transmitting commands back to the server. The gateway design flow is illustrated in Figure 3-7.
Figure 3-7 Gateway flow chart
1. Server connection
After the server generates the initial visualisation and opens the server for connection to the gateway (step 2), the gateway will need to establish a connection with the server in order to request a copy of the visualisation from the server.
2. Mobile client connection
Besides the connection between the server and the gateway, the gateway will also need to be able to communicate with the mobile client.
In step 4, the gateway will establish a connection between the mobile client and itself in order to handle interactions between the server and the client. The gateway will then use this mobile client connection to transmit visualisations generated by the server to the mobile client in steps 5 and 9; and pass requests from the mobile client back to the server in step 7.
3. Sending visualisations to client
Once the connection from the server to the mobile client through the gateway has been established, the server will transmit visualisations through the gateway to the mobile client.
During this process, the gateway requests a copy of visualisation from the server, and then sends the visualisations to the mobile client for display. See step 5.
4. Request new visualisation from server
The gateway is not only used for transmitting visualisations from server to client, but also can be used for exchanging requests between the two sides.
After the mobile client receives the initial visualisation from the gateway, the user may wish to view the visualisation differently by manipulating the mobile client display. If the end user sends a new command to update the current visualisation (step 7), the gateway will pass those update commands to the server in order to render the new visualisation remotely. The new visualisation is transmitted back to the mobile client via the gateway (steps 8, 9).
Based on the above four major processes, the gateway plays an essential role. It is specifically designed for managing data (including visualisations and update commands) between the server and the mobile client. The gateway takes responsibility for accessing datasets on the server and keeping track of the generated visualisations.
3.6.3
Mobile client
The mobile client is also called the end user client. The end user will use the MCV application to interact with the gateway. The basic logic of the mobile client is shown in Figure 3-8:
Figure 3-8 Mobile Client flow chart
1. Gateway connection
The mobile client is used to display the visualisation without local rendering. Therefore, the mobile client must establish a connection with the gateway in order to receive the rendered visualisation from the server.
The end user runs the MCV application on the smart phone in order to receive the visualisation from the server and to manipulate the visualisation. The MCV application also enables the mobile client to connect with the gateway (see step 4).
2. Visualisation display
3. Visualisation update
If the end user would like to alter the view of the visualisation on the smart phone, the mobile client will use the gateway to pass the update commands to the server (step 7).
The mobile client will not render the visualisation locally. Step 9 shows that the mobile client can update visualisations remotely on the server and transmit them back to the client via the
gateway.
As the main purpose of the thesis is to allow smart phone users to view and interact with visualisations that are generated from a remote visualisation system, the MCV application on the mobile client will have some basic update functions that demonstrate the concept. Those functions are discussed in section 3.6.5.
3.6.4
Communication between server-gateway & gateway-client
The three major components of the design flow are the server, the gateway and the mobile client. Communications between each individual component will be analysed in detail in this section.
1. Communication between server – gateway
The following Figure represents the logical flow between the server and the gateway:
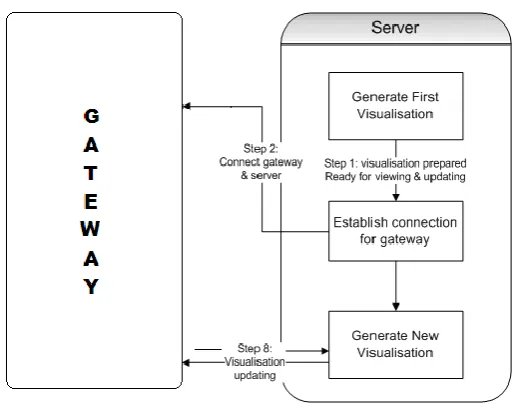
Figure 3-9 illustrates communications between the server and the gateway involving steps 2 and 8 in the whole architecture flow.
Once the two sides (the server and the gateway) connect to each other, the gateway will request a copy of the initial visualisation from the server. This copy of the visualisation will then wait to be delivered to the mobile client.
Step 8 in Figure 3-9 represents the visualisation update process between the server and the gateway. It has two-way communication arrows, which means that during this procedure, the two sides will need to exchange information based on the connection established in step 2. This communication is first built from the gateway to the server as the gateway sends update
commands (received from the mobile client) to the server through the existing connection. After the server receives those commands, it will create a new visualisation and transmit this
visualisation back to the gateway.
2. Communication between client – gateway
The following Figure represents the logic flow between the mobile client and the gateway:
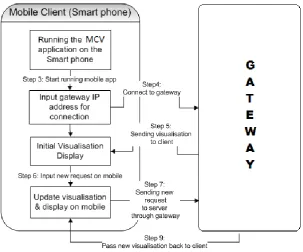
There are four levels of communication between the mobile client and the gateway shown in Figure 3-10.
Step 4 communication is the first: the connection between the mobile client and the gateway side. The mobile client makes a connection with the gateway on the smart phone.
Step 5 shows that after the connection is established, the gateway will send the visualisation to the mobile client for display. If the mobile client updates the visualisation, Figure 3-10 shows the communication of new update visualisation flow between steps 7 and 9. The mobile client first sends the update commands to the gateway. After the new visualisation is created by the server, the gateway will transmit the visualisation to the mobile client.
The server – gateway and client – gateway communications include visualisation transmission and updating commands. These interactions will be discussed in more detail in the implementation chapter.
3.6.5
Functions on mobile device
Functionality must be provided to allow the user to manipulate the visualisation via the MCV. To explore the basic concept of viewing and updating the visualisation on the smart phone, it is planned to have the following functions on the smart phone application:
1. Connection
The “Connection” function is used to set up the network connection between the mobile client and the gateway. For example, the end user could input the IP address of the gateway in order to receive the generated visualisation from the server.
2. Rotation, Zoom, Representation
will be chosen to appear on the mobile application, such as rotation, zooming and changing representation.
When the end user has the visualisation displayed on the smart phone, the rotation function can help the user to rotate the view in different directions. The zoom function will allow the user to alter the size of the viewing object. The representation function is used to switch the viewing object between different representations, such as points or wireframe.
3. Initial View
This function can help users reset the visualisation to the initial view after they make changes to the visualisation on the smart phone. It may be useful if the user wishes to undo some
modifications on the visualisation.
3.7
User perspective of application flow
The remote rendering client – server gateway approach should be easy to use. Based on the above description of the system architecture, users will experience the following flow to use a smart phone to view and update the visualisation through the gateway:
Figure 3-11 User perspective of application flow Run the mobile client application MCV
Input gateway IP address on mobile client application for connection
Connected: client – gateway – server; view visualisation on smart phone
Update visualisation on smart phone Send requests to server through
From the end user’s perspective, the user will only have the smart phone in hand. The server and gateway application are already running and the gateway is waiting for the mobile client to connect. The user will firstly run the MCV application on the smart phone. After inputting the appropriate IP address for the gateway, the network connection is established from the end user side. The user will be able to view the visualisation after this connection is established. By using the functions on the smart phone, the user can send commands to the server through the gateway in order to update the visualisation.
3.8
Summary
In order to meet the requirements for the mobile client application listed in section 3.1, the client – server gateway application is developed for demonstrating the use of a smart phone to visualise a data set. The mobile application allows user to interact with the visualisation remotely within the same visualisation system. The client - server architecture will be able to solve some of the problems of the smart phone, such as limited memory space and lower graphics performance.
Chapter 4
Implementation
The implementation of the design described in chapter 3 is discussed in this chapter. Based on the gateway approach, this chapter covers detailed system implementation procedures and components for the mobile client application. It also describes how the application works under the smart phone environment, and the technical choices made to implement the design as well as the reasons for those decisions.
4.1
System overview
The mobile visualisation system is described in the design section in chapter 3. It includes three major components: Server, Gateway and Mobile Client. (See Figure 3-4). The server is used to upload data, generate the image and transmit it to the client through the gateway. The gateway is used as middleware to transmit the visualisation result to the mobile client and handle update requests made from the client to the server. The mobile client displays the visualisation and requests new visualisations.
4.2
System environment
A key aspect of the thesis is to show the possibility and test the efficiency of generating and updating visualisations remotely based on an existing visualisation system. In this thesis, we use Paraview (Squillacote, 2007) to create the visualisations.
Paraview is an open-source, multi-platform data analysis and visualisation application. It has its own application programming interface (API) wrapped using Python, that allows developers to interact with the Paraview application. Paraview can be fully scripted using the Python language, which can help developers extend an application (Squillacote, 2007) .
The server under the Paraview visualisation system is called pvserver. In this thesis, the server runs under a Windows operating system. The gateway also runs under the same operating system as the server. The smart phone is an HTC brand Touch Pro2 phone. In this thesis, the operating system on the smart phone is Windows Mobile version 6.5.
4.3
Programming language
To interact with the Paraview system, and to communicate between the server and the mobile client, Python is used to program the gateway for the mobile visualisation system.
The smart phone is the mobile client for end users. Since our smart phone is running the Windows Phone operating system, we use VB.NET to program the mobile client application on the smart phone.
4.4
Gateway implementation
With regard to the design of the gateway, the data exchange workflow through the gateway is illustrated in Figure 4-1.
Figure 4-1 Gateway data workflow
client, another is for the server. These two python scripts are used to establish connections and exchange data between the server and the mobile client. Implementations of server-gateway and gateway-client are discussed in detail in the following sections.
4.4.1
Sever-Gateway implementation
We use pvserver to start up the client/server mode between the server and gateway. In this case, the gateway represents the ‘client’ in the Paraview visualisation system.
A python script called servergateway.py, running on the gateway, is used to establish a connection between the server and the gateway.
Now we generate a visualisation using Paraview before transmitting it to the mobile client. To make it happen, when pvserver.exe runs, the gateway connects with pvserver by running servergateway.py. When the connection is made, the gateway accesses the Paraview system, through servergateway.py, to allow the server to render a visualisation. Once the visualisation is ready, servergateway.py saves the image on the server and waits for a new command sent by the client:
Figure 4-2Server - Gateway communication
The following Figure gives an example of the format in the cmd.txt file:
Figure 4-3 Commands text file format
The commands in the text file are stored in order so that the gateway interacts correctly with both client and server sides. Following this order, the gateway reads each line and passes the commands to pvserver to communicate with the Paraview’s servermanager module. The server will then render the new visualisation based on these commands and the new image will be delivered to the mobile client through the gateway.
servergateway.py keeps reading the new commands in cmd.txt file, once it finishes reading them, it deletes the cmd.txt file that contains the old commands it has read already. When new commands are read in the text file, the gateway will pass those commands to pvserver to execute and request an updated visualisation.
4.4.2
Gateway-Client implementation
The gateway uses a python script clientgateway.py to process interactions between itself and the mobile client. It is used to establish a connection between the gateway and the mobile client, transmit commands and visualisations. The latter two are discussed below.
1. Transmitting update commands
The update commands are formatted in the following order when sending to the server:
Vertical rotation angle
Horizontal rotation angle
Zoom scale value
Representation selection value
Reset to initial view or not
One example of the command format is shown in Figure 4-3 under section 4.4.1. The rotation orientation is described in more detail in Figure 4-8 of section 4.5.2.
Once the gateway receives the commands from the mobile client, the gateway uses a file writing function in python to create a new text file named “cmd.txt” (see section 4.4.1). This new cmd.txt file stores commands sent from the mobile client, such as zoom or rotation commands. The commands in cmd.txt file are read line by line. The Paraview server uses those commands to render a new visualisation.
2. Transmitting updated visualisations
The gateway saves every rendered visualisation on the server as a .png file. We use the gateway to read the image file and transmit the visualisation to the mobile client through the network connection. The initial visualisation appears automatically on the smart phone once the connection is established by the user.
4.5
Mobile Client Application Implementation
The mobile client application is designed to interact with a remote Paraview visualisation system for displaying and updating the rendered visualisation. The implementation of this application is discussed below.
4.5.1
Mobile client user interface
The mobile client application was implemented in VB.NET using Visual Studio. The application was tested on a Windows Mobile Emulator 6.0 firstly before running on an HTC Touch Pro2 smart phone. The emulator allows the design or content of the mobile application to be amended relatively easily.
For the purposes of viewing and updating the visualisation on the smart phone, some functions from the Paraview application were chosen to include in the mobile client application. Screenshots of the mobile client user interface are shown below running on the Emulator and HTC phone.
Figure 4-4 Connection Panel of Mobile client interface
The connection panel in Figure 4-4 includes a text field for the user to input the IP address of the gateway. Once the visualisation is generated by the server, the gateway will need to run
client application, users need to input the correct gateway IP address to set up the network connection.
If an invalid IP address is input into the text field, the mobile client application will pop out a message box to alert users:
Figure 4-5 (a) No IP address input
Figure 4-5 (b) Invalid gateway IP address
Figure 4-5 Invalid input alert for gateway connection
These message boxes help users to identify the problems if they cannot connect to the gateway from the mobile client.
Once the connection between the mobile client and the gateway is established, users are able to manipulate the displayed visualisation by choosing from the functions as displayed in Figure 4-6.
There are three command buttons shown in the function panel of the mobile client: Original View,