Research Article
Selective Surface Sintering Using a Laser-Induced Breakdown
Spectroscopy System
H. Jull,
1,2P. Ewart,
1,3R. Künnemeyer,
1,2and P. Schaare
4 1School of Engineering, University of Waikato, Hamilton 3240, New Zealand2The Dodd-Walls Centre for Photonic and Quantum Technologies, Hamilton 3240, New Zealand 3Waikato Institute of Technology, Hamilton 3200, New Zealand
4The New Zealand Institute for Plant & Food Research Ltd, Hamilton 3240, New Zealand
Correspondence should be addressed to H. Jull; [email protected]
Received 27 March 2017; Revised 24 May 2017; Accepted 30 May 2017; Published 27 July 2017
Academic Editor: Violeta Lazic
Copyright © 2017 H. Jull et al. This is an open access article distributed under the Creative Commons Attribution License, which permits unrestricted use, distribution, and reproduction in any medium, provided the original work is properly cited.
Titanium metal injection molding allows creation of complex metal parts that are lightweight and biocompatible with reduced cost in comparison with machining titanium. Laser-induced breakdown spectroscopy (LIBS) can be used to create plasma on the surface
of a sample to analyze its elemental composition. Repetitive ablation on the same site has been shown to create differences from the
original sample. This study investigates the potential of LIBS for selective surface sintering of injection-molded titanium metal. The temperature created throughout the LIBS process on the surface of the injection-molded titanium is high enough to fuse together
the titanium particles. Using the ratio of the Ti II 282.81 nm and the C I 247.86 nm lines, the effectiveness of repetitive plasma
formation to produce sintering can be monitored during the process. Energy-dispersive X-ray spectroscopy on the ablation
craters confirms sintering through the reduction in carbon from 20.29 Wt.% to 2.13 Wt.%. Scanning electron microscope
images confirm sintering. A conventional LIBS system, with afixed distance, investigated laser parameters on injection-molded
and injection-sintered titanium. To prove the feasibility of using this technique on a production line, a second LIBS system, with an autofocus and 3-axis translation stage, successfully sintered a sample with a nonplanar surface.
1. Introduction
Metal injection molding (MIM) is a fabrication method that uses the injection molding process and sintering to create metal parts with complex geometry (parts with varying surface heights). This process combines metal powders with a carrier system or binder, containing thermoplastic poly-mers and waxes to create a feedstock that can be injected into a mold to form a green part [1]. The binder is then gradually removed from the green part by a solvent debinding method, a thermal debinding method, or a combination of both. The part is then referred to as a brown part and is sintered in a furnace at high temperature whereby the particles coalesce or fuse together to form a fully consolidated metal part. Using titanium (Ti) metal in MIM allows parts to be created that are both light in weight and biocompatible [2]. The complex shapes formed offer a reduction in costs associated with titanium parts made by conventional fabrication processes
such as casting or machining and can even form parts not possible to produce by any other means. However, powder metallurgy (PM) is known to produce parts with mechanical properties inferior to those produced from wrought metals due to stress raisers and surface irregularities resulting from incomplete particle coalescence. Incomplete coalescence of titanium PM parts is known to occur due to low-quality starting powders, low sintering time, or temperature and also contaminated furnace atmosphere, all of which affect the outermost surface. These surface defects may be mitigated by optimizing the sinter cycle, secondary processes such as bead blasting and polishing or treatments such as electropol-ishing and coating.
Titanium MIM has the added problem of contamination through any residual binder components of which carbon and oxygen are the most prevalent and the most difficult to mitigate. The transformation of the titanium lattice structure during sintering is influenced by these impurities, and the Volume 2017, Article ID 1478541, 11 pages
formation of oxides/carbides also impinges on the coales-cence. While the saturation levels of interstitial oxygen (wo≤5%) are high, carbon compounds readily form on powder surfaces above 370°C. The presence of carbon on the titanium particles interferes with heat transfer, the oxide presence means the detection, and quantification of the elemental levels is difficult.
Sintering of metals can also be done with high-powered continuous wave (CW) lasers such as those used in direct metal laser sintering and selective laser sintering. This process requires a high-power density over a short time [3]. Laser-induced breakdown spectroscopy (LIBS) uses a high-power pulsed laser to ablate the surface of a sample and to create a plasma that contains the surface elements. The study presented here investigates whether LIBS can be used for selective surface sintering of injection-molded titanium while simultaneously measuring the amount of sintering that has taken place.
1.1. Laser-Induced Breakdown Spectroscopy.LIBS is a form of optical emission spectroscopy utilizing a high-powered, pulsed laser. The short pulse is focused onto a sample surface where it creates a high-power density in a localized area. A plasma is created from the ablated material [4]. Plasma formation is a complex process, which is still under investiga-tion. The current models for ablation describing the change in thermal properties of the sample material are adequate for this study [5]. The models for nanosecond laser ablation state that when a laser hits a target, with enough high energy, the surface heats up, melts, vaporizes, and ionizes creating a plasma. If there is additional energy in the laser pulse, the plasma absorbs it, increasing the plasma temperature. Fur-ther heating of the surface of the target can occur if the plasma is hot enough [6, 7]. For a more detailed discussion on plasma ablation, refer to [8] and the references therein.
Substantial shot-to-shot variation is a problem for quantitative LIBS analysis. Plasmas created on identical samples can have different temperatures which affect emis-sion line intensities [9]. Subtle changes in experimental con-ditions and surface composition can cause these temperature variations. To improve results, averages are generated by repeatedly measuring the same sample. The average spectra can then provide quantitative information on the composi-tion of the sample.
The use of multiple LIBS pulses has been employed for different purposes. One use is removing surface layers off various materials. The LIBS laser is focused on the same surface position, and multiple pulses are used with spectros-copy feedback to determine when the surface layer has been successfully removed. Costela et al. [10] cleaned graffiti off urban buildings with minimal damage to the surface of the building. Li et al. [11] removed cobalt from tungsten carbide hardmetal. Diego-Vallejo et al. [12] used linear correlation and artificial neural networks to determine when the top layers of solar cells had been removed. Majewski et al. [13] cleaned contaminants from thermal barrier coatings, and Roberts et al. [14] removed rock-covering fossils. Maravelaki et al. [15] cleaned Pentelic marble covered in encrustations. Acquaviva et al. [16] cleaned the bust of St. Gregory the
Armenian of contaminants. Flores et al. [17] removed spines from prickled pears without visible damage to the pear, and Bengtsson et al. [18] cleaned salt offhigh-voltage insulators. Another use of multiple LIBS pulses is depth profiling. Martelli et al. [19, 20] determined the different tissues in wheat by looking at the Mg II 279.55 nm to Mg I 285.22 nm intensity ratio as repetitive shots were taken at the same loca-tion. Abdelhamid et al. [21] investigated the effects of laser irradiance and working distance of a sample looking at how the intensity of Cu I 465.1 nm and Au I 431.5 nm changed after repetitive shots. Theodorakopoulos and Zafiropulos [22] looked at depth profiles of varnishes using the C2swan band. De Bonis et al. [23] observed the change in the ratio formed by Cu I 282.35 nm and Sn I 283.94 nm for an increas-ing number of shots on a corroded copper tin alloy. Most of the studies mentioned above used more than 100 pulses because of the small amount of surface material removed. The effects of heat propagation on the underlying surface were not addressed because they were irrelevant for the purposes employed. The heat distribution is determined by laser pulse parameters [8] and the optical coupling efficiency of the material. The ablation site can have differences compared to the original surface. These differences include melted and recondensed matter which no longer exhibits the original sample composition. Surface reflectivity and surface breakdown threshold change [7]. This is caused by high-power density pulses, heat, stress, and pressure during the plasma formation [24]. Inside the ablation crater, there is also recondensed material from the plasma [4]. The study presented in this paper utilizes the heat, stress, and pressure created by multiple plasma formations to change the surface properties to a desired state.
LIBS has previously been used as a process-monitoring technique. Boué-Bigne [25] investigated segregation and decarburization using LIBS on polished high-carbon steel. Elemental maps of the surfaces were produced using individ-ual emission lines. One map created using a neutral manga-nese line was normalized with a neutral iron line removing the baseline gradient. Cabalín and Laserna [26] used pulsed laser deposition to coat silicon with manganin. They pro-duced multielemental maps to monitor the coating constitu-ents. Pedarnig et al. [27] utilized LIBS for in situ monitoring of plasma emission on thin-film deposition. Emission lines of interest were normalized by neutral and ionized yttrium lines and a neutral zinc line. Gruber et al. [28] designed a LIBS system for in situ analysis of solid and molten metals. Chro-mium, copper, manganese, and nickel were investigated using iron lines as an internal standard. Gruber et al. [29] also performed LIBS analysis on molten metal for chromium, nickel, and manganese but under a vacuum. Lopez-Moreno et al. [30] created a stand-offLIBS system to analyze molten metal as an in-process control. Quantitative analysis of chromium, nickel, and manganese was performed on steel samples at 1000°C. The present work investigates LIBS as a method for real-time monitoring of the amount of sintering taking place as a result of the LIBS process.
amplitude of spectra caused by experimental conditions. This is referred to as an internal reference, where all emission lines of interest are normalized using a single emission line. The emission line used as a reference is usually from an element with a constant concentration or of an element that makes up the majority of the plasma [6]. The sample can also be spiked with a foreign element of constant concentration, which can be used as a reference. An important consideration is to choose lines that have similar upper level electron energies (Ek). This will reduce the temperature effects,
which cause large deviations in emission intensities. Tem-perature characteristics of each line need to be considered if variations are to be minimized. The magnitudes of the emission lines are to be comparable to reduce the statistical uncertainties produced by combining the percentage uncer-tainties of each signal. An example of this problem would be combining a strong line with a weak line. The percent-age uncertainty, which is used to compute the resulting variance, would be larger for the weak line producing a high uncertainty.
This study investigates the use of multiple LIBS pulses, for postprocessing, to improve the outer surface of Ti MIM samples with complex geometry. This is achieved by the removal of residual carbon (compounds) from and below the surface thus enabling full coalescence. This process will be controlled by spectral feedback from the carbon and titanium lines. The hypothesis is that the heat caused by the LIBS process, from multiple pulses, is sufficiently high that the amount of surface sintered is relatively large compared to the ablated material. This would allow laser sintering and measurement of surface properties at the same time.
2. Experimental Setup
A commercial Spectrolaser 4000 unit (Laser Analysis Tech-nologies, Australia) containing a Nd:YAG laser operating at 1064 nm with a pulse width of 7 ns and pulse energies of 50, 100, and 200 mJ was focused at afixed distance perpendicular to the sample surface to generate the plasma. The spot diameter was about 650μm, which results in an irradiance of about 8.6 GW cm−2at 200 mJ per pulse. The wavelength range of 185.25–948.80 nm was captured by the four spec-trometers inside the Spectrolaser unit. The specspec-trometers were set to integrate for 1 ms after a 1.27μs delay from the onset of the laser pulse. This system can reach high laser pulse energies but does not allow changing of the lens-to-sample distance. The setup was used to investigate the effect that laser pulse energy has on thermally debound injection-molded titanium samples.
A second commercial system (LIBS-6, Applied Photon-ics, UK) containing a Nd:YAG laser (Big Sky Ultra, Quantel, France) with the same wavelength, pulse width, delay, and integration time as the Spectrolaser was set to 100 mJ per pulse. The built-in beam expander was focused to produce a spot size on the sample of 450μm, roughly 80 mm from the beam expander producing an irradiance of 9.0 GW cm−2. Each spectrum was acquired with six spectrometers (Avantes, The Netherlands) covering the range 182.26–908.07 nm. A 3-axis translation stage moved
the sample into the focal position of the LIBS beam. This sys-tem produces less laser pulse energy than the previous one but can change the lens-to-sample distance. The setup was used to demonstrate the selective sintering process at different heights using a simple autofocus system.
The Spectrolaser system was used with afixed distance to the sample to acquire an average of 100 spectra from different locations on a single thermally debound sample and a single-sintered sample (see Section 2.2 for sample descriptions). Different locations were used to avoid the effects of previous pulses on the same site. Spectra were then acquired by sampling 10 different locations, on the thermally debound sample, 20 times at 50, 100, and 200 mJ per pulse. The second LIBS system was used with the autofocus function enabled to evaluate its use in removing surface carbon on a sample with varying surface height.
A commercial field emission scanning electron micro-scope (SEM) (Hitachi S-4700, Hitachi High Technologies, USA) with an accelerating voltage of 20 kV, emission current of 11,000 nA, and a working distance of 11,200μm was used to investigate the morphology of the ablation craters. An energy-dispersive X-ray spectroscopy (EDS) attachment to the SEM (Noran System 6, Thermo Fisher Scientific, USA) was used to compare the composition of the craters to that obtained from the LIBS spectra.
2.1. Autofocus. A 635 nm, 4.5 mW, continuous wave laser directed on the ablation site was used in conjunction with a miniature CCD video camera, connected to the LIBS-6 module, to create an autofocus system based on the trian-gulation method. The laser was aligned so that the axis of the laser beam would intersect with the ablation site. The AForge.NET framework (a library of common computer vision algorithms [31]) was used to filter the image from the camera to only show the beam spot. The centroids of the resulting images (Figures 1(b), 1(d), and 1(f)) were calculated, and a model created to relate the centroid posi-tion of the laser spot with the distance from the ablaposi-tion site. Figure 1(b) corresponds to the sample being too close to the 6 machine, Figure 1(d) too far from the LIBS-6 system, and Figure 1(f) at a distance where the focus of the LIBS beam is directly on the surface of the sample. This set-up was used in a feedback control system to move the vertical translation stage and hold the sample at the correct height.
2.2. Samples.The samples were made using a binder system comprised of polyethylene glycol 8000, polyethylene glycol 20,000, natural bees wax, linear low-density polyethylene, and polypropylene [32]. The metal powder was commercially pure titanium produced by the hydride-dehydride route with a particle size less than 325μm (Specialty Metallurgical Prod-ucts Co. Inc., USA). The binder system was combined with the titanium powder to produce a feedstock with a volume fraction of 30% binder to 70% metal powder. The feedstock was mixed using a corotating twin screw extruder (Thermo-Lab, Lab digital, USA) operatingD= 16 mm screws,L/D= 24,
(35 M, Dr Boy, Germany) to create a part shape with complex geometry, that is, with multiple step heights. The dimensions of the part are shown in Figure 2.
Debinding was done using both solvent and thermal processes. A solvent debinding kit (SDK) assembled at the University of Texas-Pan American was used for the test
40 mm
8 mm 6 mm 4 mm
2 mm
Figure2: Geometry and dimensions for the titanium injection-molded part.
x z
(a)
y x
(b)
(c) (d)
(e) (f)
Figure1: Triangulation method using a 635 nm CW laser (beam entering from the left). The vertical beam converging on the sample
represents the LIBS beam. (a), (c), and (e) show where the autofocus laser strikes the sample surface. (b), (d), and (f) show the camera
samples [32]. Thermal debinding was done in a convective drying oven (FED53, Binder, USA) (V= 53 L,T= 30–300°C) with a gas tight chamber and programmable PID tempera-ture control. After parts were solvent debound, the samples were identified using the designation “TD” for thermal debound (brown parts).
The brown parts were sintered in a furnace (ACME, China) by initial heating with an isothermal period at 470°C (β= 5°C/min,t= 60 min) followed by further heating to 800°C, all under argon sweep gas (V= 10.0 L/min). This was followed by a further heat increase and afinal isother-mal period at sinter temperature under vacuum (5°C/min,
t= 180 min,T= 1350°C,p= 2 0 × 10−3mbar). The sintered parts were given the designation“S.”Both TD and S samples were sanded to remove surface coating and finger print residue. Sectioned and polished S samples were analyzed by X-ray diffraction (XRD) (Empyrean, PANalytical, The Netherlands), with power settings 45 kV at 40 mA through a copper electrode, scanning from position 20 to 100° 2θ, using a step size of 0.026°2θ, scan step time of 17.340 s in con-tinuous scanning mode. Peak identification was done using the HighScore software (PANalytical, The Netherlands).
3. Results and Discussions
3.1. The TD and S Samples. The conventional means of determining binder level during MIM processing is by weighing each sample and comparing the mass to the theoretical value. This method is accurate for most solvent, and thermal debinding processes carried out under 250°C. However, conventional thermal debinding temperatures are above 420°C, at which point the thermoplastic binders are reduced to the constituent elements (carbon, oxygen, nitrogen, and hydrogen). Also, at these temperatures, tita-nium preferentially absorbs those elements with no indica-tion from the component mass. Without destructive testing, it is difficult to determine whether binder residue levels are sufficiently low, and the desired mechanical properties are achieved. Higher elemental levels near the external surfaces can be seen (Figure 3(a)) compared to those internally (Figure 3(b)). The difference arises because the rate of ele-mental diffusion is slower than the rate of surface deposition
once the pores between the particles close during sintering and densities greater than about 94% are reached.
Even where levels of carbon and oxygen meet specified standards, they may still hinder coalescence of the particles during sintering and cause surface porosity. Surface porosity as seen in Figure 3 reduces the mechanical properties of the final part. The XRD analysis confirmed the presence of carbon and oxygen, as carbide formations, near the external surface [33]. The ability to reduce the elemental levels at the surface should therefore enable a decrease in porosity and subsequent increase in overall density leading to improvements in mechanical properties. Using LIBS to selectively sinter parts of the surface, postprocessing may have the ability to do this.
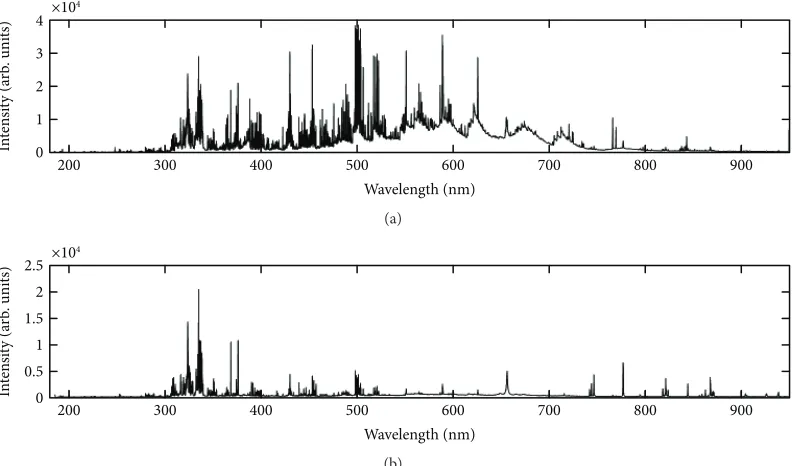
3.2. Difference in Carbon Content between the TD and S Samples. The average spectra of 100 shots on each of the TD and S samples are shown in Figure 4. These spectra were analyzed tofind spectral lines that fulfilled the criteria discussed in Section 1.2. Each shot was aimed at different locations on the sample. The emission lines observed in the spectra of the S sample were weaker, and the back-ground continuum was reduced. The Ti II lines were dominant, and the strong lines of Ti I, which are prevalent between 400 and 600 nm, were significantly reduced. These differences are shown in Figure 4. The UV range, where a number of well-identified Ti lines are present, is highlighted in Figure 5.
Lines that were identified as suitable for internal stan-dardization were C I 247.86 nm (Ek= 7.685 eV) and Ti II 282.81 nm (Ek= 8.132 eV). Taking the ratio of these lines, over all 100 shots on the S sample are 2.45. The C I and Ti II line intensity depends on transition probabilities, electron temperature, and electron density of the plasma, which are governed by highly complex processes in a multicomponent plasma. Time profiles of the species differ as well. As the lifetime of the plasma is shorter than the minimum integra-tion time of the spectrometers, the temporal behavior cannot be analyzed. However, the intensity ratio of the C I/Ti II lines can be calibrated against other measurements, like EDS, and should be useful to determine when enough carbon has been removed. A threshold value of 2.45 was used to indicate when the TD sample had been sintered. At this threshold, the
100 𝜇m
(a)
100 𝜇m
(b)
Figure3: Microstructure of thermally sintered Ti part prior to laser sintering (a) polished external surface and (b) sectioned and polished
amount of titanium and carbon in the TD sample surface would resemble that of the S sample.
EDS results show that there is a difference in carbon between the TD sample and the S sample of 18.5 Wt.%. Table 1 displays the results obtained from EDS. When the vanadium content is low, an incorrect concentration for vanadium is determined because of the overlap between the TiKβ(4.93 keV) and the VKα(4.95 keV) peaks in the EDS spectra [34]. The actual vanadium content was determined to be less than 0.01% V from the supplier (Specialty Metallur-gical Products Co. Inc., USA). The silicon content is a residue from sanding the sample. The peak intensity ratio of the
spectral lines is proportional to the amount of Ti II compared with C I present in the plasma. The amount of titanium in the plasma would be split between Ti I and Ti II. Therefore, the actual concentration ratio, which can be calculated from the EDS results, cannot easily be determined from the spectra without full knowledge of all plasma parameters, like electron temperature and electron density.
3.3. Energy Effects on Multiple Shots.Irradiating an ablation site multiple times with LIBS pulses and comparing the resulting spectra gives information on the amount of sinter-ing taken place. The TD sample was irradiated in 10 different
2000
1500
1000
500
0
In
ten
si
ty (a
rb
. uni
ts)
240 250 260 270 280 290 300
Wavelength (nm) C I
Ti II Ti I
Ti II
Ti I
(a)
1000
500
0
In
ten
si
ty (a
rb
. uni
ts) Ti II
Ti II Ti II
Ti I
Ti I
240 250 260 270 280 290 300
Wavelength (nm)
(b)
Figure5: Enlarged section of Figure 4 showing some of the differences between the Ti I and Ti II emissions from the TD (a) and S (b) samples.
In
ten
si
ty (a
rb
. uni
ts) 4
3
2
1
0
×104
200 300 400 500 600 700 800 900
Wavelength (nm)
(a)
In
ten
si
ty (a
rb
. uni
ts) 2.5
2
1.5
1
0.5
0
×104
900
200 300 400 500 600 700 800
Wavelength (nm)
(b)
Figure4: Average spectra acquired from 100 shots on the TD (a) and S (b) samples. Each shot was on a fresh surface which had not previously
been sampled.
Table1: Comparison of the Ti and C content.
LIBS EDS
Peak intensity ratio (Ti/C) C (Wt.%) Ti (Wt.%) V (Wt.%) O (Wt.%) Si (Wt.%)
Thermally debound 0.762 20.29±0.32 74.00±0.68 — 5.71±0.56 —
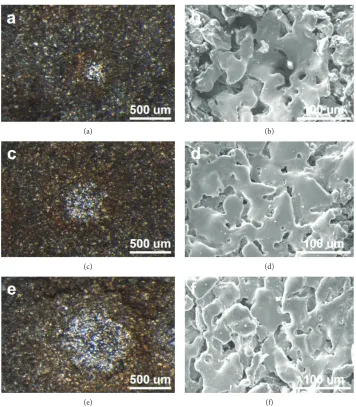
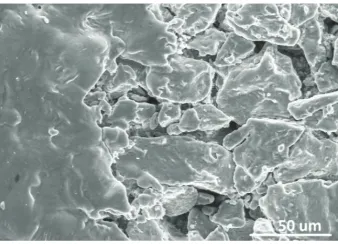
locations by 20 successive pulses. This process was repeated at different laser pulse energies. The resulting spectra were investigated to determine the effect of laser pulse energy. Figure 6 shows the ablation sites at different laser energies. Figures 6(a), 6(c), and 6(e) are optical microscopy images and Figures 6(b), 6(d), and 6(f) are SEM images. The area being sintered increases as the laser pulse energy increases, as can be seen by the increasing spot in Figures 6(a), 6(c), and 6(e). SEM images of the centers of the ablation craters shown in Figures 6(a), 6(c), and 6(e) are displayed in Figures 6(b), 6(d), and 6(f). These images confirm that sinter-ing has taken place. The edge of the sintered titanium parti-cles are seen in Figure 6(b). The contrast between titanium particles that have and have not been sintered is displayed in Figure 7.
In addition to the line ratio mentioned above, other spectral lines were considered for their suitability to monitor sintering. Sixteen Ti I lines were investigated by calculating the ratio of the Ti I line intensity to the C I 247.86 nm
intensity. These ratios were normalized then scaled so that they could be compared to the above reference threshold value. Successive sampling using different energies is dis-played in Figure 8 for the Ti I 398.18 nm/C I 247.86 nm intensity ratio. The error bars in Figure 8 correspond to the standard deviation of the 10 spectra that were used to find the average ratio for each point on the graph. All other emission line ratios exhibit a trend similar to that of Figure 8. The small initial value in thefirst shot may be due to surface contamination. The large fluctuations and error bars are produced by the large difference inΔEk(difference
in Ek) between the Ti I lines and C I 247.86 nm which range
from 3.26 eV to 5.29 eV. At these high-energy differences, the ratios cannot mitigate the differences in plasma temperature caused by shot-to-shot variations.
Using the same normalizing and scaling procedure as above, 47 Ti II to C I 247.86 nm intensity ratios were analyzed as well. The wavelengths of the Ti II lines were between 252.56 and 457.20 nm and had ΔEkbetween −0.39 eV and
(a) (b)
(c) (d)
(e) (f)
Figure6: Ablation craters from 20 consecutive laser pulses using 50 mJ (a), (b); 100 mJ (c), (d); and 200 mJ (e), (f). (a), (c), and (e) are taken
4.02 eV. A selection of these lines is shown in Table 2, and their variation with the number of 200 mJ laser shots in Figure 9. After 10 shots, all line ratios are above the sintering threshold.
Using Ti II rather than Ti I, substantial lines improved the sintering prediction. The Ti II lines that produced the best results were 264.59, 280.48, 281.02, 281.78, and 282.81 nm. Their upper energy level difference to the C I line, ΔEk, is between −0.397 and −0.881 eV. All lines followed the trend shown in Figure 10 for the 282.81 nm line. However, C I 247.86 nm (Ek= 7.685 eV) and Ti II
282.81 nm (Ek= 8.132 eV) was identified as the most robust
combination for internal standardization.
Figure 10 shows that 50 mJ successive shots bring no increase to the titanium to carbon intensity ratio but instead give a slow, steady decline. At 100 mJ, the ratio of peak intensities increases until the tenth shot where the ratio starts to decrease. It is not clear what causes this behavior. At 200 mJ, the intensity ratio increases until it surpasses the threshold of the S sample obtained from Section 3.2. After 10 shots, the threshold value is surpassed, and the TD surface composition is comparable to the S surface. The reason the
ratio continues to increase for 200 mJ is that the high-power density produced by the 200 mJ pulse raises the temperature in the sample through heating from the LIBS beam during plasma formation. The heat on the surface starts the sintering process, removing residual binder and fusing together the titanium particles. As the number of laser pulses increases, particle fusion increases. The particle fusion and necking in Figures 6, 7, and 11 are evidence that the surface has been sintered.
EDS results (Table 3) of the ablation crater created from the 200 mJ treatment (Figure 6(e)) show that the carbon content after 20 shots has reduced from 20.29 Wt.% to 2.13 Wt.% which is comparable to the S sample. The area examined by EDS is presented in Figure 6(f). This confirms the reduction in carbon seen in the titanium to carbon intensity ratio obtained from the LIBS spectra. These results show that there is enough heat penetrating into the sample
Figure7: SEM showing the edge of sintered titanium. Unsintered
particles to the right were not irradiated with the laser beam.
N
o
rm
alized T
i I/CI
3.5
3
2.5
2
1.5
1
0.5
0
0 5 10 15 20
a
Number of shots
Figure8: Evolution of the normalized Ti I 398.18 nm/C I 247.86 nm
intensity ratio of the thermally debound sample. The dashed line
shows the sintering threshold. The different energies used were
200 mJ (●), 100 mJ (♦), and 50 mJ (▲) per pulse.
Table2: Ionized titanium emission lines used in Figure 9.
λ(nm) Ek(eV) ΔEk
253.13 5.03 2.65
264.59 8.57 −0.88
281.02 8.10 −0.41
283.22 4.95 2.73
351.08 5.42 2.26
352.03 5.57 2.12
353.54 5.57 2.12
362.48 4.64 3.04
416.36 5.57 2.12
433.79 3.94 3.75
450.13 3.87 3.82
3.5
3
2.5
2
1.5
1
0.5
0
N
o
rm
alized T
i II/C I
0 5 10 15 20
Number of shots
Figure9: Evolution of multiple Ti II lines (Table 2) for a laser pulse
creating sintering with very small removal of surface material due to plasma formation.
3.4. Reduction of Carbon Signal in LIBS Spectra. The focal position of the LIBS beam was positioned on the surface of the TD sample. The spot size of the laser, determined from the ablation crater, is approximately 650μm in diam-eter. When successive shots are fired, sintering expands until it fills the entire spot size of the incident laser. The high-carbon content correlates to the unsintered part of the surface being sampled and is reduced as the area being sampled fuses together. When the entire area under the laser spot is sintered, the Ti/C ratio resembles that of sintered titanium.
It can be seen from the SEM images in Figure 6 that there has been sintering in all ablation craters from 50, 100, and 200 mJ laser pulses even though the LIBS intensity ratio does not reach the threshold value of the S sample. After 20 shots at 50 mJ, there is a sintered spot in the middle of the ablation crater which is about 250μm in diameter. Because of the low laser energy, there is not enough heat generated on the surface of the sample to produce particle fusion over the
entire spot size of the laser. Subsequent shots would still be sampling the carbon in the unsintered part of the ablation crater, and the Ti/C ratio does not reach the threshold value. The 100 mJ crater shows similar results with a slightly bigger sintered spot.
3.5. Implementation.The LIBS-6 system, coupled with the autofocus unit and 3-axis translation stage, was used to produce sintering on the surface of the sample steps at heights of 2, 4, and 6 mm (see Figure 12). The Spectrolaser system produced sintering at 200 mJ per pulse, with an irradiance of 8.6 GW cm−2. Using the LIBS 6 system, which has a smaller spot size, increases irradiance on the sample causing higher temperatures and increased localized heat-ing on the surface of the sample. With a pulse energy of 100 mJ, an irradiance of 9.0 GW cm−2 is produced which is comparable to the Spectrolaser system. Therefore, the LIBS-6 system will provide the same heat that the Spectro-laser system produces, entirely sintering the spot area after 10 shots.
The results of sintering a line on the TD sample using the LIBS-6 system and the ratio threshold of 2.45 to control the process are displayed in Figures 11 and 12. The LIBS-6 system had a spot diameter of 450μm and a repetition rate of 20 Hz with the sample stage moving at a speed of roughly 0.4 mm/s−1. It can be seen that the titanium particles have fused together forming a solid mass. After sintering had taken place, on an ablation site, the LIBS beam was moved to a new surface which overlapped the previous spot. Sintering was then repeated on the new surface. The liquid titanium formed on the new spotflowed over the previously sintered spot and has fused together. These regions are seen in Figure 11. This process was repeated until a sintered line was produced across the sample. Figure 12 shows the effectiveness of pulsed laser sintering a line across injected-molded titanium at step heights of 6, 4, and 2 mm using autofocus. The effect of heat propagation through the part can be seen by the titanium bluing.
4. Conclusions
LIBS has been proven useful for sintering-selected surfaces of injection-molded titanium. The LIBS beam, plasma, and residual heat of the sample surface all contribute to the heating of the injection-molded titanium causing sintering. By observing the C I 247.856 nm and the Ti II 282.806 nm lines and then comparing the intensity ratio to that of a conventionally sintered sample, the amount of sintering taking place can be determined. Repetitive shots continue heating the surface and provide spectral feedback to monitor whether the sintering process is complete. The effectiveness
Figure11: SEM image of sintering resulting from slowly moving
the LIBS-6 beam after 10 shots.
Table 3: Sample composition after repetitive shots compared to
traditional sintering. Results obtained from EDS.
C (Wt.%) Ti (Wt.%) V (Wt.%) Si (Wt.%)
Ablation crater 2.13±0.26 97.27±0.84 0.59±0.32 —
Sintered 1.79±0.24 96.78±0.69 0.24±0.24 1.19±0.08
T
i II 282.806/C I 247.856 (a
rb
. uni
ts)
3.5
3
2.5
2
1.5
1
0.5
0 b
Number of shots
0 5 10 15 20
Figure10: Evolution of the peak intensity ratio for Ti II 282.81 nm/
C I 247.86 nm on the thermally debound sample. The dashed line
shows the sintering threshold. The different energies used were
of using LIBS to determine when the sample has been sintered has been verified using EDS and SEM images. EDS results show a 18.5 Wt.% reduction in carbon content. It was found that 10 shots at an irradiance between 8.6 and 9.0 GW cm−2is sufficient to sinter the spot produced by the LIBS beam.
Using the triangulation method described, an autofocus mechanism was produced and calibrated to the LIBS-6 sys-tem. This system was used on an injection-molded grey part with varying step heights to prove the viability of using LIBS in a production process on metal parts with complex geome-try. Sintered lines were produced on different step heights of an injection-molded sample. The heat from repetitive plasma formations has colored the previously sintered titanium.
Additional Points
Highlights. The amount of sintering under a laser spot is evaluated using LIBS. Spectral measurements determine the relative titanium to carbon content. LIBS and Energy-dispersive X-ray Spectroscopy results display a reduction in carbon contents on the sintered surface.
Conflicts of Interest
The authors declare that they have no conflicts of interest.
Acknowledgments
The authors would like to acknowledge and offer continuing respect and admiration to deceased colleague Dr. Sadhana Talele, who was not able to see this work completed. This work was supported by New Zealand’s Ministry of Business, Innovation and Employment under contract C11X1209.
References
[1] J. Beddoes and M. J. Bibby, “6 - powder metallurgy,” in
Principles of Metal Manufacturing Processes, J. Beddoes and
M. J. Bibby, Eds., pp. 173–189, Butterworth-Heinemann,
Oxford, 1999.
[2] T. Ebel, “17 - metal injection molding (MIM) of titanium
and titanium alloys,”inHandbook of Metal Injection Molding,
D. F. Heaney, Ed., pp. 415–445, Woodhead Publishing,
Cam-bridge, United Kingdom, 2012.
[3] A. Simchi,“Direct laser sintering of metal powders:
mecha-nism, kinetics and microstructural features,”Materials Science
and Engineering A, vol. 428, pp. 148–158, 2006.
[4] D. Cremers and L. Radziemski,“Introduction,”inHandbook
of Laser-Induced Breakdown Spectroscopy, p. 3, John Wiley & Sons Ltd, West Sussex, UK, 2013.
[5] J. F. Ready, “Effects due to absorption of laser radiation,”
Journal of Applied Physics, vol. 36, pp. 462–468, 1965.
[6] J. P. Singh and S. N. Thakur,“Fundamentals of laser induced
breakdown spectroscopy,”inLaser-Induced Breakdown
Spec-troscopy, J. P. Singh and S. N. Thakur, Eds., p. 3, Elsevier, Oxford, UK, 2007.
[7] D. Cremers and L. Radziemski,“Basics of the LIBS plasma,”
in Handbook of Laser-Induced Breakdown Spectroscopy, D. Cremers and L. Radziemski, Eds., p. 29, John Wiley & Sons Ltd, West Sussex, UK, 2013.
[8] A. Bogaerts, Z. Chen, R. Gijbels, and A. Vertes,“Laser ablation
for analytical sampling: what can we learn from modeling?”
Spectrochimica Acta Part B: Atomic Spectroscopy, vol. 58,
pp. 1867–1893, 2003.
[9] U. Panne, C. Haisch, M. Clara, and R. Niessner,“Analysis of
glass and glass melts during the vitrification process of fly
and bottom ashes by laser-induced plasma spectroscopy. Part
I: normalization and plasma diagnostics,”Spectrochimica Acta
Part B: Atomic Spectroscopy, vol. 53, pp. 1957–1968, 1998.
[10] A. Costela, I. Garcıa-Moreno, C. Gómez, O. Caballero, and R.́
Sastre,“Cleaning graffitis on urban buildings by use of second
and third harmonic wavelength of a Nd: YAG laser: a
compar-ative study,”Applied Surface Science, vol. 207, pp. 86–99, 2003.
[11] T. Li, Q. Lou, Y. Wei, F. Huang, J. Dong, and J. Liu,“
Laser-induced breakdown spectroscopy for on-line control of selective removal of cobalt binder from tungsten carbide
hard-metal by pulsed UV laser surface ablation,”Applied Surface
Science, vol. 181, pp. 225–233, 2001.
[12] D. Diego-Vallejo, D. Ashkenasi, A. Lemke, and H. J. Eichler,
“Selective ablation of Copper-Indium-Diselenide solar cells
monitored by laser-induced breakdown spectroscopy and
classification methods,” Spectrochimica Acta Part B: Atomic
Spectroscopy, vol. 87, pp. 92–99, 2013.
[13] M. S. Majewski, C. Kelley, W. Hassan, W. Brindley, E. H.
Jordan, and M. W. Renfro,“Laser induced breakdown
spec-troscopy for contamination removal on engine-run thermal
barrier coatings,”Surface and Coatings Technology, vol. 205,
pp. 4614–4619, 2011.
[14] D. E. Roberts, A. du Plessis, J. Steyn, L. R. Botha, S. Pityana,
and L. R. Berger,“An investigation of Laser Induced
Break-down Spectroscopy for use as a control in the laser removal
of rock from fossils found at the Malapa hominin site, South
Africa,” Spectrochimica Acta Part B: Atomic Spectroscopy,
vol. 73, pp. 48–54, 2012.
[15] P. V. Maravelaki, V. Zafiropulos, V. Kilikoglou, M. Kalaitzaki,
and C. Fotakis, “Laser-induced breakdown spectroscopy as
a diagnostic technique for the laser cleaning of marble,”
Spectrochimica Acta Part B: Atomic Spectroscopy, vol. 52,
pp. 41–53, 1997.
[16] S. Acquaviva, M. L. De Giorgi, C. Marini, and R. Poso, “A
support of restoration intervention of the bust of St. Gregory the Armenian: compositional investigations by laser induced
breakdown spectroscopy,” Applied Surface Science, vol. 248,
pp. 218–223, 2005.
[17] T. Flores, L. Ponce, M. Arronte, and E. de Posada, “
Free-running and Q: switched LIBS measurements during the
laser ablation of Prickle Pears spines,” Optics and Lasers
in Engineering, vol. 47, pp. 578–583, 2009.
[18] M. Bengtsson, R. Grönlund, M. Lundqvist, A. Larsson, S.
Kroöll, and S. Svanberg, “Remote laser-induced breakdown
spectroscopy for the detection and removal of salt on
metal and polymeric surfaces,”Applied Spectroscopy, vol. 60,
pp. 1188–1191, 2006.
[19] M. R. Martelli, C. Barron, P. Delaporte, G. Viennois, X. Rouau,
and A. Sadoudi,“Pulsed laser ablation: a new approach to
reveal wheat outer layer properties,”Journal of Cereal Science,
vol. 49, pp. 354–362, 2009.
[20] M. R. Martelli, F. Brygo, P. Delaporte, X. Rouau, and C.
Barron,“Estimation of wheat grain tissue cohesion via laser
induced breakdown spectroscopy,” Food Biophysics, vol. 6,
pp. 433–439, 2011.
[21] M. Abdelhamid, S. Grassini, E. Angelini, G. M. Ingo, and M. A.
Harith,“Depth profiling of coated metallic artifacts adopting
laser-induced breakdown spectrometry,”Spectrochimica Acta
Part B: Atomic Spectroscopy, vol. 65, pp. 695–701, 2010.
[22] C. Theodorakopoulos and V. Zafiropulos, “Depth-profile
investigations of triterpenoid varnishes by KrF excimer laser
ablation and laser-induced breakdown spectroscopy,”Applied
Surface Science, vol. 255, pp. 8520–8526, 2009.
[23] A. De Bonis, B. De Filippo, A. Galasso, A. Santagata, A.
Smaldone, and R. Teghil,“Comparison of the performances
of nanosecond and femtosecond Laser Induced Breakdown
Spectroscopy for depth profiling of an artificially corroded
bronze,”Applied Surface Science, vol. 302, pp. 275–279, 2014.
[24] F. O. Leme, Q. Godoi, P. H. M. Kiyataka, D. Santos, J. A. M.
Agnelli, and F. J. Krug,“Effect of pulse repetition rate and
number of pulses in the analysis of polypropylene and high density polyethylene by nanosecond infrared laser induced
breakdown spectroscopy,” Applied Surface Science, vol. 258,
pp. 3598–3603, 2012.
[25] F. Boué-Bigne, “Laser-induced breakdown spectroscopy
applications in the steel industry: rapid analysis of segregation
and decarburization,” Spectrochimica Acta Part B: Atomic
Spectroscopy, vol. 63, pp. 1122–1129, 2008.
[26] L. M. Cabalín and J. J. Laserna, “Surface stoichiometry
of manganin coatings prepared by pulsed laser deposition
as described by laser-induced breakdown spectrometry,”
Analytical Chemistry, vol. 73, pp. 1120–1125, 2001.
[27] J. D. Pedarnig, J. Heitz, T. Stehrer et al., “Characterization
of nano-composite oxide ceramics and monitoring of oxide
thinfilm growth by laser-induced breakdown spectroscopy,”
Spectrochimica Acta Part B: Atomic Spectroscopy, vol. 63,
pp. 1117–1121, 2008.
[28] J. Gruber, J. Heitz, H. Strasser, D. Bäuerle, and N. Ramaseder,
“Rapid in-situ analysis of liquid steel by laser-induced
breakdown spectroscopy,” Spectrochimica Acta - Part B
Atomic Spectroscopy, vol. 56, pp. 685–693, 2001.
[29] J. Gruber, J. Heitz, N. Arnold et al.,“In situ analysis of metal
melts in metallurgic vacuum devices by laser-induced
break-down spectroscopy,” Applied Spectroscopy, vol. 58, pp. 457–
462, 2004.
[30] C. Lopez-Moreno, S. Palanco, and J. J. Laserna,“Calibration
transfer method for the quantitative analysis of
high-temperature materials with stand-offlaser-induced breakdown
spectroscopy,” Journal of Analytical Atomic Spectrometry,
vol. 20, pp. 1275–1279, 2005.
[31] aforgenet.com,“AForge.NET framework,”2012, http://www.
aforgenet.com/framework/.
[32] P. Ewart, S. Ahn, and D. Zhang, “Mixing titanium MIM
feedstock: homogeneity, debinding and handling strength,”
Powder Injection Moulding International, vol. 5, pp. 54– 59, 2011.
[33] P. Ewart, H. Jull, R. Künnemeyer, and P. N. Schaare,“Identifi
-cation of contamination levels and the microstructure of metal
injection moulded titanium,” in Key Engineering Materials,
T. Ebel and F. Pyczak, Eds., vol. 704, pp. 161–169, Trans
Tech Publications Ltd, Zurich, Switzerland, 2016.
[34] J. C. Russ, “Chapter 3 - energy dispersive spectrometers,”in
Fundamentals of Energy Dispersive X-ray Analysis, J. C. Russ,
Ed., pp. 17–41, Butterworth-Heinemann, Oxford, United
Submit your manuscripts at
https://www.hindawi.com
Hindawi Publishing Corporation
http://www.hindawi.com Volume 2014 Inorganic Chemistry International Journal of
Hindawi Publishing Corporation
http://www.hindawi.com Volume 201
Photoenergy
Hindawi Publishing Corporation
http://www.hindawi.com Volume 2014 Carbohydrate Chemistry International Journal of International Journal of
Hindawi Publishing Corporation
http://www.hindawi.com Volume 2014 Journal of
Chemistry
Hindawi Publishing Corporation
http://www.hindawi.com Volume 2014
Physical Chemistry
Hindawi Publishing Corporation http://www.hindawi.com
Analytical Methods in Chemistry
Journal of
Volume 2014
Bioinorganic Chemistry and Applications Hindawi Publishing Corporation
http://www.hindawi.com Volume 2014
Spectroscopy
International Journal ofHindawi Publishing Corporation
http://www.hindawi.com Volume 2014
The Scientific
World Journal
Hindawi Publishing Corporationhttp://www.hindawi.com Volume 2014 Medicinal Chemistry
Hindawi Publishing Corporation
http://www.hindawi.com Volume 2014
Chromatography Research International
Hindawi Publishing Corporation
http://www.hindawi.com Volume 2014
Applied ChemistryJournal of Hindawi Publishing Corporation
http://www.hindawi.com Volume 2014
Hindawi Publishing Corporation
http://www.hindawi.com Volume 2014
Theoretical Chemistry Journal of
Hindawi Publishing Corporation
http://www.hindawi.com Volume 2014
Journal of
Spectroscopy
Analytical Chemistry
Hindawi Publishing Corporation
http://www.hindawi.com Volume 2014
Journal of
Hindawi Publishing Corporation
http://www.hindawi.com Volume 2014
Quantum Chemistry
Hindawi Publishing Corporation
http://www.hindawi.com Volume 2014
International
Electrochemistry
International Journal ofHindawi Publishing Corporation
http://www.hindawi.com Volume 2014
Hindawi Publishing Corporation
http://www.hindawi.com Volume 2014