© 2017 IJSRSET | Volume 3 | Issue 8 | Print ISSN: 2395-1990 | Online ISSN : 2394-4099 Themed Section : Engineering and Technology
Formation of K-Means and Density Based Clustering In Data
Mining
1Y.Vijay Bhaskar Reddy, 2 Dr. L. S. S. Reddy,
1 Research Scholar, Rayalaseema University, Kurnool, Andhra Pradesh, India 2Vice Chancellor, KL University, Vaddeswaram, Guntur, Andhra Pradesh, India
ABSTRACT
Clustering or Cluster analysis is defined as a method where different data objects are grouped into various data sets distinctly. Each of these different sets contains objects. These are similar to other objects in the same set. Immediately objects in various sets are not at all like each other. K-means clustering is a kind of unsupervised learning; it is utilized unlabeled information (information without characterized classes or gatherings) when we have. The point of this algorithm is to discover groups in the information; with the quantity of gatherings spoke to by the variable K. Density based clustering is a method that permits partition of information into bunches with comparative attributes (clusters) however does not require determining the quantity of those gatherings ahead of time. Density based clustering calculation has assumed a critical part to discover non linear shapes structure relies upon the group thickness. Density is estimated by the quantity of information focuses inside some range (epsilon).
Keywords : Clustering, K-means algorithm, Density based algorithm, epsilon, and Euclidean point.
I.
INTRODUCTION
Clustering is the way toward apportioning (partitioning) or gathering a given arrangement of examples into disjoint groups. This is done with the end goal that examples in a similar group are indistinguishable and designs having a place with two unique bunches are extraordinary [1]. Clustering has been a broadly contemplated issue in an assortment of use areas including neural systems, AI, and measurement. Cluster examination partitions the information into gatherings (groups) that are important and helpful or both. On the off chance that important gatherings are the objective, at that point the groups should catch the normal structure of the information[2]. Now and again, in any case, group examination is just a valuable beginning stage for different purposes, for example, information outline.
There have been numerous utilizations of group investigation to down to earth issues. We give some particular cases, sorted out by whether the reason for the clustering is understanding or utility. Clustering for Understanding Classes, or reasonably significant gatherings of articles that offer basic qualities, assume a critical part in how individuals dissect and portray the world. For sure, people are talented at partitioning objects into gatherings (clustering) and appointing specific articles to these gatherings (grouping). For instance, even generally youthful kids can rapidly mark the articles in a photo as structures, vehicles, individuals, creatures, plants, and so on. With regards to understanding information, groups are potential classes and cluster investigation is the analysis of procedures for consequently discovering classes. The accompanying are a few illustrations: a.Business
b.Atmosphere c.Science
d.Data Retrieval
e.Brain science and Medicine
Clustering for Utility Cluster examination gives a reflection from singular information articles to the groups in which those information objects live. Moreover, some clustering methods portray each group regarding a cluster model; i.e., an information question that is illustrative of alternate protests in the group. These cluster models can be utilized as the reason for various information investigation or information handling strategies. In this manner, with regards to utility, group examination is the analysis of systems for finding the most illustrative cluster models[3].
K-Means Clustering:
K-means clustering is freely acknowledging method. It is used when you have unlabeled data (i.e., data without described classes or social occasions).The objective of this calculation is to discover packages in the information, with the measure of get-togethers (relations) tended to by the variable K[4]. The check works iteratively to designate every datum point to one of K groups in context of the highlights that are given. Server farms are amassed in light of future closeness. Delayed consequences of K-Means are given below.
a. The centroid of the K gatherings, which can be used to name new data
b. Imprints for the arrangement data (each datum point is dispensed to a single pack)
Instead of portraying clusters before looking data, gathering empowers you to find and research the social occasions that have confined normally. The "Picking K" territory underneath delineates how the amount of social occasions can be settled. Each centroid of a bundle is a social event of feature regards which portray the consequent get-togethers. Taking a gander at the centroid incorporate weights can be used to subjectively interpret what kind of
social event each gathering addresses.This
introduction to the K-means gathering figuring covers:
a. Typical business circumstances where K-means is used
b.The methods drew in with running the count
DBSCAN:
DBSCAN is an outstanding information bunching calculation that is normally utilized as a part of information mining and machine learning. In view of an arrangement of focuses (how about we think in a bidimensional space, DBSCAN clusters together indicates that are close each other in view of a separation estimation (typically Euclidean separation) and a base number of focuses. It additionally checks as anomalies the focuses that are in low-thickness districts.
Parameters:
The DBSCAN calculation essentially requires 2 parameters:
1. Eps: the base separation between two focuses. It implies that if the separation between two focuses is lower or equivalent to this esteem (eps), these focuses are thought about neighbours.
2. MinPoints: the base number of focuses to shape a thick area. For instance, in the event that we set the minPoints parameter as 5, at that point we require no less than 5 focuses to frame a thick district.
Parameter estimation:
The parameter estimation is an issue for each datum mining assignment. To pick great parameters we have to see how they are utilized and have no less than an essential past information about the informational collection that will be utilized[5].
in view of the separation of the dataset (we can utilize a k-remove diagram to discover it), however all in all little eps esteems are ideal[6].
MinPoints: when in doubt, a base minPoints can be gotten from various measurements (D) in the informational index, as minPoints ≥ D + 1. Bigger esteems are normally better for informational collections with clamour and will shape more critical groups. The base an incentive for the minPoints must be 3, however the bigger the informational collection, the bigger the minPoints esteem that ought to be picked.
II.
RELATED WORK
A cluster refers to a little gathering of articles. Clustering is gathering those items into groups. So as to get the hang of grouping, it is essential to
comprehend the situations that prompt bunch diverse articles. Give us a chance to distinguish few of them. At the point when an accumulation of articles is given, we place objects into cluster in view of similitude.
Utilization of Clustering:
Grouping is used as a piece of the impressive number of fields. We can initiate a couple of musings from Example to consider package of grouping applications that we would have keep running over[7].
1. Gathering empowers publicists to improve their customer build and work in light of the goal domains. It empowers social occasion to people (according to different criteria's, for instance, status, and acquiring force) in perspective of their closeness from different points of view related to the thing under idea.
2. Clustering helps in conspicuous verification of social occasions of houses in light of their regard, type and geographical regions.
3. Clustering is used to inspect earth-shake. In perspective of the districts hit by a seismic tremor in a region, packing can help analyze the accompanying conceivable region where shake can happen.
As there are numerous conceivable calculations for managed grouping, our work focuses on the improvement of delegate based regulated clustering calculations. Delegate based clustering goes for finding an arrangement of k agent cases from the dataset that best describe the entire dataset. Clustering are made by appointing every case in the dataset to the nearest illustrative utilizing some separation metric. Following are the reasons that persuaded us to centre on agent based style grouping calculations.
• Representatives are very valuable for applications, for example, information outline, dataset altering to enhance classifiers, and class decay to enhance basic classifiers.
• Clustering calculations that limit bunch agents to objects having a place with the dataset investigate a littler arrangement space if contrasted and centroid– based grouping calculations, for example, the k- Means calculation.
•Representative-based grouping calculations are more powerful regarding anomalies.
• When utilizing group based clustering calculations, just a between case separate framework is required and no new separations must be registered, as it is the situation with k-implies.
• Furthermore, illustrative based calculations that utilization real dataset cases as group agents are more material when the information is spoken to by qualities that incorporate ordinal and ostensible compose information. For instance, the k-Means clustering calculation which utilizes centroids as agents (focuses in the information space), which won't not be real cases in the datasets, must be connected when the mean of the group is characterized, which isn't the situation for ordinal and ostensible qualities.
dissimilarity of the contingent likelihood of the assistant information and the distributional cluster delegates over the Voronoi areas that cover the essential information. Thus, Tishby presented the data bottleneck strategy. In light of this strategy, they proposed an agglomerative grouping calculation that limits shared data misfortune regarding class data (assistant information). Crafted by Tishby and of Sinkkonen is outfitted towards data recovery kind of utilizations. Our approach is apportioning based and is heuristic in nature.
There has, likewise, been some work that has some similitude with our examination under the heading of semi-regulated grouping. The current research on semi-administered clustering can be subdivided into 2 noteworthy gatherings: likeness based strategies and inquiry based techniques. Closeness based techniques make an adjusted separation work that joins the learning as for the ordered illustrations and utilize a conventional clustering calculation to group the information. Inquiry based techniques adjust the clustering calculation itself yet don't change the separation work. Cohn utilizes imperatives, marked information, to enable the calculation to take in a separation work. Besides, Basu examine deciding the most educational arrangement of imperatives to get enhanced clustering execution[8].
Xing take the grouped preparing illustrations and change those into limitations (indicates that are known have a place with various classes need a separation bigger than a given bound) and infer an altered separation work that limits the separation between focuses in the dataset that are known to be comparable regarding these requirements utilizing established numerical techniques. The K-implies grouping calculation in conjunction with the changed separation work is then used to register bunches. Klein proposes a most limited way calculation to alter a Euclidian separation work in view of earlier information. Demiriz propose a developmental grouping calculation in which arrangements comprise of k centroids and the target of the hunt procedure is to acquire clusters that limit (the whole of) group
scattering and bunch contamination. Cohn adjusts the prevalent EM calculation so it is fit for fusing likeness and disparity imperatives.
K-Means Algorithm:
a) Place K centres into the space addressed by the articles that are being gathered. These concentrations address early on social events of centroids[9].
b)Allot eachdissent mean to cluster and get all remaining values close to the centroid.
c)Sums of all objects have been doled out at this point. Then, recalculate the spots of all K centroids.
d) Repeat the Steps „b‟ and „c‟ until the centroids never again move. This shows the division of articles into clusters.
Fig1 Clustering groups of K-means algorithm clustering
DBSCAN algorithm steps:
DBSCAN requires two parameters:
ε (eps) and the base number of centres required to outline a group (minPts)[10].
a)Start with a self-assertive starting stage that has not been seen.
b) Extract the region of this point using ε (All concentrations which are inside the ε expel are neighbourhood).
c) If there is sufficient neighbourhood around this point by then clustering process starts. And the point is separate as went to else this named as clatter (Later this point can transform into the bit of gatherings).
d)If a point is seen to be a bit of the group then its ε neighbourhood is in like manner. The bit of the clustering and the above system from organize 2 is reiterated for all ε neighbourhoodcentres. This is reiterated until all points are concentrated into the groups.
e) Another unvisited point is recuperated and arranged, inciting the disclosure of further cluster and noise.
f) This technique continues until the point that all concentrations areseparated.
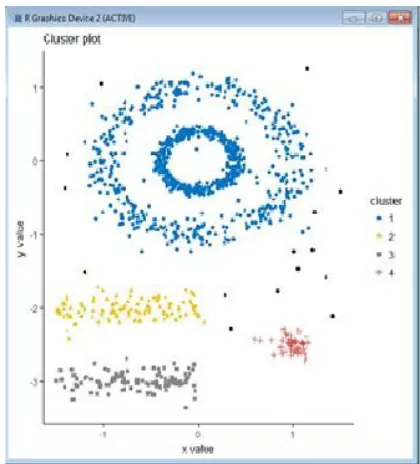
Fig 2. Density based clustering shows multiple clusters with different shapes
Fig 2. Density based clustering shows multiple clusters with different shapes
Showing chart for density based grouping need a few parts which resemble eps esteem, minPts. So we need to specify number of clusters at first. Most brief separation found through Euclidian formulae and it gives consummate esteem.
Optimal Eps value Graph for Density based Clustering:
Value determination of optimal eps (ε):
a)The system proposed here includes preparing for k- nearest neighbour expels in a system of core interests.
c)These k-divisions are plotted in climbing demand. The fact of matter is to choose "knee", which analyzes the perfect eps parameter.
d) A knee identifies with a point of confinement where the sharp change occurs along the k-isolate twist.
Fig 3. Displaying the graph for clusters with respect to their sorted distance and epsilon value
In this examination, a calculation DBSCAN was received is to utilize single-level density to decide the ideal esteem Eps with the goal that exclusive deliver one esteem Eps alone. The incline of the line is situated at the purpose of 0.25, a point which is the ideal esteem Eps. Clustering process is effectively executed from the indexed lists of DBSCAN alteration. We acquire the Eps ideal esteem consequently with the possibility of k-dist plot bringing about the age of parameters Eps = 0.25 and MinPts = 6. This parameter is utilized for clustering forms that create diverse clusters with anomaly focuses. The benefit of this strategy is that the ideal Eps esteem can be resolved consequently.
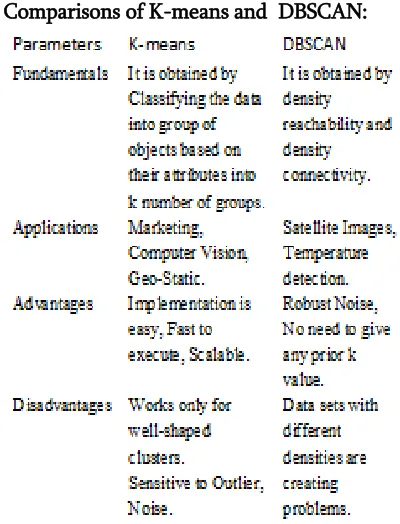
Comparisons of K-means and DBSCAN:
Table1 Showing difference of K-means and DBSCAN
III.
CONCLUSIONS
In this paper we took a shot at k-means technique and density based clustering process with the assistance of R tool. K-means clustering is utilized unsupervised machine learning methods for separating a given dataset into k clusters. Here, k speaks to the quantity of clusters and should be given by the client. To conquer this issue we utilized Clustering method based on density. In this method, clusters are determines the dense areas of information focuses isolated by low-density areas. Density is estimated by the quantity of information focuses inside some range. It doesn't require the number of predefined clusters. Clusters can be any shape, including non-round ones; the system can recognize information of noise (anomalies). In future we work on different components of density based clustering algorithm.
IV.
REFERENCES
[1]. Lefait, G. and Kechadi, T, (2010) “Customer
Segmentation Architecture
ICDS‟10, Fourth International Conference, 10- 02-2010.
[2]. Fraley, Andrew, and Thearting, Kurt (1999). Increasing customer value by integrating data mining and campaign management software. Data Management, 49–53.
[3]. P. Bhargavi and S. Jyothi, (2009) “Applying Naïve Bayes Data Mining Technique for Classification of Agricultural land Soils” IJCSNS International Journal of computer Science and Network Security, VOL. 9 No.8, August 117- 122.
[4]. Zhang T., Ramakrishnan R., and Linvy M. 1997. “BIRCH: An Efficient Data Clustering Method for Very Large Databases”. Data Mining and Knowledge Discovery 1(2): 141-182.
[5]. Ng R.T., and Han J. 1994.“Efficient and Effective Clustering Methods for Spatial Data Mining”.Proc. 20th Int. Conf. on Very Large Data Bases. Santiago, Chile, 144-155.
[6]. Kaufman L., and Rousseeuw P.J. 1990. “Finding Groups in Data: an Introduction to Cluster Analysis”. John Wiley & Sons.
[7]. Hattori K. and Torii Y.: 1993. “Effective algorithms for the nearest neighbour method in the clustering problem”. Pattern Recognition, 26(5): 741-746.
[8]. Fayyad U., Piatetsky-Shapiro G., and Smyth P. 1996. “Knowledge Discovery and Data Mining: Towards A Unifying Framework”.Proc. 2nd Int. Conf. on Knowledge Discovery and Data Mining, Portland, OR, 82-88.
[9]. Ester M., Kriegel H.-P., Sander J. and Xu X.
1996. “A Density-Based Algorithm for
Discovering Clusters in Large Spatial Databases with Noise”.Proc. 2nd Int. Conf. on Knowledge Discovery and Data Mining. Portland, OR, 226- 231.