Original Research Article
A study of anthropometric parameters of school children:
a cross sectional study in Rajasthan
Kedar Jayant Raikar
1*, Anis Maaheraa
2, Sumit Sobti
2INTRODUCTION
The anthropometric analysis is an effective tool for physician for the assessment of nutritional status, growth and development of children.1 Decision making and planning in child health nutrition should be based on valid assessment on updated growth charts. The growth chart reference is a need of time since it’s a fact that, children worldwide have become taller and heavier.2,3 Several Indian studies tried to establish reference standards for Indian children but the data was almost a decade old.4,5 Agarwal et al, published the results of a large multi-centric survey of children from the upper socioeconomic strata (USES) conducted in 12 cities from
all regions of India in 1992, these data are now more than 2 decades old.6 In a study by Khadilkar et al documented a secular trend in the height and weight of schoolchildren but was based on a smaller sample size.7
We have analyzed the height, weight and BMI in 5 year-16 year age group in both schoolboys and schoolgirls. The percentile charts for BMI prepared and weight for age, height for age growth charts were made. The comparison with other four established studies was done to conclude with recommendations of our study. We present the reference growth charts and percentile charts of age and gender specific BMI based on 995 school children data representative of a public school.
ABSTRACT
Background: The ongoing research in the school health domain is necessary to understand the secular trends in anthropometric parameters. Our study is an attempt to analyze the cross sectional findings and comparison with national reference studies to draw a conclusion on changing attributes of anthropometric parameters with time.
Methods: The present study was adapted as a school based, cross sectional, observational epidemiological study design. We have analyzed the data generated out of assessment of height and weight (anthropometric analysis) along with other evaluation as a part of comprehensive health examination.
Results: We evaluated, a total of 995 students, aged 5-16 years of which, 569 (57.2%) were boys and 426 (42.8%) were girls. BMI percentiles were calculated for both schoolboys and schoolgirls. Comparisons of the present height and weight curves with earlier data from India and multi country data from WHO was done. In this study prevalence of overweight was 10.35% which indicates the rising trends of childhood overweight and obesity.
Conclusions: The trends of changing anthropometric measurements as evident in our study indicate the schoolchildren are growing taller and heavier. With increase in BMI, the prevalence of childhood overweight is on high level but level of underweight and under nutrition per say is low, probably due to quality food availability and increased buying capacity of families.
Keywords: Secular trend, Anthropometry, BMI percentiles, Childhood obesity, WHO
1Deputy Assistant Director of Health, Alwar, Rajasthan, India 2
Medical officer, Field Hospital, Rajasthan, India
Received: 22 December 2018
Revised: 28 February 2019
Accepted: 01 March 2019
*Correspondence:
Dr. Kedar Jayant Raikar, E-mail: [email protected]
Copyright: © the author(s), publisher and licensee Medip Academy. This is an open-access article distributed under the terms of the Creative Commons Attribution Non-Commercial License, which permits unrestricted non-commercial use, distribution, and reproduction in any medium, provided the original work is properly cited.
Aim
Our study aims at understanding of anthropometric parameters (height, weight and BMI) across the school children in 5-16 years age group.
METHODS
This study is a cross sectional observational type analyzed on the data generated while annual medical examination of schoolchildren in Alwar, Rajasthan during the month of October 2018.
All the school children were included for data analysis as a universal sampling technique. As a result of data analysis on routine practice of medical examination and non-interventional study design, the ethical approval was not warranted.
The annual medical examination of school students is a routine practice under the school health activity. We analyzed the data generated out of assessment of height and weight, along with other evaluation as a part of comprehensive health examination.
The nursing assistants were trained by the co-investigator medical officer in the correct procedure and measurement of anthropometric data at the start of the examination. With portable wall mounted stadio-meter, Height was measured to the nearest 0.1 cm with the student standing straight with the head held in the Frankfurt horizontal
plane. The student’s weight, without shoes and while wearing uniform, was measured to the nearest 0.1 kg, on an electronic scale. The mean height and mean weight was used for each measurement taken twice and used for calculation of BMI, which was defined as the ratio of body weight (in kg) to body height (in metres) squared (kg/m2). Daily, the scale and stadio-meter were calibrated with standard weight and height, respectively.
The data recorded on a pro-forma used for school medical examination was entered in statistical software SPSS version 20. The Chi square test of association was used; percentile charts and smooth curves were created as an analytical tool. The median height and weight charts were prepared and compared with National reference of four established studies.
We had established the BMI percentiles for schoolchildren based on which the childhood overweight assessment can be done for students.
RESULTS
We evaluated, a total of 995 students, aged 5-16 years of which, 569 (57.2%) were boys and 426 (42.8%) were girls (Table 1).
The Table 1 shows that the percentage of overweight schoolchildren is significantly more than that of percentage of underweight schoolchildren.
Table 1: Comparison of BMI among school children (n=995). Normal N (%) Overweight N (%) Underweight N (%) Total N (%)
Boys 474 (83.3) 48 (8.4) 47 (8.3) 569 (100)
Girls 326 (76.5) 55 (12.9) 45 (10.6) 426 (100)
Total 800 (80.4) 103 (10.4) 92 (9.2) 995 (100)
Pearson Chi-Square= 7.502 df=2 (p=0.02).
Table 2: Age and BMI percentiles for schoolboys (n=569).
Age Percentiles
5 10 25 50 75 90 95
BMI
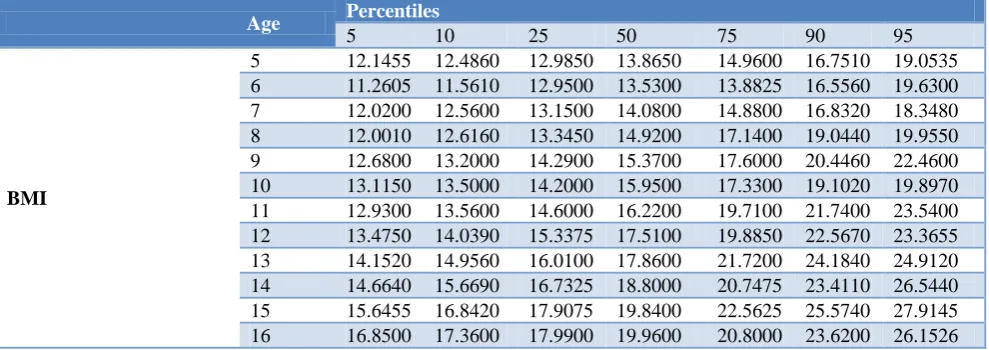
Table 3: Age and BMI percentiles for schoolgirls (n=426).
Age Percentiles
5 10 25 50 75 90 95
BMI
5 11.9390 12.2940 12.8500 13.8800 15.2400 17.6420 20.5530 6 10.9300 11.3220 12.1175 13.1500 15.7975 16.2400 18.3651 7 11.9400 12.2660 12.8025 14.2000 15.3350 17.1530 17.7425 8 11.6750 11.9850 12.7750 13.6900 15.6425 19.2600 20.0225 9 11.7650 12.9240 14.1150 15.1750 16.5300 17.9280 19.6890 10 12.3490 12.5240 13.8350 15.7700 18.5100 19.8710 21.3760 11 13.0540 13.8260 14.3500 15.8200 18.6400 21.1460 23.0490 12 12.9150 13.3530 14.8650 16.2300 18.2950 20.7120 24.9605 13 14.0100 14.6900 16.5600 18.2600 20.3400 23.5540 24.4860 14 15.7100 16.1990 17.9650 20.1600 22.0225 26.2650 26.7530 15 16.7985 18.1180 18.7525 20.2450 21.1300 25.3340 27.3475 16 15.2100 15.9020 17.9700 21.4800 24.0350 28.0820 28.2350
BMI percentiles were calculated for both schoolboys and schoolgirls, showed in Table 2 and 3.
DISCUSSION
In view of changing growth patterns as evident by previous studies.1 The reference growth charts needs to be updated regularly.
In India, a secular trend in anthropometric parameters is evident from scattered regional reports spanning the past 3–4 decades.4-8
The recent approach of national growth chart efforts was taken in the study by Raman et al data of which is 08 years old (2011).8
Thus there was a need to analyze school medical exam data for anthropometric evaluation and comparison with all standard reference data of these studies.2,4-8
The 50th percentile of height for both boys and girls was significantly higher in our study compared not only with that reported nearly decades ago by Agarwal et al but also with the more recent data from Khadilkar et al and Raman et al.6-8 In case of girls, the median height was consistently higher than that reported by Agarwal et al 6 and Raman et al8 across all age groups.
Similarly, in comparison with the data reported by Khadilkar et al, Raman et al the median height of girls in our study was higher till the age of 12-13 years, after which the difference was marginal.8 The earlier flattening of the growth curve of girls compared with that in the study by Khadilkar et al could be due to their higher weights leading to earlier puberty/pubertal spurt and consequently earlier epiphyseal closure.
The median height of boys in our study was similar or more than that reported in the multi-country WHO study
(2006) and Indian studies till the age of 10 years.2,6-8 In the older age groups, the median height in the WHO study was between 3 cm and 5 cm more than that reported by us. Similarly, even in girls, the median height in our study was more than that in the WHO study till the age of 13 years, following which the median heights reported in the multi-country study were more by up to 4–5 cm. The better height performance of younger boys and girls could probably be explained by improved nutrition consequent to India’s economic growth over the past few decade.
A similar trend was also observed for weight percentiles in all age groups and both sexes, when we compared our data with that from earlier Indian studies. In comparison with data from Agarwal et al,the median weights in our study, in both sexes and across all age groups, were significantly more.6 This difference became marked (>5 kg) after the age of 9-10 years. This trend was also observed when comparing data from Khadilkar et al and Raman et al though the difference in weight was less marked.7,8
Even the 5th centiles of BMI across all ages and both sexes were higher than that reported by Khadilkar et al and Indian studies.6-8 This comparison of weight and BMI between the present and earlier Indian studies clearly indicates secular trends in childhood obesity, which are prominent in both sexes.
Figure 1: Comparison of median heights for age among school boys.
htboy: our study; agarwhtboy: Agarwal et al; WHOhtboy: WHO; Khadlhtboy: Khadilkar et al; Ramanhtboy: Raman et al.
Figure 2: Comparison of median weight for age among school boys.
Wtboy: our study; agarwtboy: Agarwal et al; WHOwtboy: WHO study; Khadlwtboy: Khadilkar et al; Ramanwtboy: Raman et al.
Figure 3: Comparison of median height for age among school girls.
Figure 4: Comparison of median weight for age among schoolgirls.
wtgirl: our study; agarwtgirl: Agarwal et al; WHOwtgirl: WHO study; Khadlwtgirl: Khadilkar et al; Ramanwtgirl: Raman et al.
In the study by Seema et al in a field practice area, the prevalence of underweight was 48.14% while in our study it was 9.24%.10 This difference and low percentage of underweight probably be explained with adequate family ration drawing facility for troops in Armed forces. The prevalence of overweight/obesity in a study was 7.83% while in our study it was found 10.35% which indicates the rising trends of childhood overweight and obesity.10
This study was a cross sectional analysis of school medical examination data which is representative of school children of public schools only, hence the results cannot be extrapolated to entire school children cohort of population. Since we had only performed the analysis of data generated out of school medical examination at public school, the factors affecting overweight and obesity could not be studied.
CONCLUSION
The cross sectional findings of anthropometric measurements as evident in our study indicate the schoolchildren were grown taller and heavier as compared with other well established studies. With increase in BMI, the prevalence of childhood overweight is on high level but the level of underweight and under nutrition per say is low, probably due to increased buying capacity of families.
Recommendations
We recommend the ongoing research in this area of interest at other schools.
This study can be useful to formulate strategies for prevention of childhood obesity which is on rising trend, compared to recently available results of other studies.
Funding: No funding sources Conflict of interest: None declared
Ethical approval: The study was approved by the Institutional Ethics Committee
REFERENCES
1. Cameron N. The methods of auxological anthropometry. In: Falkner F, Tanner JM (eds). Human growth—A comprehensive treatise. Vol. III. 2nd ed. New York: Plenum Press; 1986: 3–46. 2. WHO Multicentre Growth Reference Study Group.
Assessment of differences in linear growth among populations in the WHO Multicentre Growth Reference Study. Acta Paediatr Suppl. 2006;450:56–65.
3. Davies PS. Growth charts for use in Australia. J Paediatr Child Health. 2007;43:4–5.
4. Thakor HG, Kumar P, Desai VK, Srivastava RK. Physical growth standards for urban adolescents (10–15 years) from South Gujarat. Indian J Community Med. 2000;25:4–6.
5. Tripathi AM, Sen S, Agarwal KN, Katiyar GP. Weight and height percentiles for school children. Indian Pediatr. 1974;11:811–5.
6. Agarwal DK, Agarwal KN, Upadhyay SK, Mittal R, Prakash R, Rai S. Physical and sexual growth pattern of affluent Indian children from 5–18 years of age. Indian Pediatr. 1992;29:1203–82.
7. Khadilkar VV, Khadilkar AV, Cole TJ, Sayyad MJ. Cross-sectional growth curves for height, weight and body mass index for affluent Indian children, 2007. Indian Pediatr. 2009;46:477–89.
9. Bhatia V. IAP National Task Force for Childhood Prevention of Adult Diseases: Insulin resistance and type 2 diabetes mellitus in childhood. Indian Pediatr. 2004;41:443–57.
10. Seema P, Damayanthi MN. Nutritional status determined by anthropometric measurement among rural school children aged between (6-18 years)
using WHO Z-score in our field practice area. Int J Community Med Public Health. 2018;5(4):1424-7.