https://doi.org/10.5194/jsss-6-247-2017
© Author(s) 2017. This work is distributed under the Creative Commons Attribution 3.0 License.
Scanning method for indoor localization using
the RSSI approach
Ahmad Warda1, Bojana Petkovi´c2, and Hannes Toepfer1
1Technische Universität Ilmenau, Institute for Information Technology, Ilmenau, Germany 2Technische Universität Ilmenau, Institute of Biomedical Engineering and Informatics, Ilmenau, Germany
Correspondence to:Ahmad Warda ([email protected])
Received: 19 December 2016 – Revised: 10 April 2017 – Accepted: 27 April 2017 – Published: 20 June 2017
Abstract. This paper presents a scanning method for indoor mobile robot localization using the received signal strength indicator (RSSI) approach. The method eliminates the main drawback of the conventional fingerprint, whose database construction is time-consuming and which needs to be rebuilt every time a change in indoor environment occurs. It directly compares the column vectors of a kernel matrix and signal strength vector using the Euclidean distance as a metric. The highest resolution available in localization using a fingerprint is restricted by a resolution of a set of measurements performed prior to localization. In contrast, resolution using the scan-ning method can be easily changed using a denser grid of potential sources. Although slightly slower than the trilateration method, the scanning method outperforms it in terms of accuracy, and yields a reconstruction error of only 0.08 m averaged over 1600 considered source points in a room with dimensions 9.7 m×4.7 m×3 m. Its localization time of 0.39 s makes this method suitable for real-time localization and tracking.
1 Introduction
Wireless indoor mobile robot localization is a challenging problem and has gained wide attention in the research com-munity (Huang et al., 2016). Location information is es-sential for the robot to complete the tasks. In many mo-bile robot applications, especially in the industry, high local-ization and positioning accuracy are required (Zhang et al., 2014; Röwekämper et al., 2012). Domestic robots and auto-mated guided vehicles (AGV) are examples of mobile robots used inside homes and in the industry, respectively. When a mobile robot does not follow a predefined path, a real-time tracking is necessary. This process can be seen as a sequen-tially performed localization of a moving robot. Wireless sensor networks (WSNs) are usually used to perform track-ing (Zhang et al., 2014) and received signal strength indicator (RSSI) is the most used signal property in wireless indoor lo-calization (Farid et al., 2013). In this paper, we address the problem of indoor mobile robot localization and tracking us-ing WSNs.
Many algorithms exist to estimate a robot location in an indoor environment. Fingerprint is a popular approach used for this purpose. It can provide a highly accurate localization;
de-grade the quality of trilateration (Yang and Liu, 2010). For improved indoor localization based on trilateration, a tech-nique based on particle filter can be used (Hsu et al., 2016). Finally, the two localization techniques, fingerprint and tri-lateration, could be integrated (Kodippili and Dias, 2010).
In this paper, we propose a new fast localization scheme based on fingerprint using the RSSI approach. The method has two major contributions to indoor robot localization: first, it does not require offline acquisition, saving a lot of time and manpower, and providing the same accuracy as fingerprint. Second, it outperforms the standard trilateration method, showing lower localization error in a noisy indoor environment. The paper is organized as follows: Sect. 2 de-scribes the problem, defines the forward model, and explains the mathematical background of the method. Section 3 re-ports the evaluation results of the proposed scanning method with respect to fingerprint and trilateration. Finally, Section 4 concludes the paper and directs future work.
2 Methodology
2.1 Problem description and forward model
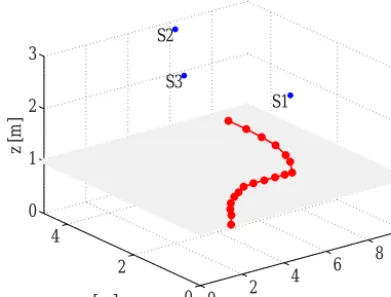
We observed a room with dimensions 9.7 m×4.7 m×3 m. In our simulations, we used radio transceiver AT86RF230 from Atmel (2009) with a working frequency of 2.4 GHz (Zig-Bee/IEEE802.15.4 applications). The transmitter antenna was simulated by the maximum output power of the trans-mitter of Pt= +3 dBm with a gain of Gt= −0.5 dBi. The gain of the receiving antenna was also set toGr= −0.5 dBi. A continuous path of the transmitter was presented by 18 positions equidistantly placed with a step of 0.5 m at 1 m height (Fig. 1). We placed three receivers at the ceiling of the room to eliminate obstructions from furniture or other objects. The receivers’ positions were given by the following coordinates: S1 (4.85 m,0.35 m,3 m), S2 (5.7 m,4.35 m,3 m) and S3 (2.95 m,2.35 m,3 m) and shown in Fig. 1. The re-ceived signal power Pr at receiver positionRi is related to
the power of transmitter Pt at position rj according to the
forward model (Eq. 1), assuming a direct path between the receiver and the transmitter and no signal interference occur-rence (Garg, 2007):
Pr=Pt λ
4π r 2
GrGt, (1)
where r=Ri−rj
represents the distance between the transmitter and the receiver; λis the wavelength of propa-gation and Gr andGt are the gains of the receiver and the transmitter antenna, respectively. We composed a kernel ma-trix of dimensions n×maccording to the forward model (Eq. 1):
L= λ
4π
2
GrGt
1 (R1−r1)2
1 (R1−r2)2
1
(R2−r1)2 .
. .
. .
. .
1 (Rn−1−rm−1)2
1 (Rn−rm−1)2
1 (Rn−rm)2
n×m
, (2)
wherencorresponds to the number of receivers andm corre-sponds to the number of discrete source points that the trajec-tory of the transmitter is modeled with. We assigned to these points the same transmitted power at m discrete moments τj,j =1,. . .,m. Then, we introduced a vector of
transmit-ted signal strengthsPt(τ)= [Pt1(τ)Pt2(τ). . . Ptm(τ)]T of di-mensions m×1, where Ptj=Pt·δ(τ−τj), j=1, . . ., m.
SuperscriptT indicates the vector transpose. A Dirac delta function is denoted byδ(τ−τj), wherej indicates a source
point where the transmitted antenna is placed along its path at the momentτj. Now, we can simulate a vector of received
power strengths as
Pr(τ)=L·Pt(τ) (3)
wherePr(τ)= [Pr1(τ)Pr2(τ). . . Prn(τ)]T is of dimensions n×1 andndenotes the number of receivers. We are aware that the model (Eq. 1) and the corresponding kernel matrix (Eq. 2) are, to some degree, imperfect and should be calcu-lated taking into account major obstacles that appear in the room. However, an accurate model requires perfect knowl-edge of the environment and such a model would lack gen-erality and reusability. For this reason, our approach is pre-sented on a simple RSSI localization model.
2.2 Scanning method
First, we introduced discretization over the source space at 1 m height, defining the total number of possible source points as M. The density of the source points depended on the accuracy one wants to achieve. We defined anM×
1 column vector of transmitted signal strengths Pt(τ)=
[Pt1(τ)Pt2(τ). . . PtM(τ)]T for all discrete momentsτ =τj,
j=1,. . .,m, which models a continuous path of the source antenna. Knowing the receiver position vectorsRi,i=1,. . .,
N, a kernel matrixLN×M is composed according to Eq. (2).
The simulated power strength is already obtained using the Eq. (3).
In general, an inverse problem involves estimation of the source vector distributionPt(τ) from the measurement vec-torPr(τ). Because we have an isolated source, we are not required to solve the whole system of linear equations and find the distribution ofPt(τ) over the whole source space. Instead, we can calculate the similarity or distance between the column vectorscj(τ),j =1, . . .,Mof the kernel matrix
LN×Mand the received power strength vectorPr(τ), for all discrete momentsτ =τj,j=1, . . .,m. In the following text,
0 2
4 6
8
0 2 4 0 1 2 3
z [m]
S1 S2
S3
x [m] y [m]
Figure 1.Three receivers are placed at 3 m height, shown as blue
points. The path of the moving transmitter (18 positions) is shown as red points, joined by a red solid line. The plane of the moving transmitter is discretized in 40×40 source locations shown in grey.
0 2 4 6 8
0 1 2 3 4
S1 S2
S3
x [m]
y [m]
0 2 4 6 8
0 1 2 3 4
S1 S2
S3
x [m]
y [m]
(a) (b)
Figure 2.Path reconstruction using the scanning method and
fin-gerprint(a)and trilateration(b)for noise-free simulations.
As a similarity metric between vectors, the cosine between the measurement vector and the columns of a kernel matrix has usually been used (Shi, 2015; Chakraverty, 2014; Berry and Kogan, 2010). However, this measures the similarity of vectors with respect to the origin, and it is not influenced by one magnitude being small compared to the other. This can easily lead to wrong reconstruction because vectors that greatly differ in amplitude can have a very high cosine sim-ilarity. Therefore, we used the Euclidean distanced2(cj,Pr) between the column vectors of a kernel matrix cj and the
simulated power strength vectorPr d2(cj,Pr)=
cj−Pr
2, j=1, . . ., M, (4) where|| · ||2denotes the Euclidean norm. The location of the sourcejˆis assigned to the indexj corresponding to the min-imal Euclidean distanced2to the vectorPr, that is,
ˆ
j =arg min
j
d2(cj,Pr). (5)
Because we calculated column-by-column the degree of similarity to the measurement vector Pr and in a way scanned the whole source space, we referred to this as a scan-ning method.
0 2 4 6 8
0 1 2 3 4
S1 S2
S3
x [m]
y [m]
0 2 4 6 8
0 1 2 3 4
S1 S2
S3
x [m]
y [m]
(a) (b)
Figure 3.Path reconstruction using the scanning method and
fin-gerprint(a)and trilateration(b)for noisy simulation data.
Table 1.Comparison of reviewed localization methods in terms of
time and mean reconstruction error for noise-free simulations.
Scanning Trilateration Fingerprint method
Time per localization (s) 0.375 0.304 2.779 MRE (m) 0.0999 0 0.0999
3 Results and discussion
The quantitative evaluation of the scanning method is per-formed for the problem setup described in Sect. 2.1 by com-paring with the trilateration and fingerprint methods. The methods are compared with respect to the time required for the source localization and the mean reconstruction error (MRE) defined as
MRE= 1
m
m
X
i=1
|rrec−rreal| (6)
whererrecandrrealdenote the position vectors of the recon-structed and real simulated sources, respectively. The corre-sponding simulations have been done for two cases: noise-free simulated data and data with additive white Gaussian noise (AWGN). A discretization of the source space has been made using a step of 0.24 m in thex direction and 0.12 m in they direction, providing 40×40 considered source loca-tions. Due to a kernel matrixLof dimensions 3×1600, our problem is extremely underdetermined. A path of the trans-mitter is simulated by 18 discrete positions marked by red points connected by a red solid line (Fig. 1).
3.1 Noise-free simulation
Comparison of different algorithms is performed on the same noise-free data set. Table 1 shows the time required for one localization and mean reconstruction error MRE averaged over 18 discrete points simulating the path of the source, in the application of the scanning method, trilateration, and fin-gerprint.
Table 2.Comparison of reviewed localization methods in terms of time and mean reconstruction error over 10 000 simulation runs un-der the noisy conditions.
Scanning Trilateration Fingerprint method
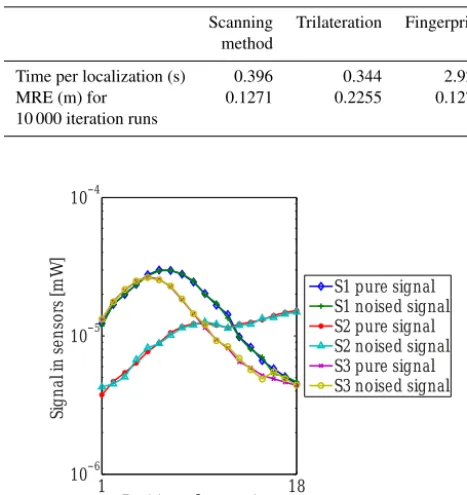
Time per localization (s) 0.396 0.344 2.920 MRE (m) for 0.1271 0.2255 0.1271 10 000 iteration runs
1 18
10−6 10−5 10−4
Position of transmitter
Signal in sensors [mW]
S1 pure signal S1 noised signal S2 pure signal S2 noised signal S3 pure signal S3 noised signal
Figure 4.Noise-free signals and signals with additive white
Gaus-sian noise simulated at the positions of three receivers (S1, S2, and S3) and presented in logarithmic scale.
Fingerprint provides the same MRE as the scanning method, requiring, however, much more time, that is, 2.779 s per one localization. This time consumption is expected because a fingerprint database has to be built in offline mode, prior to localization. Furthermore, a fingerprint database needs to be rescanned and updated, because it is influenced by any change in the environment (e.g., furniture position). In con-trast to fingerprint, the scanning method does not require any database and allows for real-time localization. The scanning method can be seen as a kind of fingerprint method with only online mode.
Trilateration performs best in the case of noise-free simu-lations, accurately localizing the source position within only 0.304 s. However, a noise-free setting is not sufficient be-cause perfect noise-free measurements are never available. Therefore, a noisy system has to be analyzed. A source path reconstructed using the scanning method coincides with the path obtained by fingerprint (Fig. 2a). Source localization us-ing trilateration is shown in Fig. 2b.
Note that besides the Euclidean distance (Eq. 5), we have also used a cosine metric as proposed in Zhang et al. (2015) as a similarity metric between the column vectors of a ker-nel matrix and the simulated power strength vector. However, this metric performed worse than the Euclidean distance and these results are not shown in the paper. The reason is that
x [m]
y [m]
0 2 4 6 8
0 1 2 3 4
0 0.2 0.4 0.6 0.8 1
x [m]
y [m]
0 2 4 6 8 0
1 2 3 4
0.5 1 1.5 2 2.5 3
(a) (b)
Figure 5.Distribution of the reconstruction error (RE) in the room
under noisy conditions and SN R=103 dB using the scanning method(a)and trilateration(b). The unit of the color bar is meters.
two vectors can be similar in terms of the angle between them, but they can differ greatly in amplitude. Therefore, the Euclidean distance turned out to be superior over the cosine metric in the application of the scanning method.
3.2 Simulation with AWGN noise
To analyze the performance of the scanning method under the effect of noise, we added an additive white Gaussian noise (AWGN) to the simulation data. The signal-to-noise ra-tio SNR was taken according to the data sheet of transceiver AT86RF230 from Atmel (2009), with RSSI minimal sen-sitivity of −91 dBm. Considering a transmitted power of Pt= +3 dBm, an SNR value of 103 dB was used.
Time requirements per one localization and mean recon-struction error applying the scanning method, trilateration, and fingerprint under the same noisy conditions are given in Table 2. Trilateration performed best with respect to the time (0.344 s) needed for one localization; however, it showed the largest mean reconstruction error of 0.2255 m. Localization accuracy was significantly better in the case of the fingerprint and scanning method, showing the mean value of 0.1271 m averaged over 18 discrete source positions simulating the tra-jectory and 10 000 iteration runs simulating the data with white Gaussian noise. In terms of time, the scanning method outperformed fingerprint, requiring 0.396 s per one source lo-calization compared to 2.920 s. This high time consumption makes the fingerprint method inappropriate for real-time tar-get tracking in a dynamical environment like the industry.
Reconstructing paths, relying on noisy data, and applying the scanning method and the fingerprint are shown in Fig. 3a. Figure 3b shows the path reconstruction under the same noise conditions applying the trilateration. One example of noise-free data and data with Gaussian white noise at receiver po-sitions is presented in the logarithmic scale in Fig. 4.
As a final stage, we assessed the robustness of the scanning method through the distribution of the reconstruction (lo-calization) error in the whole room RE=PM
added white Gaussian noise with SNR=103 dB. The distri-butions of the localization error using the scanning method and trilateration are shown in Fig. 5. The unit of the color bar in Fig. 5 is meters. The results in Fig. 5 show that the scanning method exhibits superior performance, and mean localization error is 0.0838 m over 1600 source points con-sidered in the room, with the maximal error value at 1.113 m. By contrast, the mean reconstruction error using trilateration was 0.3066 m, even showing a maximum of 3.345 m.
The computations were performed with MATLAB2014a on a computer with a CPU (Intel Core i5-3470, 3.2 GHz) and 16 GB of RAM.
4 Conclusions
We studied the problem of wireless indoor mobile robot lo-calization and tracking using noise-free data and data with additive white Gaussian noise at three receiver positions. We proposed a new scanning method to overcome the drawbacks of fingerprint, which includes time-consuming construction of a database and its need for rebuilding every time a sig-nificant change in the environment occurs. Moreover, local-ization in a noisy environment using the scanning method shows a lower error compared to the traditional trilateration. Low computational costs and high accuracy, without the need for a database, make this scanning method a powerful tool for indoor object localization and tracking. Further work will explore 3-D variants of the scanning method using the mea-sured data sets.
Data availability. Data used for transceiver AT86RF230 from
Amtel (2009) are available at http://www.atmel.com/images/ doc5131.pdf.
Competing interests. The authors declare that they have no
con-flict of interest.
Acknowledgements. We would like to thank Roland Eichardt
from the Institute of Biomedical Engineering and Informatics at the Technische Universität Ilmenau for the scientific discussions, and also the anonymous reviewers for their critical points, which helped us improve the paper.
Edited by: R. Morello
Reviewed by: two anonymous referees
References
Atmel: AT86RF230, Atmel, available at: http://www.atmel.com/ images/doc5131.pdf (last access: 28 March 2017), 2009. Berry, M. W. and Kogan, J.: Text Mining: Applications and Theory,
Wiley, 2010.
Chakraverty, S.: Mathematics of Uncertainty Modeling in the Anal-ysis of Engineering and Science Problems, IGI Global, 2014. Farid, Z., Nordin, R., and Ismail, M.: Recent advances in wireless
indoor localization techniques and system, Journal of Computer Networks and Communications, 2013.
Garg, V. K.: Wireless Communications & Networking, Elsevier Morgan Kaufmann, 2007.
Hsu, C.-C., Yeh, S.-S., and Hsu, P.-L.: Particle filter de-sign for mobile robot localization based on received sig-nal strength indicator, T. I. Meas. Control, 38, 1311–1319, https://doi.org/10.1177/0142331215586615, 2016.
Huang, X., Fan, J., Wu, M., and Gu, Y.: Indoor Mobile Robot Positioning Based on Wireless Fingerprint Matching, World Academy of Science, Engineering and Technology, International Journal of Computer, Electrical, Automation, Control and Infor-mation Engineering, 10, 1198–1202, 2016.
Kodippili, N. S. and Dias, D.: Integration of fingerprinting and trilateration techniques for improved indoor localiza-tion, in: 2010 Seventh International Conference on Wire-less and Optical Communications Networks – (WOCN), 1–6, https://doi.org/10.1109/WOCN.2010.5587342, 2010.
Ma, R., Guo, Q., Hu, C., and Xue, J.: An improved WiFi indoor positioning algorithm by weighted fusion, Sensors, 15, 21824– 21843, 2015.
Röwekämper, J., Sprunk, C., Tipaldi, G. D., Stachniss, C., Pfaff, P., and Burgard, W.: On the position accuracy of mobile robot localization based on particle filters com-bined with scan matching, in: 2012 IEEE/RSJ International Conference on Intelligent Robots and Systems, 3158–3164, https://doi.org/10.1109/IROS.2012.6385988, 2012.
Shi, Y.: Emerging Research on Swarm Intelligence and Algorithm Optimization, Hershey: IGI Global, 2015.
Yang, Z. and Liu, Y.: Quality of Trilateration: Confidence-Based Iterative Localization, IEEE T. Parall. Distr., 21, 631–640, https://doi.org/10.1109/TPDS.2009.90, 2010.
Zhang, A., Yuan, Y., Wu, Q., Zhu, S., and Deng, J.: Wireless Local-ization Based on RSSI Fingerprint Feature Vector, Int. J. Distrib. Sens. N., 11, 528–747, https://doi.org/10.1155/2015/528747, 2015.