A Statistical Analysis of the Influence of Multi-Stage
Hot-Drawing on the Overall Orientation of Biodegradable
Aliphatic-Aromatic Co-Polyester Fibers
Basel Younes1,4, Alex Fotheringham1, Hassan M. EL-Dessouky2,3, Ghassan Haddad4Heriot Watt University, Galashiels UNITED KINGDOM
2 Fibres Research Lab, School of Design, University of Leeds, UNITED KIINGDOM
3 Physics Department, Faculty of Science, Mansoura University, EGYPT
4 Faculty of Mechanical and Electrical Engineering, Damascus University, SYRIA
Correspondence to:
Basel Younes email: [email protected]
ABSTRACT
Biodegradable as-spun linear aliphatic-aromatic co-polyester (AAC) fibers were processed under a fractional factorial design as a function of hot-drawing conditions using appropriate experimental and statistical methodology. The multi-stage hot-drawing process and overall orientation of the biodegradable AAC fibers were characterized and statistically analyzed. The results obtained showed that the most effective and significant parameters influencing fiber overall orientation are the draw ratio and the drawing temperature. Birefringence is affected positively by draw ratio and plate temperature, and negatively by drawing temperature, the interaction between drawing stage and relaxation temperature, relaxation temperature and the interaction between draw ratio and spin finish. From results and analysis, a combination of factor levels was designed for controlling the birefringence of the material studied using the regression equations obtained. A new forecasting statistical model has been suggested for optimizing the drawing process effect. Such optimized (AAC) fibers could be used in agricultural, horticultural and other textile applications.
INTRODUCTION
Textile scientists, researchers and commercial companies are striving to be important players in the race to manufacture environmentally friendly products, and to be in an advanced stage in the waste management of synthetic products. The application of statistical methods and analysis models saves time and production process costs. The production of novel and biodegradable fibers from biomass feed stocks has been facilitated by biotechnology.
Biopolymer products are non-toxic, recyclable and biodegradable, and their biodegradability is influenced by the chemical structure of the polymer chains, crystallinity, chain orientation and other morphological properties [1].
Biodegradable aliphatic-aromatic co-polyester is biodegradable under certain conditions leaving no environmental footprint. Aliphatic-aromatic co-polyesters are made from petroleum and have stable physical and chemical properties [2]. The start of polyesters was in 1981[3]: aliphatic-aromatic co-polyester fibers were developed but they were not at that time biodegradable fibers. Aliphatic-aromatic co-polyesters are potential candidates to make staple fibers for various nonwoven materials particularly for expendable uses in medical [4-6] and agricultural applications [7-11].
As-spun fibers exhibit low tenacity and high elongation. After subsequent drawing the alignment of the molecular chains and the degree of crystallinity along the fiber axis are improved. As-spun or un-oriented fibers should have an easily drawn structure; each molecular chain is extended and orientated along the fiber axis in the hot drawing process. Crystallinity and orientation of finished fibers affect strength, elongation, moisture absorption, absorption resistance and dyeability [12, 13]. Theoretically, highly oriented fibers are highly crystalline but highly crystalline fibers are not necessary to be highly oriented [14].
orientation [15]. The spinning and drawing conditions of as-spun fibers are the main factors influencing both the structure and the properties of drawn fibers [16]. The drawing process results in highly oriented filaments with desired mechanical properties, pre-orientation and original structure of filaments [17]. Drawing tension is related to the stability of the process and the fiber texture as a function of drawing conditions. Drawing tension increases with reduction of drawing temperature or an increase of draw ratio. The presence of some unstable fibers can be related to machine faults, such as variations of drawing, feed velocity, temperature, guides or pins wearing out [18].
The relaxation of internal stress achieved by heating treatment improves fiber drawability [19]. Thermal stability in semi-crystalline fibers [20] is improved by applying the relaxation process under controlled tension. The internal tensions can be eliminated by readjustment of intermolecular chemical links and of the degree of crystallization [21]. Depending on the strong relationship between birefringence and molecular orientation the value of the measured birefringence reflects the overall orientation or the alignment of the fiber molecules around its axis.
Thermal properties should be considered in that stage to monitor any change in the structure behavior. If the effective glass transition temperature (Tg) is below the normal operational temperature, the crystallization will go to equilibrium very slowly [22]. Fiber diameter plays a role in crystallization during the drawing as it can remain the material warm for long periods.
Optimization and calibration are the most significant issues in any analytical methodology and quantification. The statistical software applies the statistical techniques for new product development [23, 24]. Statistical experimental design (SED) has the advantage of a one-step overall design in the development of process technology with known levels of confidence model. SED helps the engineering in designing the products and processes, developing the products and reducing the target value variation in processes [25]. The use of experimental design is still limited because of insufficient grounding, familiarity with home grown solutions, and lack of understanding of the statistical experimental design method [26]. The key point is how to apply those techniques to many applications for manufacturing a novel product; it helps the engineering by reducing the target value variation in processes.
In this study, SED is used to model the effects of hot-drawing process conditions on thermal properties and overall orientation of drawn AAC fibers. The responses of the statistical models derived will be explained scientifically by related theories and the knowledge of the influence of the parameters involved on the production process.
EXPERIMENTAL WORK Material
Fully biodegradable petroleum aromatic-aliphatic co-polyester based on butandiol, adipic acid and terephthalic acid was supplied by Rodenburg Company, Netherlands, to be used in this work. The polymer was in the form of spherical granule resin in diameter 3-5 mm and of density of 1.2 g/cc. AAC can be melted in the temperatures range (110 - 115 oC). The material is referred to reference [27] as: benzenedicarboxylic acid, polymer with 1,4-butanediol and hexanedioic acid. The supplier datasheet does not show the details related to copolymerization ratio; this is because it is a commercial sample. Due to the low water solubility and high molecular weight of the polymer, it is unlikely to bio-accumulate [28], no eco-toxicity data were submitted [29] and no significant toxicological effect was observed [30]. Spin finish oil, VICKERS 1031, was used in spinning and drawing processes.
Extrusion of As-Spun Fiber Sample by Melt Spinning
Multi Stage Hot Drawing of As-Spun Fibers
For technical experimental reasons, the spinning and drawing processes were operated individually. After the as spun fibers had been extruded, hot drawing was carried out on an ESL, Extrusion System Limited, multi stage draw frame (Figure 1). The frame consists of four hot rollers (160 mm), three hot plates (495×30 mm) mounted between the rollers, spin finish applicator and the winder. Drawing took place at temperatures above Tg and in the phase of so-called rubber-like. The spun fibers have low glass transition temperatures (-30 to -33 oC) and low drawing temperatures could be used in a narrow temperature range.
Drawability describes the ability of fibers to undergo several 100% permanent deformations, under load, at ambient or elevated temperatures and inherent dimensional instability. The as-spun fibers’ drawability value will play an important role in identifying the levels of hot drawing parameters in the fraction factorial experimental design matrix. At constant roller (drawing) speed and hot plate temperature; the draw ratio was increased gradually until the yarn eventually broke. Then the surface speed of both the feed and draw rollers were measured and the drawability was calculated as the ratio between surface speed of draw roller at break and the surface speed of feed roller at break.
FIGURE 1. Schematic diagram of the multi stage drawing frame.
Theoretically, there are solid-state (actual) draw ratio R and adjusted (machine) drawing ratio RD Eq. (1):
adjusted
V V R actual L L
R D
1 2
1
2
(1)
where V1= speed of the first drawing roll (m/min), V2 = speed of the second drawing roll (m/min), L1 =
fiber’s length before drawing, L2= fiber’s length after drawing.
The actual draw ratio is less than the nominal draw ratio because the draw line shrinks when tension is removed and yarn should not slip during drawing. In the case of non-linear viscoelastic behavior and a necking effect, the velocity is neither steady nor uniform, and so there is a kinematics problem of continuous drawing [18]. In the drawing process, orientation is improved, molecules may be pulled out of the lamellar crystals, and molecules in the amorphous regions are extended [35].
Differential Scanning Calorimetry (DSC)
A METTLER- TA Instrument DSC12E and METTLER –TOLEDO –TA89E System Software were used to determine the thermographic behavior of AAC fibers. The weight of the fiber specimen, from 5-10 mg, was measured in an aluminum pan to three decimal places. In the case of nitrogen gas, the software offers the DSC graphs (Heat flow/enthalpy curves) for the tested samples. Three replicates were scanned.
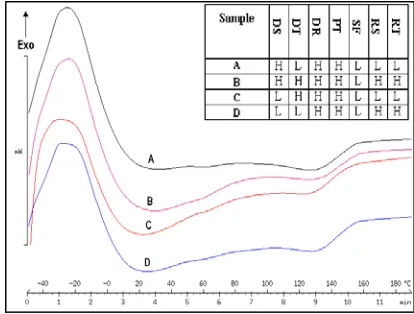
Figure 2 shows DSC curves for four selected samples, produced with different hot drawing conditions, which are listed on the right top of Figure 2. The exothermic direction is added to Figure 2, and the peak at -33 OC indicates the glass transition temperature Tg. A broad range of melting temperature (about 100-135°C) was observed for the fibers. According to the DSC results (Figure 2), the fiber does not melt completely below 120 0C, so an optimum temperature window was found taking all factors into account. No appreciable changes of the relative intensity of the endothermic peaks are observed in different samples for the same trial.
Orientational Birefringence of AAC Fibers
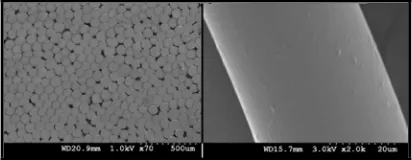
Before measuring fiber’s birefringence, the fiber’s surface and cross section shape were imaged using a scanning electron microscope (SEM). Figure 3 shows a SEM photomicrograph of a fiber surface and a cross section. The cross section has a round shape, as expected from the spinneret nozzles used and the spinning method.
FIGURE 3. SEM photomicrograph of AAC fiber’ surface and cross section.
Optical anisotropy (birefringence) of AAC fibers was determined using a polarizing interference microscope [36]. In this work, the subtractive position of a Pluta microscope [37] is applied to give the non-duplicated images for the direct measurement of the fiber’s birefringence (n). The difference between the refractive indices (n|| - n) of the fiber defines its birefringence (∆n) which can be determined directly for a round cross-section fiber by Eq. (2) [38]:
(2)
where Z is the displacement of the fringe shift, is the wavelength of the light used, b is the interfringe spacing and d is the fiber diameter. The error of measuring the optical path difference (Z λ/b) using the interference Pluta microscope ranges between
0.001 and 0.003 [39]. The low birefringence fibers have low molecular orientation and can be more drawable than the higher values.
RESULTS AND DISCUSSION
Factorial Experimental Design and Results
A fraction factorial experimental design (L32) with random order was used [40, 41]. The seven controlling parameters for the hot drawing experiments were: drawing stages number (DS), drawing (hot roller) temperature (DT), total draw ratio (DR), plate temperature (PT), spin finish (SF), relaxing stage ratio (RS) and relaxing temperature (RT), as set out in Table I. The two levels of each
parameter were separated as far apart as possible from one another. The total draw ratio (DR = DR1*DR2=V2/V1 *V3/V2=V3/V1) has been used in the optimization to represent the ratio between the speed of the second roller (V3) of the second stage to the speed of the first roller of the first stage (V1). The speed of the second roller of the first stage equals the speed of the first roller of the second stage, V2. The draw ratio of the first stage (DR1:V2/V1) is larger than that of the second stage (DR2:V3/V2); DR1 to DR2 ratio is 2 to 1 in two drawing stage experiments. The same drawing temperature and the plate temperature are applied for both the first and the second stages, which decreases the number of interactions between factors that can be obtained, because of restrictions in the software-ability used. The relaxing stage helps in a fiber’s deformability. An L32 design matrix was used for the thirty-two screening trials in this experiment, involving seven control parameters and two levels for each parameter as shown in Table I, designed using STATGRAPHICS software. The experiments were conducted in one block. The birefringence was measured Eq. (2), Figure 4 shows the recorded microinterferograms of the 32 samples of AAC fibers using the polarizing (Pluta) microscope. The values of birefringence are averaged from three measurements for each sample, represented by the random order number in the first column in the design matrix in Table II. The birefringence data of the measured specimens have small standard deviations which may be raised from draw frame setting basedvariation, the tension or slippage on the drawing roles or some tension during preparing the sample for testing.
An error could come from either assignable causes; i.e. variation due to changes in the independent factors, or uncontrolled variation. Statistical analysis of the effect of multi-stage hot drawing on the thermal shrinkage and crystallographic order of biodegradable aliphatic-aromatic co-polyester fibers has been reported [42].
The major tools of statistical analysis include Pareto charts, effects and interaction plots, Daniel’s plots, and Analysis of Variance (ANOVA). All statistical analysis and plots presented in this paper are constructed directly from the raw data using computer software available STATOGRAPHICS and MINITAB.
d b Z n
. .
TABLE I. Factors and their levels for the hot drawing experiment. *(the number 1 and 2 stand for 1 = 1st stage and 2 = 1st + 2nd stages as shown in Figure 1).
FIGURE 4. Non-duplicated microinterferograms of the drawn AAC fibers using a Pluta microscope.
TABLE II. L32 Experimental design array and results for the hot drawing experiment (n is the fiber’s birefringence).
Statistical Analysis of the Effects of the Factors and Their Interactions on the Responses
analysis to show the importance and direction of the effect and the way that the factors interact with each other. The Pareto chart, Figure 5, clearly shows that, draw ratio (DR) and draw temperature (DT) are by far the most important factors affecting the birefringence, followed by the interaction of relaxation temperature with the number of drawing stages (RT&DS), the plate temperature (PT), the other factors and their interactions. Increasing draw ratio or decreasing drawing temperature plays an important role in stretching the molecular chains inside the fibers resulting in an improvement in the fiber’s overall orientation.
FIGURE 5. A ranked list of significant arrangement effects and interactions for the birefringence (Pareto chart)
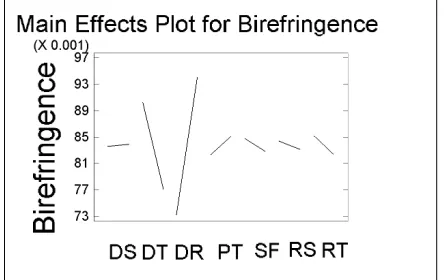
As a two-level experiment, a factor effect and interaction effect could be determined as the difference between the average responses at the low and the high level of the factors, the effect line determines the effect of the factors. The factor effect on birefringence between the average responses of the low and high levels of the factors is obtained using the design matrix and presented in Figure 6.
The effect line determines the effect of the factors from the length and the slope of the line between the two levels. The longer the effect line the more significant the factor effect. The direction of the effect is determined by the slope of the line: a positive effect is obtained when the line increases from the left to the right and vice versa.
The main effects of draw ratio (DR) and draw temperature (DT) are more pronounced on birefringence than the other factors, as their lines are longer and their slope is sharper than that of the other factors. For example, birefringence increases either
by increasing the draw ratio or by decreasing drawing temperature. The major factors influencing birefringence value need to be assessed further to understand their influence more fully.
FIGURE 6. Main effect plots for the birefringence.
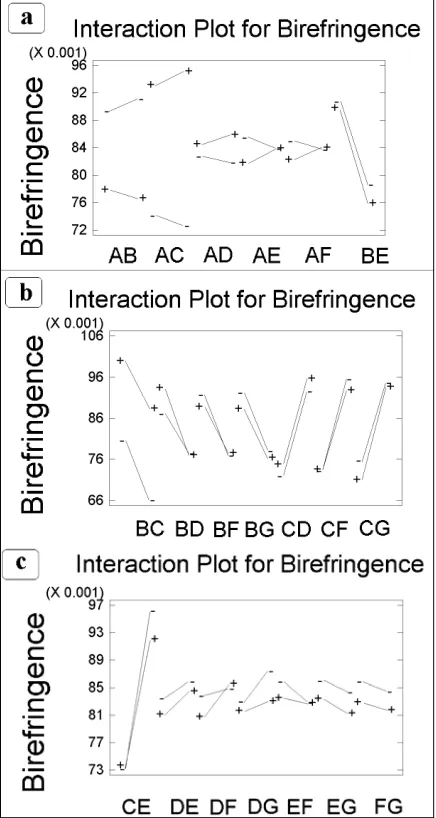
To determine the form of the interaction between each of two factors together and how the direction of change of the interacting factors influences the change on birefringence, an interaction plot is needed. In Figure 7, all the interactions could be simulated as the plot shows the existence or otherwise of each two-factor interaction, as coded in
Table I. For example, the interaction between drawing stages number (DS) coded as A and drawing temperature (DT) coded as B is presented as AB on the plot. The first factor (A) is presented on the X-axis from low level to high level, the second factor (B) shows as two different lines, one for low level coded as (-) and another for high level coded as (+).
The nonparallel lines confirm the presence of intersection. The Y-axis shows the averages of the measured response, birefringence. It is a good method to allow the interaction between drawing stage number and drawing temperature relatively straight-forward to identify. Where there are clearly interactions, as with AB, AC, AE, AF, BD DF, DG and EF, their significance should be investigated using ANOVA because of the small angles between the interaction lines. With one-stage drawing, the tension will be very high, and the spin finish will play an important role in the filaments’ slippage on the last roller after application of the spin finish, in addition to the spin finish in the as-spun samples.
important/unimportant categories and gives more details whether the factor’s effect is positive or negative [24].
The straight line represents the empirical principle in the middle of the range; the significant effect for both positive and negative effect could be reflected in deviation of the data points from the straight line. The further the deviation, the greater the statistical significance. If responses follow a normal distribution pattern, then it can be concluded that there are not statistically significant factor effects in the experiment.
FIGURE 7. Interaction plots for birefringence.
FIGURE 8. Statistical standardized and percentage order values of factors and their interactions (Normal Probability Plot) for the birefringence.
Figure 8 displays the normal probability plot of the birefringence estimated and gives more details about the normal distribution for the data. Draw ratio, draw temperature and plate temperature have important effects on birefringence. In the relaxation process, when relaxing stage ratio increases, the yarn speed decreases, the cooling time increases and the spin finish layer’s thickness will be increased. That relationship could help to explain the interaction between process conditions and fiber structure. On the other hand, when a higher draw ratio is applied, the speed of the final roller will increase and the spin finish layer thickness on the fibers at constant spin finish pump speed will be affected: that could explain the interaction between the spin finish and the draw ratio, in terms of the cooling time effect.
Analysis of Variance (ANOVA)
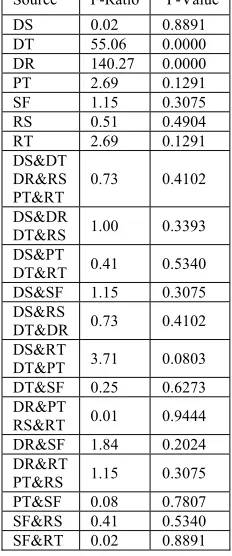
ANOVA results are listed in Table III. Birefringence is affected significantly by DR (PDR = 0.000) and DT (PDT = 0.000). Note that, even though PDR = PDT = 0.000, the order of the significance is obtained depending on F-Ratio listed, DR>>DT. Although there are interactions between some factors, their effects are not significant. According to the previous analyses, it may be concluded that the most effective and significant parameters are the draw ratio and the drawing temperature. Other factors and interactions have their effects but these are limited and less significant. By increasing the relaxation temperature, an increase in the molecular mobility and a decrease in internal stress could be achieved. Drawing tension is related to the stability of the drawing conditions; it is increased with a reduction of drawing temperature or increase of draw ratio.
The Regression Equation and Estimation Results
Based on the analysis of the fraction factorial experimental design (L32) results and using STATGRAPHICS software, a simplified model was fitted to the experimental data by the regression (Eq. 3).
TABLE III. ANOVA Results identifying the statistical significance of factors effects on the birefringence.
Source F-Ratio P-Value
DS 0.02 0.8891
DT 55.06 0.0000
DR 140.27 0.0000
PT 2.69 0.1291
SF 1.15 0.3075
RS 0.51 0.4904
RT 2.69 0.1291
DS&DT DR&RS PT&RT
0.73 0.4102
DS&DR
DT&RS 1.00 0.3393
DS&PT
DT&RT 0.41 0.5340
DS&SF 1.15 0.3075 DS&RS
DT&DR 0.73 0.4102
DS&RT
DT&PT 3.71 0.0803
DT&SF 0.25 0.6273
DR&PT
RS&RT 0.01 0.9444
DR&SF 1.84 0.2024
DR&RT
PT&RS 1.15 0.3075
PT&SF 0.08 0.7807 SF&RS 0.41 0.5340 SF&RT 0.02 0.8891
Enhanced regression optimizes the fiber birefringence in order to achieve the most satisfactory properties in the final desired fiber for different applications. The regression equations in terms of the previous coded values (Table I) are given as follows:
Birefringence = 0.0722292
- 0.00104167*DS
- 0.00029375*DT
+ 0.00841667*DR
- 0.000135417*PT
+ 0.00380556*SF
- 0.228125*RS
- 0.00013125*RT
- 0.00015*DS*DT
+ 0.00233333*DS*DR (3)
+ 0.0001125*DS*PT
+ 0.0025*DS*SF
+ 0.075*DS*RS
- 0.0003375*DS*RT
- 0.0000583333*DT*SF
+ 0.00000833333*DR*PT
- 0.00211111*DR*SF
+ 0.000125*DR*RT
+ 0.0000333333*PT*SF
+ 0.0375*SF*RS
- 0.0000166667*SF*RT
The model evaluates the significance effect of each independent variable to a predicted response depending on the coefficient constant for the linear effects of independent factors and the coefficient constant for the interactions effects, where 0.0722292 is the coefficient constant for the offset term.
FIGURE 9. Experimental observed results and theoretical fitted results plot for the birefringence.
FIGURE 10. Cube plots of the estimated effects for the birefringence for the high and low studied factor settings (DS=1.5, PT=50.0, SF=2.25, RS=0.06).
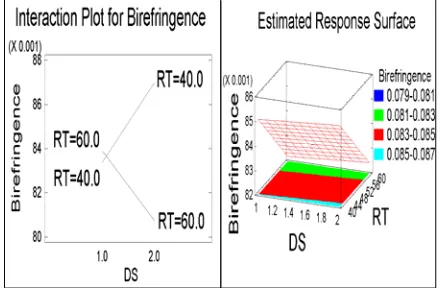
The pattern of estimated responses is based on the assumed model derived from the experimental observations. The geometric result of plotting a response variable is as a function of two factors and the interaction appears with the surface twist. In order to determine the direction of the interaction DS&RT,
Figure 11 shows the estimated response surface and interaction plot between DS and RT for the birefringence. There are three axes, the first factor DS is on the X-axis with low and high levels, the second factor RT is on the Y-axis with low and high levels and the Z-axis shows the averages of the measured birefringence. The estimated response surface is based on the assumed regression model. Because the surface is flat with no twist found in the surface, a significant effect has therefore been detected between DS and RT, which in an agreement with the previous statistical analysis results of the interaction plot and ANOVA derived from the
experimental data. Figure 12 shows the estimated response surface and interaction plot between DT and PT for the birefringence. It is confirmed that there is insignificant effect between DT and PT.
FIGURE 11. Estimated response surface and interaction plot between DS and RT for the birefringence.
FIGURE 12. Estimated response surface and interaction plot between DT and PT for the birefringence.
In conclusion and according to the analysis, the most effective and significant parameters affecting the overall orientation in the AAC fibers are the draw ratio and the drawing temperature. Other effects are overcome by the significance of the draw ratio and drawing temperature. Birefringence is affected positively by draw ratio and plate temperature, and negatively by drawing temperature, the interaction between drawing stage and relaxing temperature, relaxing temperature and the interaction between draw ratio and spin finish.
deformed during the relaxation stage allowing a new stabilize form by further re-crystallization. The possible mechanism of the effect of the spin-finish application on the internal structure is a heat transfer and cooling effect during the drawing stage and due to the friction or slippage (stick-slip) in the drawing and relaxing stages. That relationship could help to explain the interaction between process conditions and fiber structure.
CONCLUSION
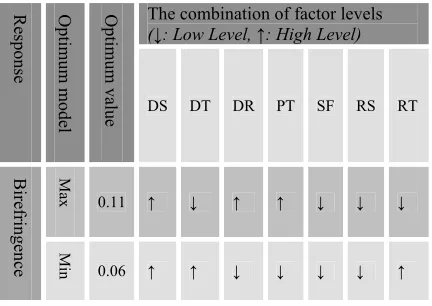
As-spun fibers made of biodegradable linear aliphatic-aromatic co-polyester (AAC) were drawn at different conditions and their structure was studied. The drawing and overall orientation of the AAC fibers were characterized and statistically modeled. Thermal properties of drawn fibers made of AAC seem insignificantly affected. Birefringence is affected significantly by draw ratio and draw temperature, which are the most effective and significant parameters in this experiment. Other factors and interactions have their effects on the fiber structure but are limited and less significant. The effects from the interaction between draw stage and spin finish are less prominent and could be related to the practical relationship between the tension and the oily roller surface on the last roller in the relaxation stage, which causes some slippage. Table IV
summarizes the main conclusion of the results in a concise statistical model. The optimization of overall orientation presents the combination of factor levels which maximize and minimize responses over the indicated region.
The model covers the identified and significant main and interaction factors, and specifies the combinations of factor levels for enhancing responses of drawn AAC fibers. The obtained regression model forms a part of a forecasting program for the production of environmentally friendly AAC fibers. Interesting results have been achieved, and a new forecasting model has been set for optimizing the drawing process effect. With their elasticproperties, aliphatic-aromatic co-polyester fibers could be used in agricultural, horticultural and other non-traditional textile applications. The model helps processing scientists and technologists in industry to obtain the enhanced overall orientation order at suitable conditions related to final product cost, and to process environmentally friendly, economical, energy efficient fibers. Mechanical and other properties of drawn AAC fibers will be reported in a future work.
TABLE IV. The combinations of factor levels for birefringence.
Response Optimum mode
l
Optimum valu
e
The combination of factor levels
(↓: Low Level, ↑: High Level)
DS DT DR PT SF RS RT
Birefring
ence
Max
0.11 ↑ ↓ ↑ ↑ ↓ ↓ ↓
Min
0.06 ↑ ↑ ↓ ↓ ↓ ↓ ↑
REFERENCES
[1] Ki, H. C.; Park, O. O., Polymer 42, 1849 2001. [2] Fang, Q.; Hanna, M. A., Bio-resource
Technology 78, 115 2001.
[3] Bajaj, P., Textile Research Journal 51, 696 1981.
[4] Renke-Gluszko, M.; Fray, M. E., Biomaterials 25, 5191 2004.
[5] Prowans, P.; Fray, M. E.; Slonecki, J., Biomaterials 23, 2973 2002.
[6] Seala, B. L.; Oterob, T. C.; Panitch, A., Materials Science and Engineering 34, 147 2001.
[7] Twarowska-Schmidt, K., Fibres & Textiles in Eastern Europe 12, 15 2004.
[8] Fumin, L.; Haile, W. A.; Tincher, M. E.; Harris, W. S., European Patent EP13303502003. [9] Wang, J. H.; Aimin, H. in Wipo Patent
WO/2008/008068: 2008.
[10] LU, F.; Ahaile, W.; Etincher, M.; Wiley, S. H. in The World Intellectual Property Organization (WIPO), Switzerland: 2002. [11] Twarowska-Schmidt, K.; Ratajska, M., FIBRES
& TEXTILES in Eastern Europe 13, 71 2005. [12] Kadolph, S. J.; Langford, A. L., Textiles
Pearson Education Inc: USA, 2002.
[13] Brody, H., Synthetic fibre materials; Longman group UK limited London, 1994.
[14] Kadolph, S. J.; Langford, A. L., Textiles, 9th edition; Pearson Education Inc New Jersey, USA, 2002.
[15] Lord, P., Hand Book of Yarn Production: Technology Science and Economics The Textile Institute & CRC & WP England, 2003.
[17] Hes, L.; Ursiny, P., Yarn Texturizing Technology; EEC Comett program & Eurotex Portugal, 1994
[18] Ziabicki, A., Fundamental of Fibre Formation; John Wiley &Sons: London, 1976.
[19] Giles, H. F.; Wagner, J. R.; Mount, E. M., Extrusion: the Definition Processing Guide and Hand Book; William Andrew Inc: Norwich, 2005.
[20] Warner, S. B., Fibre Science; Prentice-Hall, Inc: New Jersey, 1995.
[21] Hearle, J. W. S.; Miles, L. W. C., The Setting of Fibres and Fabrics; Marrow Publishing Co Ltd: England, 1971.
[22] Brydson, J. A., Flow Properties of Polymer Melts George Godwin Limited: London, 1981.
[23] Zhang, Z., The TQM Magazine 10, 432 1998. [24] Gardiner, W. P.; Gettinby, G., Experimental
Design Techniques in Statistical Practice, A practical Software-Based Approach; Horwood Publishing Limited: Chichester, England, 1998.
[25] Vlachogiannis, J. G.; Roy, R. K., The TOM magazine 17, 456 2005.
[26] Antony, J.; Perry, D.; Wang, C.; Kumar, M., Assembly automation 26, 18 2006.
[27] NICNAS, CAS Number 60961-73-12003. [28] Connell, D. W., General Characteristics of
Organic Compounds Which Exhibit Bioaccumulation, In Bioaccumulation of Xenobiotic Compounds; CRC Press: Boca Raton, Florida, 1990.
[29] Nabholz, J. V.; Miller, P.; Zeeman, M., Environmental Risk Assessment of the New Chemicals under the Toxic Substances Control Act (TSCA) Section Five, Environmental Toxicology and Risk Assessment. ASTM STP 1179. Wayne G. Landis, Jane S. Hughes, and Michael A. Lewis ASTM: Philadelphia, 1993.
[30] Witt, U.; Einig, T.; Yamamoto, M.; Kleeberg, I.; Deckwer, W.-D.; Müller, R.-J., Chemosphere 44, 289 2001.
[31] Younes, B.; Fotheringham, A.; EL-Dessouky, H. M., Polymer Engineering & Science 49, 2492 2009.
[32] Younes, B.; Fotheringham, A.; EL-Dessouky, H. M., Journal of Applied Polymer Science 118, 1270 2010.
[33] Younes, B.; Fotheringham, A., Journal of Applied Polymer Science 119, 1896 2011. [34] Younes, B.; Fotheringham, A.; EL-Dessouky,
H. M.; Haddad, G., International Journal of Polymeric Materials 60, 316 2011.
[35] Andreoli, C.; Freti, F., Man-made fibres ACIMIT: Italy 2004.
[36] Hermans, H., Contribution to the Physics of Cellulose Fibres; Elsevier: Amsterdam, 1946. [37] Sokkar, T. Z. N.; El-Dessouky, H. M.; Shams-Eldin, M. A.; El-Morsy, M. A., Optics & Laser in Engineering 45, 431 2007.
[38] Simmens, S. C., Nature 181, 1260 1958.
[39] Pluta, M., Advanced Light Microscopy: Measuring Techniques; PWN-Polish Scientific Publishers: Warsaw, Poland, 1993. [40] Lochner, R. H.; Mater, J. E., Design for
Quality; Chapman and Hall: London 1990. [41] Phadke, M. S., Quality Engineering Using
Robust Design; Prentice Hall: Englewood Cliffs, New Jersey, 1989.
[42] Younes, B.; Fotheringham, A.; Mather, R., Fibers and Polymers Accepted /in press2011.
AUTHORS’ ADDRESSES Basel Younes
Faculty of Mechanical and Electrical Engineering Damascus University
P.O. Box 86 Damascus
Heriot Watt University Scottish Borders Campus Galashiels TD1 3HF UNITED KINGDOM
Alex Fotheringham
Heriot Watt University Scottish Borders Campus Galashiels TD1 3HF UNITED KINGDOM
Hassan M. EL-Dessouky
Fibres Research Lab School of Design
University of Leeds LS2 9JT UNITED KIINGDOM
Physics Department Faculty of Science Mansoura University EGYPT
Ghassan Haddad
Faculty of Mechanical and Electrical Engineering Damascus University