ERRORS IN TERRAIN-BASED MODEL PREDICTIONS CAUSED
BY ALTERED FOREST INVENTORY PLOT LOCATIONS IN THE
SOUTHERN APPALACHIAN MOUNTAINS, USA
Huei-Jin Wang
1, S. P. Prisley
1, P. J. Radtke
1, J. Coulston
21Department of Forest Resources and Environmental Conservation, Virginia Tech, Blacksburg, VA 24061, USA 2USDA Forest Service, Southern Research Station FIA, Knoxville, TN 37919, USA
Abstract. Forest modeling applications that cover large geographic areas can benefit from the use of
widely-held knowledge about relationships between forest attributes and topographic variables. A notewor-thy example involves the coupling of field survey data from the Forest Inventory Analysis (FIA) program of USDA Forest Service with digital elevation model (DEM) data in attempts to explain how topographic characteristics influence forest productivity, vegetation composition, fire behavior, and other phenomena. Because U.S. federal law prohibits the release of actual FIA plot coordinates, only altered coordinates are released to the public. Here, terrain-based variables derived from a 10 m DEM using actual FIA plot locations were compared to those from altered plot locations in a region of the Southern Appalachian Mountains of western North Carolina, USA. Variables examined included simple terrain attributes such as percent slope and azimuth of aspect, and composite attributes such as terrain shape index, flow accumulation, slope position and forest site quality index. Results showed little correspondence between variables from altered plot locations compared to those derived using actual locations. Further, FIA field measurements of percent slope and azimuth of aspect showed little correspondence with corresponding DEM-derived estimates from the actual plot coordinates. In order to effectively link FIA plot data with DEM-derived topographic variables in mountainous regions like the Southern Appalachians, access to actual plot coordinates or terrain variables derived from them may be required.
Keywords: uncertainty; errors in measurements; GIS; FSQI.
1
Introduction
Forest scientists have known for decades that strong linkages exist between the topographic features of land-scapes and forest stand attributes including productiv-ity, species composition, fire behavior, and other phe-nomena. Many efforts have attempted to quantify these linkages to better model and predict forest productivity for assessment and management (Bolstad et al. 2001; Davis and Goetz 1990; Franklin 1995). The availability of advanced spatial analysis software and consistent, reli-able, national coverage of digital elevation model (DEM) data has facilitated our ability to characterize and quan-tify topographic conditions at locations where produc-tivity or other forest attributes are measured. With re-gard to forest characteristics across large geographic ar-eas, it is advantageous to use broad-scale inventory data coupled with DEM-derived topographic variables for de-veloping models to estimate site productivity (Bolstad
et al. 1998; Deng et al. 2007; Iverson et al. 1997).
In conducting the national forest inventory of the United States of America (USA), the Forest Inventory Analysis (FIA) program of the USDA Forest Service collects field plot data and information about forest re-sources of the USA (Smith 2002). In compliance with the U.S. Food Security Act of 1985 modified by the year 2000 Consolidated Appropriations Bill, publicly avail-able FIA data do not include actual plot coordinates (LaPoint 2005; McRoberts et al. 2005). Plot locations are altered by adding a random error of less than 1.6 km to the locations of all plots and swapping the loca-tions of a small proportion of similar plots (Guldin et al. 2006; Lister et al. 2005). Terminology for perturbing and swapping has been referred to differently in differ-ent contexts (Coulston et al. 2006b; Lister et al. 2005). We’ve adopted the terminology used by McRoberts et al. (2005) in referring to the methods of perturbing and swapping that the FIA program uses to alter plot
data users’ needs to link spatial information to FIA field data, the effects of altering coordinates may be signifi-cant when public-domain plot locations are used to pre-dict terrain-based attributes. McRoberts et al. (2005) suggested that effects of using altered plot locations were non-negligible when forested areas of interest were less than 321,700 ha. Coulston et al. (2006a; 2006b) showed that perturbed and swapped coordinates were adequate for predicting plot attributes at coarse spatial resolu-tions when linking to ancillary geospatial data, but not necessarily at fine resolutions. They concluded that pre-dictions of forest-related attributes at fine spatial scales using altered plot locations may be inaccurate.
Raster grid sizes on the order of 10 m (10 m × 10 m) to 30 m (30 m × 30 m) are commonly adopted in many applications that assign DEM-derived ter-rain attributes to field plot data. Such grid sizes are primarily based on DEM data sets readily available from public sources. Fine resolution (≤ 30 m) data may be warranted in landscape-level modeling appli-cations because terrain-based variation is likely under-estimated using low-resolution terrain data (Bolstad et al. 1998). Topographic variables derived from DEMs have been applied to terrain-based estimation proce-dures of forest site productivity, accounting for slope, aspect, and water-movement relevant variables such as terrain shape, downhill flow accumulation, and slope position (Iverson et al. 1997; McNab 1993; Meiners et al. 1984; Stage 1976). When DEM-derived topographic variables are paired with productivity measures observed on field plots, a concern arises that altered plot coordi-nates may cause substantially poorer model performance (Coulston et al. 2006b).
Effects of topographic variables on forest productivity in the Southern Appalachian Mountains of the USA have been known for decades (McNab 1993; Whittaker 1966). Because of the strength of relationships between topog-raphy and productivity in the Southern Appalachian Mountains, the region provides an ideal setting for an assessment of the effects of altering plot locations on geospatial modeling. Previous work has identified el-evation and/or terrain shape as main determinants of basal area and forest composition (Bolstad et al. 1998). Aspect and slope position – closely related to differ-ences in microclimate, soil moisture, and soil depth – are significantly associated with site quality for upland oaks (Carmean 1970). Tree height is known to be corre-lated with a terrain shape index in southern Appalachian deciduous forests (McNab 1989), as is leaf area index
nitudes of errors in forestry-related terrain-based model predictions for FIA plot locations when altered coor-dinates were used in place of actual ones. The goals included the examination of several simple terrain vari-ables including slope and aspect, along with some model-based attributes including the forest site quality index (FSQI) of Meiners et al. (1984). A further goal involved the assessment of the potential for interchanging FIA field-based terrain measurements with DEM-derived es-timates. Favorable comparison of field measurements with DEM-derived values from actual plot locations was seen as a potential means to overcome any limitations of working with the same attributes derived from publicly available altered plot locations.
2
Methods
2.1 Study Area This study was conducted using data from the FIA survey area that covers the mountain-ous region of western North Carolina, USA (Figure 1). This area comprises 21 counties covering approximately 17,870 km2. Most of the study area is in the Blue Ridge physiographic province of the Southern Appalachian Mountains (Fenneman and Johnson 1946). Elevations in the study area range from 266 to 2,033 m. Forests are dominated by mixed upland hardwood communities, with some oak-yellow poplar and oak-hickory communi-ties (Forest Inventory and Analysis 2009). Chestnut oak (Quercus prinus L.) occurs frequently across a broad range of elevations and terrain shapes in the region, and it is particularly dominant on xeric upland sites such as ridges and upper slopes (Bolstad et al. 1998). Mesophytic species such as yellow poplar (Liriodendron
tulipifera L.) typically dominate the valleys and moist slopes (McNab 1993; Whittaker 1956). Northern red oak (Quercus rubraL.), white oak (Q. Alba L.), and hickory (Carya spp.) exhibit dominance across a wide range of sites having moisture regimes that range between xeric and mesic (Whittaker 1956).
Figure 1: Altered FIA plot locations in the Blue Ridge physiographic province of the Southern Appalachian Mountains in western North Carolina, USA.
used to provide field measurements of percent slope and azimuth of aspect.
2.3 Terrain Data Digital elevation data were ob-tained from the US Geological Survey “seamless” web site (http://seamless.usgs.gov, 9/1/2008) for 10 m grid size DEM coverage of the study area. From this dataset, additional terrain datasets were developed using spatial analysis functions available in ArcGIS 9.2 software (En-vironmental Systems Research Institute, Inc., Redlands, California). Percent slope was computed using the Ar-cGIS slope tool, which applies the Horn (1981) algorithm using elevations at eight adjacent cells. Azimuth of as-pect was calculated using the default ArcGIS algorithms. To avoid difficulties in working with 0˚ – 360˚ azimuth values, aspect was also transformed using a cosine trans-formation that assigned values of 1 for due north, -1 for
due south, and 0 for due east and west.
impermeabil-path distance from the nearest ridge to stream using the flow length tool in ArcGIS.
2.4 Terrain-based Model of Forest Productivity
The FSQI developed by Meiners et al. (1984) was used to predict site productivity from DEM-derived attributes of each FIA plot. The index assigns ordinal ranks corre-sponding to relative site quality for each of three at-tributes, slope, aspect, and slope position, which re-flect moisture availability in Southern Appalachian for-est soils. The FSQI is then computed as the unweighted sum of the ordinal values. Slope was ranked into one of five integer classes with 1 corresponding to steepest (> 60%) slopes where forest productivity is typically low, and 5 corresponding to least steep (<15%) slopes where productivity is typically high in Southern Appalachian forests. Aspect was ranked similarly into classes ranging from 1 to 6, with southerly and westerly aspects having low values to reflect the relatively high evaporative de-mands associated with low forest productivity. Slope positions were ranked from 1 to 5 for classes represent-ing, in ascending order, the following classes: shoulders (DEM-derived slope position between 0.75 - 0.9); back-slopes (0.25 – 0.75); summits (0.9 – 1.0); footlsopes (0.1 – 0.25); and toeslopes, terraces, or floodplains (Meiners et al. 1984).
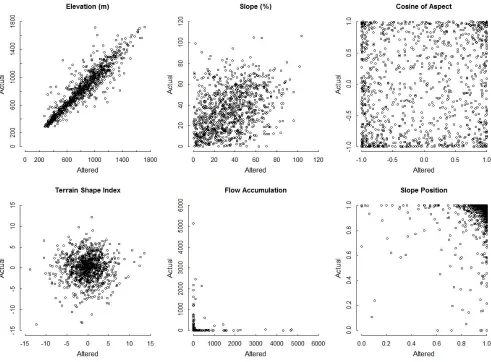
2.5 Analysis Approach Data listing actual and al-tered plot coordinates were projected to a suitable coor-dinate system so they could be overlaid on DEM-derived raster layers in a GIS. Cell values from the DEM-based terrain layers were subsequently assigned to each plot location and compared between actual and altered lo-cations. Scatterplots were used to evaluate whether or not linear relationships existed between DEM-derived terrain variables from actual versus altered plot loca-tions. Pearson product-moment correlation, denoted r, was used to measure the strength of the linear relation-ship between DEM-derived terrain variables at actual and altered locations, and Spearman rank correlation (rs) was used to account for nonlinear relationships. Sta-tistical significance was determined by Fisher’s Z trans-formation and a large-sample approximation to the nor-mal distribution (Best and Roberts 1975; Fisher 1915; Higgins 2004).
Plot FSQI values were assigned into four classes: (1) xeric sites, FSQI = 3-6; (2) subxeric sites, FSQI = 7-10; (3) submesic sites, FSQI = 11-13; (4) mesic sites, FSQI = 14-16. Categorical FSQI site index classes for actual
tic, the validity of substituting actual with altered plot locations was evaluated with the strength of agreement ranging from +1 (perfect agreement) to 0 (poor agree-ment or agreeagree-ment by chance) (Landis and Koch 1977).
3
Results
3.1 Actual versus Altered Plot Coordinates
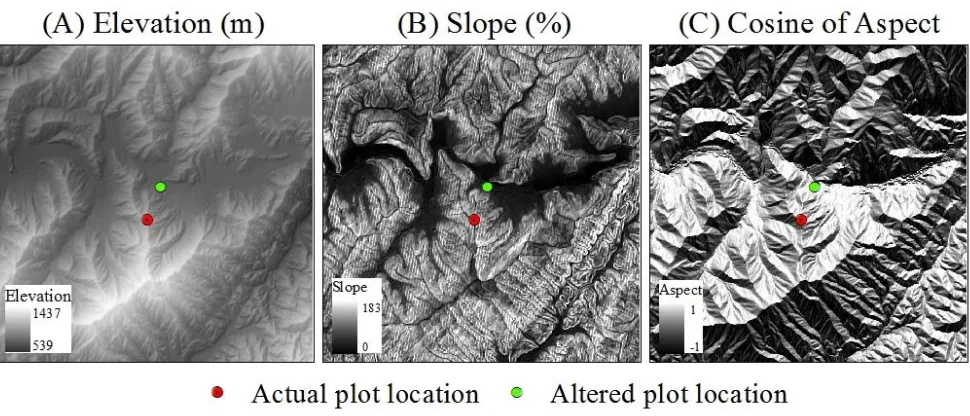
Perturbing and swapping plot locations noticeably af-fected DEM-derived topographic attributes. Correla-tion coefficients for terrain shape index and flow accu-mulation did not show significant evidence (α = 0.05) of positive correlation between actual and altered lo-cations (Table 1). Percent slope, slope position, and cosine-transformed aspect values from actual and altered plot locations were weakly correlated by either correla-tion measure r or rs (Table 1). Elevation values were the most consistent of the variables examined between actual and altered plot locations (Table 1, Table 1). Re-gardless of the strength or weakness of correlation, dif-ferences between DEM-derived variables obtained at ac-tual and altered plot locations had wide ranges, with correspondingly large sums of squared errors (Table 1). An example of differences between actual and altered plot locations was generated to illustrate typical dis-crepancies observed in data when a plot’s location was altered (Figure 2). The example simulates a perturba-tion of 670 m between actual and altered plot locaperturba-tions in a mountainous section of the study area. Elevations of 1043 m and 785 m were obtained from the DEM at the actual and perturbed plot coordinates, respectively. Percent slopes of 99% (actual) and 2% (perturbed) were calculated from the DEM, along with aspect angles of 88˚ (actual) and 275˚ (perturbed).
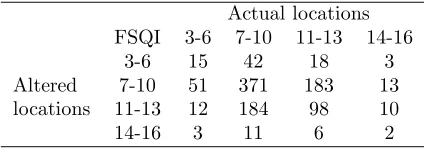
3.2 FSQI Model AgreementFSQI consisted of scores from 3 (most xeric) to 16 (most mesic). Only 15.4% of plots had the same scores for actual and al-tered locations. The Pearson product-moment corre-lation showed a weak but statistically significant posi-tive correlation r = 0.167 (p < 0.01). When aggre-gated to four classes, FSQI exhibited 48% overall agree-ment (Figure 3); however, the strength of agreeagree-ment was slight (Kappa = 0.04) when excluding the agreement by chance.
Table 1: Pearson product-moment correlation (r), Spearman rank correlation (rs), and root mean squared error (RMSE) for comparison of the effects of actual versus altered plot locations in calculating DEM-derived variables.
Variable r Pearson Spearman RMSE†
p-value rs p-value
Elevation (m) 0.928 < 0.001 0.930 <0.001 113.06 Slope (%) 0.383 < 0.001 0.395 <0.001 23.14 Cosine of aspect 0.093 0.003 0.080 0.010 0.95 Terrain shape index 0.036 0.247 0.019 0.547 4.37 Flow accumulation -0.006 0.860 0.036 0.249 2812.12 Slope position 0.201 < 0.001 0.084 0.008 0.18
†same units as variable. Refer to Table 1 for ranges and scales of
observed data.
Table 2: The contingency table of forest site quality index (FSQI) for actual versus altered plot coordinates, accounting for DEM-derived percent slope, azimuth of aspect and slope position.
Actual locations FSQI 3-6 7-10 11-13 14-16
3-6 15 42 18 3
Altered 7-10 51 371 183 13 locations 11-13 12 184 98 10
14-16 3 11 6 2
obtained at actual plot locations (Table 2). Correla-tion between field records and DEM-derived values for percent slope (r= 0.61) was greater than that between altered and actual DEM-derived values (r = 0.38, Ta-ble 1). Correlation between field observations and DEM-derived values for cosine of aspect (rs = 0.54) was also greater than that between altered and actual DEM-derived values (rs= 0.08, Table 1). Fifty-three percent of plots had field measurements within 10% of DEM-derived percent slopes. For aspect, 21% of plots had field measurements within 10˚ of DEM-derived aspects (Figure 4).
4
Discussion and Conclusions
Differences are substantial when perturbed and swapped plot locations are used in place of actual plot locations to derive terrain variables from a 10 m DEM in the Southern Appalachian Mountains, USA. It is widely known that microscale variation in landform and terrain affects temperature and soil moisture, thus influencing plant growth, especially in mountainous regions (Bai-ley 2009; Roise and Betters 1981; Stage and Salas 2007). Applying this knowledge to the results obtained here, perturbed and swapped plot locations may not prove
Table 3: Quality assessment of interchange of terrain values – percent slope and azimuth of aspect – between FIA field measurements and DEM-derived values from actual plot locations. Percentage of plots based on dif-ferent levels of tolerated errors (sample size = 767).
Percent slope Azimuth of aspect Error (%) Plots (%) Error (˚) Plots (%)
±5 31.2 ±5 12.3
±10 52.8 ±10 21.3
±15 68.8 ±15 32.5
±20 79.5 ±20 39.9
±25 87.2 ±25 45.8
±30 91.4 ±30 50.7
useful when modeling forest productivity, species com-position, or other attributes related to terrain variables because the fine-scale information from 10 m DEMs does not generally apply equally at both actual and altered plot locations. Although the FSQI model has been ap-plied in forest productivity research of upland oak forests in the Southern Appalachians (Bolstad et al. 1998; Ross et al. 1986), little evidence was found here to support that FIA altered plot locations could be used to calcu-late FSQI in lieu of actual plot locations.
com-Figure 2: Scatterplots of terrain variables for actual and altered plot locations: elevation, percent slope, cosine of aspect, terrain shape index, flow accumulation, and slope position (sample size = 1022).
promise the confidentiality of FIA plot locations.
The potential for interchanging FIA field terrain mea-surements with DEM-derived estimates is somewhat un-favorable for either developing or applying topographic-based models as well. According to the FIA (2007) field manual, allowable tolerances for percent slope and az-imuth of aspect errors were ±10% and±10˚, respec-tively, on at least 90% of plots measured. Even though actual plot locations were used, DEM-derived slope and aspect did not meet these accuracy standards (Figure 4). The algorithms used in GIS-based terrain analysis do not measure slope and aspect in the same ways as they are measured in FIA field procedures, so this compari-son should not be taken as evidence that FIA standards for field measurement accuracy are not being met. We make the comparison here to inform readers that field measurements of terrain variables in the FIA database are not interchangeable with DEM-derived values in the
Southern Appalachian Mountains.
Figure 3: A simulated example of plot perturbation to illustrate differences in elevation, slope, and aspect typical of those observed in comparison of DEM-derived terrain variables from actual versus altered FIA plot locations.
et al. 2005; Forest Inventory and Analysis 2007). Given the positional uncertainties, the FIA program might con-sider reporting accuracy of the actual locations, when available, to those clients who have access within a con-fidentiality agreement to work with actual plot coordi-nates. This information is particularly important when conducting research to develop models based on fine res-olution spatial data such as DEMs and remote sensing imagery. In keeping pace with the increased resolution and spatial precision of publicly available spatial data sets, researchers and end-users must be aware of the lim-itations that perturbing and swapping of FIA field plot coordinates impose on applications involving fine-scale geospatial analyses.
Acknowledgements
This research was supported by the USDA Forest Ser-vice, Southern Research Station under Agreement No. SRS 05-CA-11330134-251. The authors gratefully ac-knowledge the support of the Southern Research Sta-tion, specifically Cathryn Greenberg and David Loftis. We also acknowledge the valuable assistance given by Bill Burkman and Sam Lambert of the SRS FIA unit, and Claudia Cotton while she was a graduate student in the Virginia Tech Department of Forest Resources and Environmental Conservation.
References
Bailey, R.G. 2009. Ecosystem Geography: From Ecore-gions to Sites. 2nded. Springer, New York. 251 p.
Best, D.J., and Roberts, D.E. 1975. Algorithm AS 89: The upper tail probabilities of Spearman’s rho. Jour-nal of the Royal Statistical Society. Series C (Applied Statistics) 24(3): 377-379.
Bolstad, P., Jenks, A., Berkin, J., Horne, K., and Read-ing, W.H. 2005. A comparison of autonomous, WAAS, real-time, and post-processed global positioning sys-tems (GPS) accuracies in northern forests. Northern Journal of Applied Forestry 22(1): 5-11.
Bolstad, P.V., Swank, W., and Vose, J. 1998. Predicting Southern Appalachian overstory vegetation with dig-ital terrain data. Landscape Ecology 13(5): 271-283.
Bolstad, P.V., Vose, J.M., and McNulty, S.G. 2001. For-est productivity, leaf area, and terrain in southern Appalachian deciduous forests. Forest Science 47(3): 419-427.
Carmean, W.H. 1970. Site quality for eastern hard-woods. P. 36-56. in Silviculture of oaks and associ-ated species. R. D. Lane (ed). USDA, Forest Ser-vice, Northeastern Forest Experiment Station, Upper Darby, PA.
Figure 4: Comparison of FIA field measurements and DEM-derived values using actual plot locations: Pearson product-moment correlation r = 0.61 for percent slope; Spearman rank correlation rs = 0.54 for cosine of aspect (sample size = 767).
McWilliams (eds). USDA, Forest Service, Denver, CO.
Coulston, J.W., Riitters, K.H., McRoberts, R.E., Reams, G.A., and Smith, W.D. 2006b. True versus perturbed forest inventory plot locations for model-ing: a simulation study. Canadian Journal of Forest Research 36(3): 801-807.
Davis, F.W., and Goetz, S. 1990. Modeling vegetation pattern using digital terrain data. Landscape Ecology 4: 69-80.
Davis, F.W., Seo, C., and Zielinski, W.J. 2007. Regional variation in home-range-scale habitat models for fisher (Martes pennanti) in California. Ecological Applica-tions 17(8): 2195-2213.
Deng, Y.X., Chen, X.F., and Kheir, R.B. 2007. An ex-ploratory procedure defining a local topographic in-dex for mountainous vegetation conditions. Giscience & Remote Sensing 44(4): 383-401.
Fenneman, N.M., and Johnson, D.W. 1946. Physio-graphic divisions of the conterminous United States. U.S. Geological Survey special map series, scale 1:7,000,000. Washington D.C.
Fisher, R.A. 1915. Frequency distribution of the values of the correlation coefficient in samples of an indefi-nitely large population. Biometrika 10(4): 507-521.
Forest Inventory and Analysis. 2007. Forest inventory and analysis national core field guide - Volume 1: field data collection procedures for phase II plots version 4.0. USDA Forest Service (ed). Forest Inventory and Analysis National Office.
Forest Inventory and Analysis. 2009. FIA DataMart - FI-ADB version 4.0. USDA Forest Service, Forest Inven-tory and Analysis National Program, Arlington VA.
Franklin, J. 1995. Predictive vegetation mapping: Geo-graphic modelling of biospatial patterns in relation to environmental gradients. Progress in Physical Geog-raphy 19(4): 474-499.
Guldin, R.W., King, S.L., and Scott, C.T. 2006. Vision for the future of FIA: paean to progress, possibilities, and partners. P. 1-8 in Proceedings of the sixth annual forest inventory and analysis symposium. Gen. Tech. Rep. WO-70R.E. McRoberts, G.A. Reams, P.C. Van-Deusen, and W.H. McWilliams (eds). USDA, Forest Service, Denver, CO.
Nonpara-metric Statistics. Brooks/Cole - Thomson Learning, Pacific Grove, California. 366 p.
Horn, B.K.P. 1981. Hill shading and the reflectance map. Proceedings of the IEEE 69(1): 14-47.
Horsch, B. 2003. Modelling the spatial distribution of montane and subalpine forests in the central Alps using digital elevation models. Ecological Modelling 168(3): 267-282.
Iverson, L.R., Dale, M.E., Scott, C.T., and Prasad, A. 1997. A GIS-derived integrated moisture index to predict forest composition and productivity of Ohio forests (USA). Landscape Ecology 12(5): 331-348.
Landis, J.R., and Koch, G.G. 1977. Measurement of observer agreement for categorical data. Biometrics 33(1): 159-174.
LaPoint, E. 2005. Access and use of FIA data through FIA spatial data services. P. 199-202 in Proceedings of the fifth annual forest inventory and analysis sympo-sium. Gen. Tech. Rep. WO-69R.E. McRoberts, G.A. Reams, P.C. VanDeusen, and W.H. McWilliams (eds). USDA, Forest Service, New Orleans, LA.
Liknes, G.C., Holden, G.R., Nelson, M.D., and McRoberts, R.E. 2005. Spatially locating FIA plots from pixel values. P. 99-103 in Proceedings of the fourth annual forest inventory and analysis sympo-sium. Gen. Tech. Rep. NC-252Ronald E. McRoberts, Gregory A. Reams, Paul C. Van Deusen, William H. McWilliams, and Chris J. Cieszewski (eds). USDA, Forest Service, North Central Research Station, St. Paul, MN.
Lister, A., Scott, C., King, S., Hoppus, M., Butler, B., and Griffith, D. 2005. Strategies for preserving owner privacy in the national information management sys-tem of the USDA Forest Service’s Forest Inventory and Analysis unit. P. 163-166 in Proceedings of the fourth annual forest inventory and analysis sympo-sium. Gen. Tech. Rep. NC-252Ronald E. McRoberts, Gregory A. Reams, Paul C. Van Deusen, William H. McWilliams, and Chris J. Cieszewski (eds). USDA Forest Service, North Central Research Station, St. Paul, MN.
McNab, W.H. 1989. Terrain shape index - quantifying effect of minor landforms on tree height. Forest Sci-ence 35(1): 91-104.
McNab, W.H. 1993. A topographic index to quantify the effect of mesoscale landform on site productiv-ity Canadian Journal of Forest Research 23(6): 1100-1107.
McRoberts, R.E. 2010. The effects of rectification and Global Positioning System errors on satellite image-based estimates of forest area. Remote Sensing of En-vironment 114(8): 1710-1717.
McRoberts, R.E., Holden, G.R., Nelson, M.D., Liknes, G.C., Moser, W.K., Lister, A.J., King, S.L., LaPoint, E.B., Coulston, J.W., Smith, W.B., and Reams, G.A. 2005. Estimating and circumventing the effects of per-turbing and swapping inventory plot locations. Jour-nal of Forestry 103(6): 275-279.
Meiners, T.M., Smith, D.W., Sharik, T.L., and Beck, D.E. 1984. Soil and plant water-stress in an Ap-palachian oak forest in relation to topography and stand age. Plant and Soil 80(2): 171-179.
Roise, J.P., and Betters, D.R. 1981. An aspect transfor-mation with regard to elevation for site productivity models. Forest Science 27(3): 483-486.
Ross, M.S., Sharik, T.L., and Smith, D.W. 1986. Oak regeneration after clear felling in southwest Virginia. Forest Science 32(1): 157-169.
Smith, W.B. 2002. Forest inventory and analysis: a na-tional inventory and monitoring program. Environ-mental Pollution 116: S233-S242.
Stage, A.R. 1976. Expression for effect of aspect, slope, and habitat type on tree growth. Forest Science 22(4): 457-460.
Stage, A.R., and Salas, C. 2007. Interactions of eleva-tion, aspect, and slope in models of forest species composition and productivity. Forest Science 53(4): 486-492.
Stehman, S.V. 1997. Selecting and interpreting measures of thematic classification accuracy. Remote Sensing of Environment 62(1): 77-89.
Tenenbaum, D.E., Band, L.E., Kenworthy, S.T., and Tague, C.L. 2006. Analysis of soil moisture pat-terns in forested and suburban catchments in Bal-timore, Maryland, using high-resolution photogram-metric and LIDAR digital elevation datasets. Hydro-logical Processes 20(2): 219-240.
Tirpak, J.M., Jones-Farrand, D.T., Thompson, F.R., Twedt, D.J., Baxter, C.K., Fitzgerald, J.A., and Uih-lein, W.B. 2009. Assessing ecoregional-scale habitat suitability index models for priority landbirds. Jour-nal of Wildlife Management 73(8): 1307-1315.