6
Mobile Air Conditioning
Coordinating Lead Author
Denis Clodic (France)
Lead Authors
James Baker (USA), Jiangping Chen (China), Toshio Hirata (Japan), Roland Hwang (USA), Jürgen Köhler
(Germany), Christophe Petitjean (France), Aryadi Suwono (Indonesia)
Contributing Authors
Ward Atkinson (USA), Mahmoud Ghodbane (USA), Frank Wolf (Austria), Robert Mager (Germany), Greg
Picker (Australia), Frank Rinne (Germany), Jürgen Wertenbach (Germany)
Review Editors
EXECUTIVE SUMMARY 297
6.1 Introduction 299
6.2 Current refrigerant banks and emission
forecast 299
6.2.1 AC system characteristics 299 6.2.2 CFC-12, HFC-134a emissions from 1990 to
2003 and emission forecasts for the period
2004 to 2015 299
6.3 Fuel consumption due to MAC operation 300
6.3.1 Hours of operation by climate/region 301 6.3.2 Fuel consumption and equivalent CO2
emissions 301
6.3.3 Estimates of fleet-wide fuel consumption 302 6.3.4 Future trends and possible improvements
in energy efficiency 302
6.3.5 Future vehicles and MACs 303
6.4 Technical options for reducing direct and indirect
emissions 303
6.4.1 Improved HFC-134a systems 304
6.4.2 CO2 systems 305
6.4.3 HFC-152a systems 308
6.4.4 HC-blend systems 310
6.4.5 Alternative technologies to vapour
compression 310
6.5 Heat-load reduction and new design of AC
systems 311
References 312
EXECUTIVE SUMMARY
Mobile air-conditioning (MAC) systems have been mass-pro-duced in the USA since the early 1960s and in Japan since the 1970s. However, the numbers of air-conditioned cars in both Europe and developing countries only started to significantly increase much later, in about 1995.
The rapid switch from CFC-12 to HFC-134a was a global decision taken by all car manufacturers in developed countries. The first HFC-134a system was installed in 1990 and by 1994 almost all vehicles including cars, light commercial vehicles, and truck cabins, sold in developed countries used this refrig-erant. In developing countries the transition from CFC-12 to HFC-134a will be completed in 2008. Since 1990, significant progress has been made in limiting refrigerant emissions and the implementation of the Montreal Protocol has contributed to this. For example, recovery equipment has been developed, some countries have encouraged the intensive training of ser-vice technicians to improve servicing practices, component manufacturers have designed low-emission components (fit-tings, hoses, etc.) and car manufacturers have usually lowered the original refrigerant charge. These efforts led to a significant decrease in emission levels from about 400 g yr-1 in the late 1980s to about 200 g yr-1 in the mid-1990s (UNEP, 1998) and efforts are still underway to further reduce these emission levels to 100 g yr-1 or less (Schwarz and Harnisch, 2003).
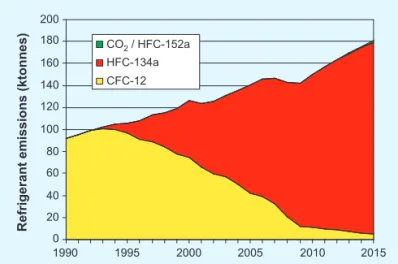
If all types of refrigerants are considered, emissions from MAC systems range from approximately 105,000 tonnes of CFC-12 in 1990 to 137,000 tonnes of CFC-12 and HFC-134a in 2003, with CFC-12 still representing 46% of those emissions. A business-as-usual scenario forecasts emissions in the range of 180,000 tonnes in 2015 (see Figure 6a), most of which will be HFC-134a. The CO2-eq emissions fell from about 850 MtCO2 -eq in 1990 to 609 Mtonnes CO2-eq in 2003 (see Figure 6b) and a business-as-usual scenario forecasts CO2-eq emissions in the range of 270 Mtonnes CO2-eq in 2015. The progressive phase out of CFC-12 in the fleet and its replacement by HFC-134a has
led to a significant decrease in CO2-eq. emissions, despite the continued growth of the MAC system fleet.
CFC-12 was not widely used within the EU due to the very low number of air-conditioned cars before 1995. However, there have been increasing concerns about the significant increase of HFC-134a use in Europe. In its Fluorinated Gas regulation proj-ect, the European Commission has proposed the phase-out of HFC-134a, thereby creating a totally new context for refriger-ant choices.
Evaluating the additional fuel consumption of MAC system operation is a complex task. Nevertheless, initial evaluations indicate that in 2003, CO2 emission due to global MAC opera-tion was in the order of 100 Mtonnes.
Options for greenhouse gas emission mitigation
There are three main options for reducing greenhouse gas (GHG) emissions: Improving the current HFC-134a system or switching to other low global warming potential (GWP) refrig-erants such as HFC-152a or CO2. Other options such as hy-drocarbons (HCs) have been investigated but car manufacturers did not support these as a possible alternative technology. Other refrigeration techniques such as sorption systems and air cycle have been tested, but are not energy efficient enough to replace the vapour compression technology.
Current regulatory policies ignore the additional fuel con-sumption of air-conditioning (AC) system operation. It might be technically possible to reduce the fuel consumption of the AC system by up to 30−40%, depending on the option chosen and the climate. This could lead to a global reduction in CO2 emissions of 40 Mtonnes yr-1.
Improved HFC-134a systems have a low leakage rate and a higher energy efficiency. Moreover, further emission reductions might be obtained with a full professional service that includes recovery, recycling and systematic end-of-life (EOL) recovery. This would require refrigerant management policies governed by national regulations and incentives.
1990 1995 2000 2005 2010 2015
Refrigerant emissions (ktonnes)
CO2 / HFC-152a HFC-134a CFC-12 200 180 160 140 120 100 80 60 40 20 0
Figure 6a. MAC refrigerant emissions from 1990 to 2015 (Clodic et al., 2004).
HFC-134a CFC-12
1990 1995 2000 2005 2010 2015
Refrigerant emissions (MtCO
2 -eq) 0 100 200 300 400 500 600 700 800 900
Figure 6b. MAC refrigerant emissions in CO2-eq from 1990 to 2015 (Clodic et al., 2004).
Alternate low GWP refrigerant systems
AC systems that use CO2 have an entirely new design unique to this refrigerant as well as a safety system. A new infrastruc-ture for servicing will also need to be implemented. The cool-ing performances of CO2 systems have been demonstrated in passenger vehicles from most major car manufacturers as well as some commercial buses and an electrical hermetic system in prototype fuel cell vehicles. Direct emissions have a very low impact due to CO2 GWP. For indirect emissions, CO2 sys-tems have shown energy efficiency comparable to an improved HFC-134a system. There are several barriers to the commer-cialization of this technology. These are the risk of suffocation, outstanding technical and cost issues and the need for an en-tirely new servicing infrastructure.
Systems using HFC-152a contain the same components as the HFC-134a system but have an added safety system. Cooling performances of HFC-152a systems have been demonstrated in passenger vehicles. Direct emissions (CO2-eq) are very low (more than 90% reduction compared to HFC-134a base line) and HFC-152a systems have an energy efficiency comparable to the improved HFC-134a system. Barriers to the commercial-ization of this technology are the risk of flammability and guar-anteeing a commercial supply of HFC-152a.
System comparison and design considerations
Safety concerns can be mitigated by using identified, existing technologies. Risk assessments for the CO2 and HFC-152a sys-tems are currently being undertaken.
The reference cost of a typical European HFC-134a sys-tem with an internally-controlled compressor is estimated to be about 215 US$. Assuming mass production, the additional cost of a CO2 system (including the safety system) is estimated to be between 48 and 180 US$. The additional cost of an HFC-152a system is estimated to be about 48 US$ for the safety devices used for a direct system, or for a secondary loop for the indirect system.
If development, validation and production lead times are considered, the improved HFC-134a system is likely to be ready first, followed by the HFC-152a system and then the CO2 system.
The servicing infrastructure will need to be prepared for the transition to a new refrigerant. This is a significant issue for each alternative refrigerant system and the burden this will place on the service industry needs to be considered, especially in developing countries.
6.1 Introduction
Mobile air-conditioning (MAC) systems have been mass-pro-duced in the USA since the early 1960s and in Japan since the 1970s. However, the numbers of air conditioned cars in Europe and in developing countries only started to significantly in-crease much later in about 1995.
The rapid switch from CFC-12 to HFC-134a was a global de-cision taken by all car manufacturers in developed countries. The first HFC-134a system was installed in 1990 and by 1994 almost all vehicles sold in developed countries used this refrig-erant. In developing countries the transition from CFC-12 to HFC-134a will be completed in 2008.
This chapter addresses an evaluation of the additional fuel consumption due to MAC operation. In 2003, this was estimat-ed to be in the order of 100 Mt CO2-eq emissions. For the same year, CO2 equivalent emissions from HFC-134a were about 96 Mtonnes and those for the remaining CFC-12 in cars were 514 Mtonnes.
There are three main options for reducing GHG emissions: Improving the current HFC-134a system or switching to other low GWP refrigerants such as HFC-152a or CO2.
6.2 Current refrigerant banks and emission forecast
Emissions from mobile air-conditioning systems of cars, light commercial vehicles (LCVs)and truck cabins are detailed by Palandre et al., (2002), Clodic et al., (2004) and Palandre et al., (2004) (see also UNEP, 2003). Even though the car industry switched from CFC-12 to HFC-134a with effect from 1992, the number of vehicles and CFC-12 bank in this fleet is still signifi-cant (see Table 6.1).
The average lifetime of cars depends on the country. It is typically 12 years in Europe and Japan and 16 years in North America.
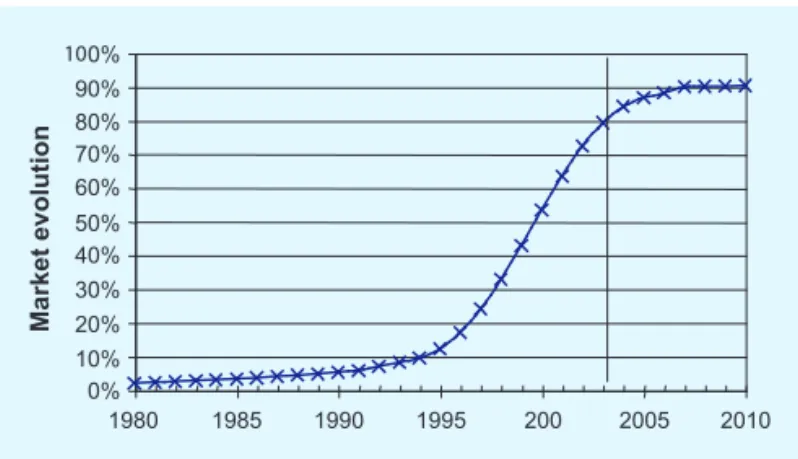
For a number of countries, the last 10 years have seen a rapid penetration of air-conditioning systems in cars, as shown in Figure 6.1 for Europe. This S curve is typical for the intro-duction of a major technology and a corresponding change of consumer habits.
In 2000, the worldwide automotive fleet numbered some 720 million of vehicles. Nearly half of the fleet is equipped with AC (361 million).
6.2.1 AC system characteristics
The average refrigerant charge depends on the type of car and the type of refrigerant. Usually HFC-134a systems have about a 15% lower charge than CFC-12 charge due to the difference in liquid densities of those two refrigerants. Current HFC-134a charges vary from 500−900 g. The lifetime of the MAC system (9−12 years) is usually considered to be shorter than the car lifetime (12−16 years) due to the relatively high cost of repair-ing AC in older vehicles.
A number of studies (Palandre et al., 2002; UNEP, 2003; Schwarz and Harnisch, 2003) have shown that annual emission rates, including accidents and servicing losses, are between 10 and 15% of the original charge. Servicing is assumed to take place for recharging when the residual charge is between 50 and 75%. Dependent on servicing habits and regulations, the recovery during servicing varies from 0−40% of recoverable refrigerant.
6.2.2 CFC-12, HFC-134a emissions from 1990 to 2003
and emission forecasts for the period 2004 to 2015
The emission inventory method described in Ashford et al. (2004) is based on IPCC inventory guidelines (IPCC, 1997). Using the results of Clodic et al. (2004), Figure 6.2 and Table 6.2 show the evolution of the refrigerant banks of HFC-134a
Table 6.1. Evolution of the CFC-12 and HFC-134a fleet (Clodic et al., 2004).
Year AC vehicle fleet (million)
CFC-12 HFC-134a 1990 212 -1991 220 -1992 229 0.7 1993 229 10 1994 222 27 1995 215 49 1996 206 74 1997 197 100 1998 186 128 1999 175 161 2000 163 198 2001 149 238 2002 134 285 2003 119 338 Market evolution 1980 0% 10% 20% 30% 40% 50% 60% 70% 80% 90% 0% 1985 1990 1995 200 2005 2010 ��
Figure 6.1. AC rate typical evolution: Western Europe example (Palandre et al., 2000).
and CFC-12 in the MAC fleet in the past (from 1990 to 2003) and for the future (up to 2015) according to a business-as-usual scenario1.
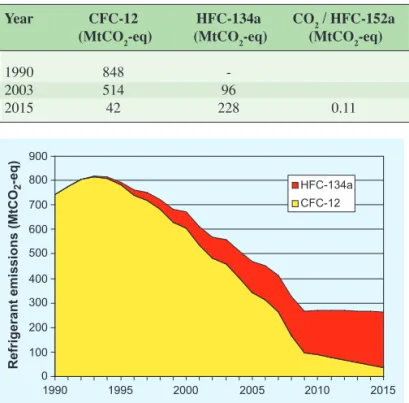
Figure 6.3 and Table 6.3 present refrigerant emissions for the two refrigerant banks. Figure 6.4 and Table 6.4 transform CFC-12 and HFC-134a emissions into CO2-eq emissions based on their GWP (values from IPCC Second Assessment Report (IPCC, 1996)).
Due to the huge difference of the GWP of these two refrig-erants, Figure 6.4 underlines the significant decrease from ap-proximately 900 MtCO2-eq in 1993 to 610 MtCO2-eq in 2003. The switch from CFC-12 to HFC-134a had a clear and positive effect on lowering global warming due to refrigerant emissions from MACSs.
6.3 Fuel consumption due to MAC operation
Nowadays the primary energy source for operating MACs is supplied by the car engine via two mechanisms: Firstly by the direct transfer of mechanical power to the compressor through a belt connected to the engine and secondly as the electrical power used by the fans and the control system.
Vehicle ACs consume more energy (including its weight) than any other auxiliaries currently present in vehicles. Yet
Table 6.2 MAC refrigerant bank (Clodic et al., 2004).
Year CFC-12 HFC-134a CO2 / HFC-152a
(tonne) (tonne) (tonne)
1990 254,273 -
-2003 131,365 287,185
-2015 12,863 633,893 3177
1990 1995 2000 2005 2010 2015
Refrigerant bank (ktonnes)
CO2 / HFC-152a HFC-134a CFC-12 0 100 200 300 400 500 600 700
1 The Business as Usual Scenario integrates several assumptions detailed in
Ashford et al., (2004) and Clodic et al., (2004): the Montreal Protocol schedule for CFC phase-out in developed and developing countries is taken into account, and economic growth rates are defined for 10 different regions as well as for the penetration of AC systems for the annual production of new cars.
Figure 6.2. MAC refrigerant bank evolution from 1990 to 2015 (Clodic et al., 2004).
Table 6.3 MAC refrigerant emissions (Clodic et al., 2004). Year CFC-12 HFC-134a CO2 / HFC-152a
(tonne) (tonne) (tonne)
1990 104,707 -
-2003 63,431 73,956
-2015 5192 175,174 934
1990 1995 2000 2005 2010 2015
Refrigerant emissions (ktonnes)
CO2 / HFC-152a HFC-134a CFC-12 200 180 160 140 120 100 80 60 40 20 0 HFC-134a CFC-12 1990 1995 2000 2005 2010 2015
Refrigerant emissions (MtCO
2 -eq) 0 100 200 300 400 500 600 700 800 900
Table 6.4. MAC refrigerant emissions in CO2-eq (Clodic et al., 2004). Year CFC-12 HFC-134a CO2 / HFC-152a (MtCO2-eq) (MtCO2-eq) (MtCO2-eq)
1990 848 -
2003 514 96
2015 42 228 0.11
Figure 6.3. MAC refrigerant emissions from 1990 to 2015 (Clodic et al., 2004).
Figure 6.4. MAC refrigerant emissions in CO2-eq from 1990 to 2015 (Clodic et al., 2004).
this additional energy consumption is not currently taken into account in fuel economy regulatory test cycles. The fuel con-sumption due to MAC operation can only be measured if the usage profile and system energy consumption characteristics are known. Up until now, such data has been sparse and incom-plete.
6.3.1 Hours of operation by climate/region
In order to estimate the annual fuel consumption of MACs, both the climatic conditions (including temperature, humidity and solar load) and the usage profile (including average mile-age, time of day when driving occurs and urban or extra-urban driving conditions) must be known. As indicated in Figure 6.5, there are significant differences in the cooling energy required due to climatic conditions. Temperate climates such as that in Frankfurt, differ from hot and humid climates, such as in Orlando or Miami, by nearly a factor 5 in terms of heat load and therefore in cooling energy.
The usage profile first of all includes the cool-down opera-tion with a higher energy consumpopera-tion and the stabilized oper-ating conditions with a lower energy consumption. To assess the global energy consumption impact of MAC, the repartition of urban and extra-urban driving durations needs to be known
and these differ per country.
At present there are no widely accepted standards for these parameters per country or region, even though there is a clear need for these. However, initial estimates can be made on the basis of several published publications (Benouali et al., 2003b; Rugh et al., 2004).
6.3.2 Fuel consumption and equivalent CO2 emissions
Several factors need to be known in order to calculate CO2 emissions from MAC operation systems. Firstly the mechani-cal and electrimechani-cal energies used by MACs must be measured. Secondly the type of engine and the management of the energy for the MACs required from the engine must be considered. Then from the additional fuel consumption the CO2 emission of MAC can be calculated.
The additional fuel consumption due to MAC operation mainly depends on climatic conditions. Table 6.5 shows the calculated mechanical power required by the compressor. This varies from 0.4−3.4 kW depending on the ambient temperature and the engine speed (Barrault et al., 2003; Benouali et al., 2003b).
MAC systems operate for about 24% of the vehicle run-ning time in northern Europe, 60% in southern Spain and up
-1 0 1 2 3 4 5 6 ARCRPDelhi New OrleansHong Kong
OrlandoBombay Singapore Miami HoustonARCRPDallasAtlantaTel A viv TokyoRome Los Angeles PhoenixNaples Barcelona
GenoaNiceMalagaCaracasDetroitARCRP Las V
egas MadridParis
BrusselsFrankfurtBerlin CopenhagenStockholm
Oslo ARCRP
Relative Energy V
alue (Frankfurt Base)
Other World Cities Base Cities EU Cities SAE ARCRP Points
Frankfurt (REV=1) Orlando (REV=5.4) Miami (REV=4.9) Tokyo (REV=3.7)
World cities July cooling requirements Not including solar heating
Phoenix (REV=3.1)
Note: SAE ARCRP stands for Society of Automotive Engineers Alternate Refrigerant Cooperative Research Program
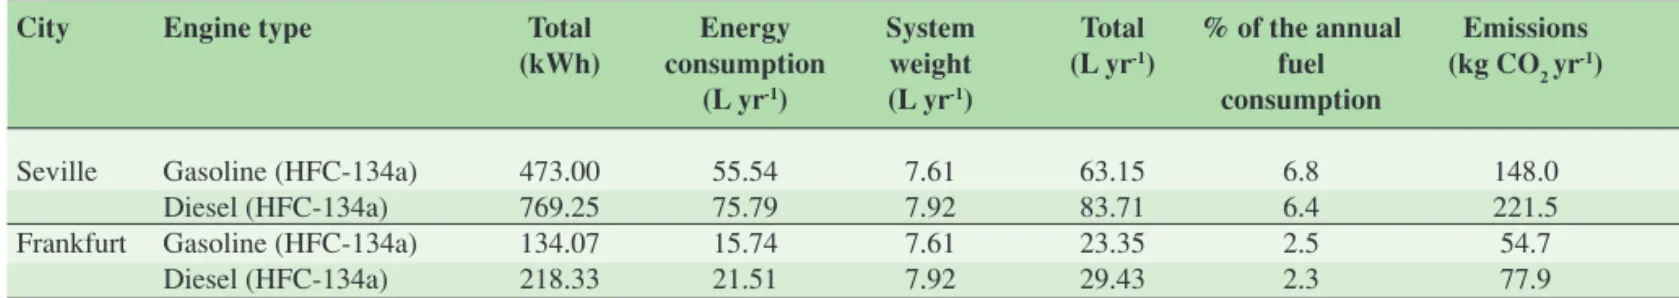
to 70% in Phoenix, Arizona. For European diesel engines the additional consumption ranges from 23 l yr-1 (Paris) to about 80 l yr-1 (Sevilla) (see Table 6.6).
If climatic conditions, engine type (diesel or gasoline) and user profile are taken into account, the annual additional fuel consumption is between 2.5 and 7.5%. This corresponds to an additional CO2 emission due to MAC operation of between 54.7 and 221.5 kg CO2 yr-1 per vehicle.
6.3.3 Estimates of fleet-wide fuel consumption
For the USA, an NREL study has estimated that 26 billion li-tres of gasoline per year (62 Mtonnes CO2) are currently used for cooling (not including defrost). This is equivalent to 5.5% of US light-duty vehicle gasoline consumption (Rugh et al., 2004). The study assumed that compressor power varied with rotations per minute (rpm) up to 3.7 kW at 3500 rpm. The as-sumed AC load penalized the fuel economy by 18% (22 mpg2
to 18 mpg) for US cars and 14% (18.8 mpg to 16.2 mpg) for US trucks. Using the same methodology NREL (Rugh et al., 2004) estimates the EU MAC fuel consumption to be 6.9 bil-lion litres (equivalent to 16 MtCO2) and the Japanese to be 1.7 billion litres (equivalent to 4 MtCO2). These figures represent 3.2 and 3.5% of vehicle fuel use respectively. Worldwide, the total emissions of air-conditioned cars is estimated to be about 100 Mtonnes of CO2 Tables 6.7 and 6.8 show the growth of air conditioned vehicles in China and India respectively. In 2002 Hu (Hu et al., 2004) estimates the air-conditioned fleet to be 6.4
million vehicles. Based on data by Kanwar (2004), the Indian AC fleet was estimated to be 4.2 million cars in 2003.
6.3.4 Future trends and possible improvements in
energy efficiency
Most of the MACs currently used in the total fleet are still basic technology (especially in the USA) with a fixed displacement compressor and manual control. These systems were not de-signed with a view to fuel savings. They produce an excess cool-ing capacity and the desired comfortable temperature is obtained by mixing heated air from the heater core to compensate for the excess cooling capacity. An on/off control is used to manage the system with respect to driving conditions (outside temperature and engine rpm). The Improved Mobile Air-conditioning (I-MAC) partnership is a current global effort to reduce direct re-frigerant emissions by 50% and indirect emissions by 30%.
Since the mid-1990s, variable capacity technology (internal control) has been introduced, mainly in Europe and Japan, to limit the energy consumption of MACs. Comparisons of the three types of compressor control: On/off, internal control and external control (introduced in 2000) show that significant en-ergy savings can be achieved with the appropriate control (Karl et al., 2003).
However, a reduction in the requested cooling capacity is another option for reducing fuel consumption. Insulation of doors and roof, limitation of window size and special glass for solar load limitation are all parameters which influence the final energy consumption of MACs. In practice these solutions have a limited usefulness due to the additional cost, extra weight, consumer demand for larger windows or safety issues related to driver visibility.
Table 6.5. Mechanical power for HFC-134a system (kW) (Barrault et al., 2003).
Rotation speed (RPM) Mechanical power (kW)
Ambient air temperature (°C)
15°C 20°C 25°C 30°C 35°C 40°C 45°C
900 0.4 0.7 0.9 1.1 1.25 1.32 1.39
1500 0.5 1.2 1.8 1.8 1.9 2.3 2.7
2500 0.7 1.4 2.1 2.4 2.7 2.9 3.1
3500 0.7 1.5 2.2 2.6 3.0 3.2 3.4
Table 6.6. Fuel consumption and CO2 emissions in Seville and Frankfurt (Barrault et al., 2003).
City Engine type Total Energy System Total % of the annual Emissions
(kWh) consumption weight (L yr-1) fuel (kg CO 2 yr-1)
(L yr-1) (L yr-1) consumption
Seville Gasoline (HFC-134a) 473.00 55.54 7.61 63.15 6.8 148.0
Diesel (HFC-134a) 769.25 75.79 7.92 83.71 6.4 221.5
Frankfurt Gasoline (HFC-134a) 134.07 15.74 7.61 23.35 2.5 54.7
Diesel (HFC-134a) 218.33 21.51 7.92 29.43 2.3 77.9
2 ‘mpg’ stands for ‘miles per gallon’. 1 mile per US gallon equals about 0.425
Low consumption MAC systems can only be developed if there are accepted standards for measuring the energy consumption of the MAC system and the additional fuel consumption of the vehicle equipped with a given MAC system.
6.3.5 Future vehicles and MACs
Environmental concerns are also driving technology changes in powertrains, which in turn is affecting MAC design.
The first trend is improvements in the energy efficiency of internal combustion engines (diesel or gasoline). This trend af-fects both the heating and the cooling modes of the MAC sys-tem. In cooling mode, a higher engine energy efficiency results in a higher relative energy penalty due to MAC. This requires significant efforts to improve MAC energy efficiency. High-ef-ficiency engines result in a heating cabin deficit which neces-sitates the installation of an additional heating function. This is why efficient heat pump systems are still being developed in competition with current existing solutions based on electrical heaters or burners.
A second trend is to introduce new functions such as stop-start (engine is stopped at idle and then restop-started), stop & go (engine is stopped at idle, then restarted so that a short elec-trical driving period is possible) and elecelec-trical driving mode (as with a hybrid powertrain). In order to improve fuel con-sumption, especially in city traffic conditions, all of these so-lutions are based on a more or less deep electrification of the car. However, with current MACs, stopping the engine means stopping the AC and vehicle occupants do not accept such a loss of comfort. Usually the only strategy for sustaining comfortable conditions is to restart the engine whilst still in idle. To solve this problem, different solutions have been investigated with
respect to the availability of electrical energy: Cooling power storage, hybrid compressors and electrically-driven compres-sors. Some of these have being introduced onto the market. For example, the two-way driven compressor has been developed for mass-produced, mild-hybrid vehicles which do not generate enough electrical power (Sakai et al., 2004). This compressor can be driven by the engine belt whilst the engine is running and by the electric motor during engine stop. An electrically-driven compressor has also been developed for mass-produced, strong-hybrid vehicles (Petitjean et al., 2000; Takahashi et al., 2004). Even if the engine stops, the air-conditioning can still be operated efficiently.
A third trend is to change the energy source of the power-train by replacing the internal combustion engine with a fuel cell. MACs adapted to this type of powertrain will benefit from the high level of electrical power available and will be able to compensate long stop & go as well as heating or cooling deficits of the cabin. One example exists in Japan, where there is a fuel cell vehicle equipped with electrical hermetic CO2 heat pump systems.
Adapted efficient MACs will be a key issue for the market-ability of these new powertrains. Methods to qualify efficiency or fuel consumption will have to be adapted to take into account both the special energy management of this new type of power-train and the adapted driving cycle, especially in city traffic.
6.4 Technical options for reducing direct and indirect emissions
Concerns about global warming associated with HFC-134a emissions mean that the impact of the MAC industry on an-thropogenic greenhouse gas emissions needs to be assessed.
Table 6.7. Evolution of air-conditioned vehicle fleets in China (Hu, Li and Yi, 2004).
1995 1996 1997 1998 1999 2000 2001 2002
Air-conditioning automobile(1) 1650 2090 2650 3210 3900 4700 5530 6430
population(2) (thousand units)
CFC-12 air-conditioning automobile 1590 1930 2330 2590 2770 2910 2920 2760
population (thousand units)
HFC-134a automobile population 60 160 320 620 1130 1790 2610 3670
(thousand units)
(1) automobiles = vehicles including buses, trucks and cars. (2) population means fleet
Table 6.8. Evolution of the annual sales of air-conditioned cars in India (Kanwar, 2004).
Year 1996 1997 1998 1999 2000 2001 2002 2003
Car(1) AC sales (thousand units) 202.5 259 278.2 369.6 464.9 459.8 488.6 616.2
This involves assessing both industry emissions and proposed emission-reduction initiatives for their environmental impact and cost-effectiveness. Such initiatives include improving the current system as well as investigating possible alternative re-frigerant systems with a lower climate impact.
6.4.1 Improved HFC-134a systems
HFC-134a systems can be improved in two ways. Firstly by im-proving the containment of the refrigerant and secondly by in-creasing the energy efficiency. Improvements to the HFC-134a system are concerned with optimizing current systems and not in developing a completely new design.
6.4.1.1 Improved leak tightness
The future European Union F-Gas regulation will limit maxi-mum annual emissions. This will lead to significant new efforts for improving the leak tightness of MAC systems.
At present there is not an agreed leakage test method to guarantee the leakage rate of an MAC system installed in a car. Each supplier of compressors, condensers, evaporators, hoses, etcetera, has their own methodology, using trace gases such as helium, for checking the leak tightness of their components. SAE standards (SAE, 1989, 1993) define a test method for hose permeation but none of these permit certification of the emis-sion level of AC systems installed in a car. Several projects are underway to define a certification method that can ensure the certified level of refrigerant emissions. Various publications (Clodic and Fayolle, 2001; Clodic and Ben Yahia, 1997) indi-cate a large range of leakage rates depending on the technol-ogy used for hoses, compressor shaft seals and service valves. A certification method will certainly need to be developed for each component: The refrigerant lines, the two heat exchang-ers and the compressor. Complementary calculations from test results are necessary to predict annual emission. Moreover, the leak rates depend on the refrigerant pressure and so in turn on the climatic conditions under which the car operates throughout the year.
6.4.1.2 Servicing issues and vehicle end of life
In developed countries car servicing is performed by at least three categories of garage: After-sales service from car manu-facturers, private garages and specialized networks servicing only certain parts of vehicles (batteries, exhaust pipes, brakes, tyres). Europe now has specialized networks for MAC servicing. In the USA the MACS Association (Mobile Air-Conditioning Society) has developed a training programme which has gen-eralized recovery systems in nearly all garages in line with the US regulation which has made the recovery of CFC-12 manda-tory since 1992 and HFC-134a mandamanda-tory since 1996. In order to significantly reduce service-related emissions, technicians should be trained to use a recovery and recharge system with near zero emissions as a standard procedure. Leak detection with high sensitivity leak detectors (in the range of 1 g yr-1) and sufficient knowledge to fix the leaks when found, are
comple-mentary steps towards realizing low refrigerant emissions dur-ing servicdur-ing. Nevertheless many of these steps forward can be compromized by end-users recharging MACs themselves if disposable cans of HFC-134a are available. The global emis-sions related to these practices are high, and disposable cans of HFC-134a will be forbidden by new EU regulation.
In many European countries, recovery during servicing is not yet mandatory and this might result in high emissions. However, good practices have been adopted in many after-sales service garages and specialized networks, which systematically use standard recovery equipment when the circuit needs to be opened.
The increased use of air-conditioned cars in developing countries requires the training of servicing personnel and the availability of recovery/recycling equipment. The current phase out of CFC-12 has permitted the implementation of good prac-tices in some developing countries, but a number of efforts are still needed to avoid large emission rates due to poor servicing practices.
Looking to the future, the aim is to produce very low-emis-sion HFC-134a systems by decreasing the level of AC system leak tightness to the extent that no recharge is required during the system’s lifetime.
The recovery of refrigerant at vehicle end of life could be integrated into the global management of the recycling process of cars. Such a global recovery and recycling process would significantly reduce the additional cost associated with refrig-erant recovery. At the EU level, refrigrefrig-erant recovery will be in-tegrated in the End-of-Life Vehicle Directive (OJEC, 2000). 6.4.1.3 High efficiency systems
As indicated in section 6.3.4, a number of programmes are un-derway to achieve better control of compressor power. Despite this, see (Benouali et al., 2003c; Benouali et al., 2003a), the co-efficient of performance (COP) measured under realistic condi-tions (typical driving condicondi-tions) is low, 1.3−1.4 for an outdoor temperature of 35°C. The use of an external control compressor yields significant gains in the range of 25−35% on the COP, even if the mechanical efficiencies of external control compres-sors are in the same range as internal control comprescompres-sors. Up until now systems have been designed for low cost, reliability and cooling capacity but not for energy efficiency. A number of improvements can still be realized in the development of high efficiency compressors. Improvements in the evaporator and condenser design as well as the control system will result in better airflow management and therefore energy efficiency.
With respect to energy efficiency improvements, progress could be made in standardizing the measurement of energy con-sumption due to MAC operation in order to facilitate the com-parison of technical proposals (see section 6.3.4).
6.4.1.4 LCCP/TEWI
To calculate Life Cycle Climate Performance (LCCP), all types of emissions over the entire cycle should be taken into account, including energy consumption related to refrigerant production,
direct emissions throughout the lifetime and indirect emissions due to energy consumption by the AC system. For HFC-134a AC systems, a number of publications (UNEP, 2003; Barrault et al., 2003; Schwarz and Harnisch, 2003) indicate that the most significant parameter is the direct emission level. Depending on the recovery policy, the annual refrigerant emissions for cur-rent systems are estimated to be 0.106−0.266 kg yr-1 leading to 138−345 kg CO2-eq yr-1.
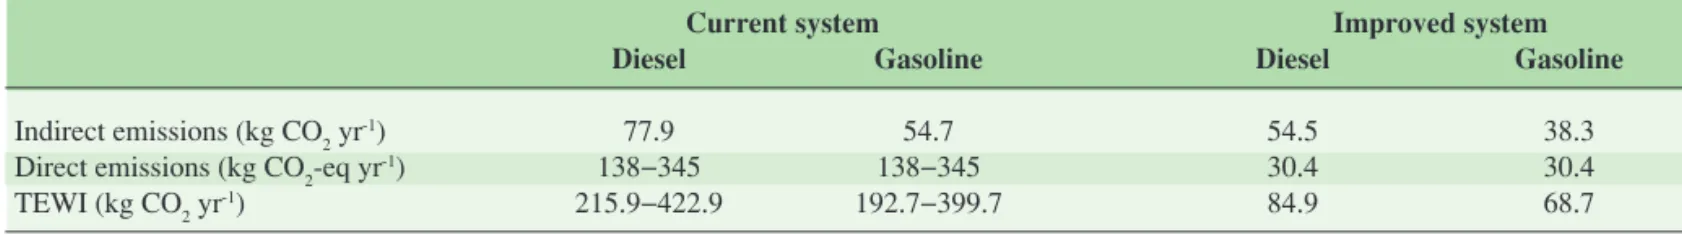
If the previous results of CO2 emissions related to MAC operation and those different emission levels are taken into ac-count (see section 6.2.2), the total equivalent warming impact (TEWI) of a given MAC system can be calculated. Table 6.9 presents an example of TEWI calculations for gasoline and die-sel engines for a MAC system operating in the Frankfurt area. Table 6.9 summarizes possible gains on indirect emissions due to energy consumption and direct emissions of refrigerant. Considering the extreme values, it can be seen that refrigerant emission reductions can be a highly effective method for reduc-ing emission impacts. However, at this stage it has yet to be demonstrated that MAC systems can be designed with servic-ing limited to ruptures and accidents.
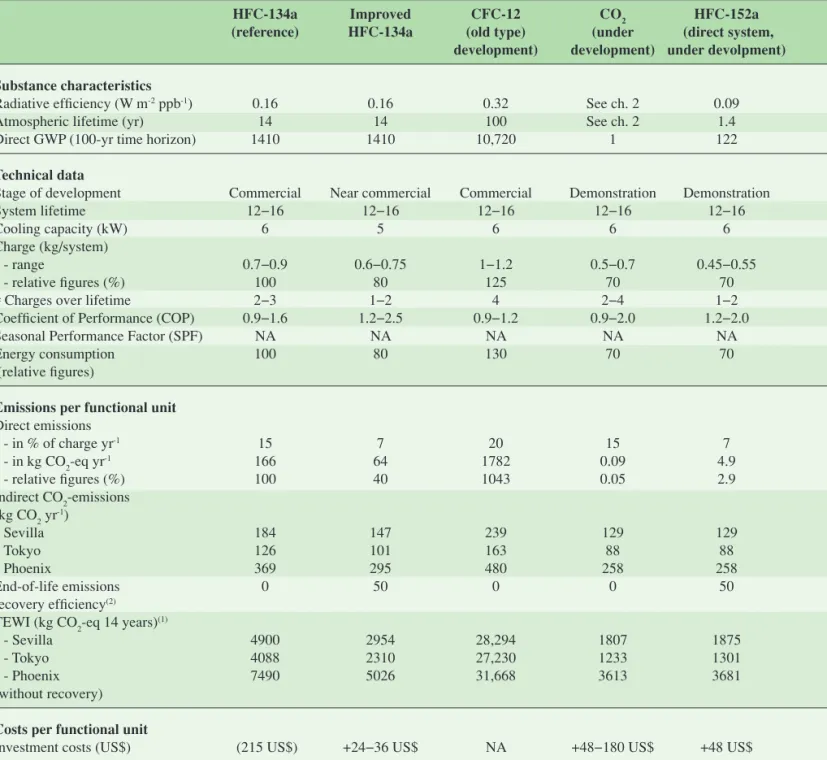
Based on current knowledge of possible energy efficiency improvements as well as reduction of emissions, Table 6.10 compares the old CFC-12 and the current HFC-134a systems to the improved HFC-134a, CO2 and HFC-152a systems.
6.4.2 CO2 systems
6.4.2.1 Description of system
Carbon dioxide has zero Ozone Depletion Potential (ODP). Its GWP of 1 is negligible compared to the GWP of HFC-134a. Moreover, there is no need to specifically produce carbon diox-ide, since it can be recovered from industrial waste gas. Carbon dioxide (when used as refrigerant it is called R-744) is cheap, readily available in sufficient quantities throughout the world and its properties are well known and documented. If used as refrigerant there is no need for recovery, which would neces-sitate servicing, and the recycling cost would be totally elimi-nated. The refrigerating equipment safety standard (ASHRAE 34, EN-378) classifies CO2 as an A1 refrigerant, a non-toxic and non-flammable refrigerant. But if accidentally lost in large quantities, CO2 has a certain asphyxiation risk that needs to be mitigated by engineering systems. A refrigeration cycle with carbon dioxide as refrigerant operates at comparatively high pressures (5–10 times higher than HFC-134a systems).
However the safety risk of these high pressures is comparable to current HFC-134a systems due to the small volume used and the low refrigerant mass of the system.
As the critical temperature is approached or even exceeded, the ideal cycle efficiency decreases with increasing high-side pressure. On an ideal basis, the efficiency of a transcritical CO2 cycle is unfavourable compared with that of a HFC-134a cycle. However, for real cycles this is compensated by the favourable transport properties of CO2 (high heat transfer and low pres-sure loss), the inclusion of an internal heat exchanger and the improved compressor efficiency due to low pressure ratios. Under normal operating conditions for vehicle air-conditioning systems the carbon dioxide cycle often operates in the ‘tran-scritical’ mode due to the low critical temperature (31°C). For example, Pettersen (1994) showed that the high-side pressure influences the COP of the system and there is an optimum pres-sure for this. He suggested that during normal operation a high-side pressure close to the optimum pressure should be selected in order to maintain a satisfactory COP. This means the pressure should be kept at a certain level dependent on the heat rejection temperature (ambient air temperature).
A special flow circuit enabling efficient operation and high-side pressure control has been designed and patented by Lorentzen et al. (1993) (see also Lorentzen and Pettersen, 1993). This particular refrigeration cycle is shown in Figure 6.6 and serves as the worldwide basis for the majority of car AC systems which use carbon dioxide as a refrigerant. The p-h dia-gram in Figure 6.6 depicts two different high-side pressures for different control conditions for which the compression process has been calculated with the same isentropic efficiency.
Table 6.9. Example of TEWI calculations for a MAC system operating in the Frankfurt area (Barrault et al., 2003).
Current system Improved system
Diesel Gasoline Diesel Gasoline
Indirect emissions (kg CO2 yr-1) 77.9 54.7 54.5 38.3
Direct emissions (kg CO2-eq yr-1) 138−345 138−345 30.4 30.4
TEWI (kg CO2 yr-1) 215.9−422.9 192.7−399.7 84.9 68.7 enthalpy curves of constant temperature 73.8 pressure bar
Figure 6.6. Refrigeration cycle and pressure-enthalpy diagram of the transcritical cycle commonly used for car applications (Lorentzen and Pettersen, 1993).
With this refrigeration cycle the high-side pressure can be controlled, for example, by an electronic expansion valve. Each high-side pressure corresponds to a particular refrigerant charge circulating in the cycle. The receiver located between the evap-orator and the internal heat exchanger on the low-pressure side stores the refrigerant charge which is not needed for the par-ticular operating condition. The presence of the internal heat exchanger provides protection for the compressor from liquid slugging and may yield to an increased cooling capacity at high
ambient air temperature conditions.
A CO2 refrigeration cycle different from the Lorentzen/ Pettersen cycle approach was used by Sonnekalb (2002) (see also Sonnekalb and Köhler, 2000) for bus AC systems which use carbon dioxide as refrigerant. Based on the fact that the COP compared with high-side pressure curve is relatively flat, Sonnekalb designed a low-cost CO2 system for bus air-con-ditioning. This system (which can be seen in Figure 6.7) has only four major components with a fixed refrigerant charge.
Table 6.10. Comparison of MAC options.
HFC-134a Improved CFC-12 CO2 HFC-152a
(reference) HFC-134a (old type) (under (direct system,
development) development) under devolpment)
Substance characteristics
Radiative efficiency (W m-2 ppb-1) 0.16 0.16 0.32 See ch. 2 0.09
Atmospheric lifetime (yr) 14 14 100 See ch. 2 1.4
Direct GWP (100-yr time horizon) 1410 1410 10,720 1 122
Technical data
Stage of development Commercial Near commercial Commercial Demonstration Demonstration
System lifetime 12−16 12−16 12−16 12−16 12−16
Cooling capacity (kW) 6 5 6 6 6
Charge (kg/system)
- range 0.7−0.9 0.6−0.75 1−1.2 0.5−0.7 0.45−0.55
- relative figures (%) 100 80 125 70 70
# Charges over lifetime 2−3 1−2 4 2−4 1−2
Coefficient of Performance (COP) 0.9−1.6 1.2−2.5 0.9−1.2 0.9−2.0 1.2−2.0
Seasonal Performance Factor (SPF) NA NA NA NA NA
Energy consumption 100 80 130 70 70
(relative figures)
Emissions per functional unit Direct emissions - in % of charge yr-1 15 7 20 15 7 - in kg CO2-eq yr-1 166 64 1782 0.09 4.9 - relative figures (%) 100 40 1043 0.05 2.9 Indirect CO2-emissions (kg CO2 yr-1) - Sevilla 184 147 239 129 129 - Tokyo 126 101 163 88 88 - Phoenix 369 295 480 258 258 End-of-life emissions 0 50 0 0 50 recovery efficiency(2)
TEWI (kg CO2-eq 14 years)(1)
- Sevilla 4900 2954 28,294 1807 1875
- Tokyo 4088 2310 27,230 1233 1301
- Phoenix 7490 5026 31,668 3613 3681
(without recovery) Costs per functional unit
Investment costs (US$) (215 US$) +24−36 US$ NA +48−180 US$ +48 US$
(1) The GWP values used for the calculations are taken from the Second Assessment Report (IPCC, 1996).
(2) Recovery has not been taken into account for the TEWI calculations, due to large uncertainties of the recovery effectiveness and so the average direct
Sonnekalb showed that it is possible to operate this particular cycle over a wide range of ambient air temperatures close to the maximum COP without a high-side pressure control. Figure 6.7 presents on the right-hand side a charge-ambient air tempera-ture diagram with the optimal COP curve. The range of a 5% or less decline of this optimal COP can also be seen as a shaded area. The dashed horizontal line in the diagram shows that it is possible to cover a wide range of ambient air temperature conditions with a fixed charge whilst incurring only minor COP losses (5% or less).
In the years 1996 and 1997 two CO2 prototypes based on this cycle were installed in standard city buses in Bad Hersfeld, Germany. By the end of 2003 the AC systems of these two bus-es had together accumulated more than 4000 running hours on the road, indicating that this CO2 system is technically and eco-nomically feasible for bus AC (for more details see also Köhler et al., 1998 and Foersterling et al., 2002).
Since 1997 prototype CO2 systems have been demonstrated by many vehicle manufacturers and their suppliers in a wide range of vehicles (Wolf 2004). For example, BMW successful-ly ran a small test fleet of 7 vehicles with prototype AC systems between 2000 and 2002 (Mager 2002). Toyota have also run a first fleet test in Japan and the USA using approximately 15 fuel cell hybrid vehicles .
If used in a heat pump mode, CO2 has a superior refriger-ant performance (see for example Heyl and Fröhling, 2001 or Hesse et al., 2002). Modern fuel-efficient direct injection gaso-line or diesel engines may not have enough waste heat to suffi-ciently heat the passenger compartment. Additional heaters (for example positive temperature coefficient (PTC) heaters, fuel burners, or other technologies) increase fuel consumption and CO2 emissions. The CO2 heat pump might be an attractive fu-ture alternative with respect to performance, energy efficiency and total cost (AC plus heater). More research is needed to de-termine which is the most suitable for car application.
In summary, CO2 systems need a new design for all compo-nents (compared to usual HFC-134a technology). This involves an ongoing learning process.
6.4.2.2 Energy efficiency
Carbon dioxide is a typical high-pressure refrigerant with a cor-respondingly high volumetric cooling capacity. Therefore, com-pared to low-pressure HFCs, higher cooling capacities can be achieved in a given volume. This results in excellent cool down curves (or heat up curves for the heat pumps) as demonstrated, for example, by Vetter and Memory (2003). However, com-paring the energy efficiency and fuel consumption of a carbon dioxide and corresponding HFC system is far more difficult. From the results in a number of publications it can be surmised that compared to an improved HFC-134a system, carbon diox-ide has a comparable or even better COP and a correspondingly lower fuel consumption, especially for lower ambient air tem-peratures. At high ambient air temperatures, improved HFC-134a systems have advantages at lower compressor speeds. Based on measurements made by Hrnjak (2003), Wertenbach (2004) calculated the AC energy demand for typical European and US driving cycles. His results show different energy de-mands for Europe and the USA are due to the selected running time in the drive cycles and the different climatic conditions. Nevertheless the energy efficiency benefits of the systems are about the same for Europe and the USA. Compared to a base-line HFC-134a system, an improved HFC-134a system showed 23% less energy demand whereas an efficiency-optimized CO2 system showed about 30% less energy demand. Hafner et al. (2004) obtained comparable results in their energy analysis.
Compared to HFC-134a, CO2 has a disadvantage of low ef-ficiency at idling and high load conditions. Compact vehicles are generally at a disadvantage as far as the refrigeration cycle efficiency is concerned compared to medium or large vehicles. This is due to space constraints which limit the condenser and evaporator sizes. Actual vehicle tests have shown that in com-pact vehicles, the increase in compressor power consumption with CO2 has an adverse effect on vehicle driving characteristics such as acceleration and fuel economy, even though equivalent or better cooling performance can be maintained (Kobayashi et al., 1999). Further technical developments are required for CO2 compact vehicles to counteract this. An ejector, which can recover the expansion energy and reduce the compressor power might be a potential solution (Takeuchi et al., 2004).
6.4.2.3 Cost
The real cost of a CO2 AC system (or the additional cost com-pared to current AC systems) is hard to estimate as the CO2 sys-tem has not yet entered mass production. The additional costs compared to a current system are expected to be between 48 and 180 US$ (Mager et al., 2003; Barrault et al., 2003; NESCCAF, 2004) for the first generation of mass-produced systems. No cost data are available regarding the conversion of the service system.
6.4.2.4 LCCP/TEWI
Aspects concerning the certainty of energy efficiency also apply to calculations of the Life Cycle Climate Performance (LCCP) or the Total Equivalent Warming Impact (TEWI). The results
25 30 35 40 45 50 55 60 65 ambient air temperature [ºC]
5% or les COP decline curve of maximum COP
fixed charge
Figure 6.7. Refrigeration cycle and charge-ambient air temperature diagram of a low-cost transcritical cycle used for bus applications (Sonnekalb, 2002).
from different publications are not always comparable, as the specific results depend strongly on the assumptions made. In an LCCP study, Hafner et al. (2004) compared an improved HFC-134a system with a corresponding CO2 system (based on mea-sured data published by Hrnjak, 2003). The authors assumed NEDC and US FTP 75 driving cycles. The total hours with AC on were based on regional climate data and usage profiles provided by Sand et al. (1997) and Duthie et al. (2002). The direct HFC-134a emissions were calculated assuming total sys-tem losses of 60 g yr-1. The end-of-life recovery was assumed to be 80%. The authors also took into account the 77 kg CO2 -eq emissions caused by the production of 1 kg of HFC-134a (see Campbell and McCulloch, 1998). The authors analyzed the LCCP of the HFC-134a and the CO2 systems for different climatic regions in the USA and Europe. Their results show a 17−49% reduction in LCCP for the CO2 system compared to the improved HFC-134a system. Table 6.10 shows a reduction of nearly 40% in the LCCP for the CO2 system.
6.4.2.5 Leakage rate of complete system
Froehling et al., (2003) assessed the upper acceptable limits of refrigerant leakage. He assumes that the operating time of CO2 AC systems without recharging should be about 6 years. This leads to an annual emission rate of 25g or less, half of which is related to the shaft seal of the compressor. Additional research and development on low leakage hoses and fittings, compressor shaft seals, durability and accurate methods of leak rate mea-surements is currently being undertaken to realize this goal. 6.4.2.6 Reliability
Air-conditioning with CO2 is a new system and virtually all of the components need to be redesigned. In terms of reliability the main tasks to be completed are:
• Development of economical, leak-tight CO2 hoses and com-pressor shaft seals;
• Demonstration of reliability under real-world conditions; • Development of service and maintenance best practices. In order to ensure uniform quality and reliability, a workgroup of German OEMs has proposed a component specification Standard CO2 AC System (Mager et al., 2004). This specifica-tion defines the main and auxiliary components of the system and sets their operating conditions, performance and limits. 6.4.2.7 Safety
Due to the high pressure of the CO2 systems risks of rupture which could lead to burst hazards must be mitigated. The basic design concept of car air-conditioners is described in SAE J639 (SAE, 1999). CO2 car air-conditioners are currently being stan-dardized and the revisions of the set values for safety devices such as the design pressure, proof pressure and pressure relief valve took into account the significant pressure levels that can arise in CO2-refrigerant car air-conditioners (Kim et al., 2003; Wertenbach, 2004).
Leakage of CO2 into the passenger cabin creates risks of
impairment. The US EPA allows 6% v/v and 4% v/v as upper boundary limits for exposure of up to 2 minutes and 60 minutes respectively and specifies that the exposure should not exceed 6% under any circumstance. An active safety system, such as a refrigerant-based sensor safety concept (which is also currently under scrutiny for flammable refrigerants), might not be effec-tive enough due to uncertainties about the sensor, its location and the actuators behind the sensor. The VDA ad hoc work-ing group of car manufacturers has proposed a passive safety concept based on supplementing the standard specifications mentioned in Section 6.4.2.6. These additional specifications would cover all AC systems from manual to automatic control and would consider all vehicle operating conditions (Rebinger, 2004). This passive safety concept is based on the so-called ‘safe evaporator’, which means a negligible risk of leaking or bursting under any operating condition of the car.
As well as the aforementioned issues, the safety of the ‘ser-vice’ offered in the marketplace – how to handle CO2 safely – is another important safety issue. Devices such as a ant charging machine, which can read the amount of refriger-ant from bar-coded information in the service manual and au-tomatically charge CO2, have already been developed (Lorenz, 2002).
6.4.3 HFC-152a systems
6.4.3.1 Description of a direct expansion system
HFC-152a systems are identical to the current HFC-134a sys-tem, but may have added safety features, such as solenoid valves or discharge devices.
A direct expansion HFC-152a system was demonstrated at the 2002 SAE Alternate Refrigerants Symposium (SAE, 2002a). This was a joint venture between theUS government, a major car manufacturer and a major MAC system supplier (Andersen et al., 2002). The large vehicle system contained just 0.45 kg of refrigerant and compared to the equivalent current HFC-134a system it showed a better cooling performance for high loads and a comparable cooling performance for low loads. In a direct refrigerant replacement with no component changes, HFC-152a showed a 3−17% lower energy usage than HFC-134a and was on average about 10% lower (Ghodbane et al., 2003).
Leakage of HFC-152a into the passenger cabin creates risks of fire. The US EPA allows 3.7% v/v for up to 15 s as an upper boundary limit in any part of the free space of the passenger cabin.
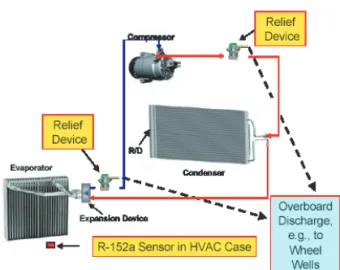
The safety system (Figure 6.8) consists of an HFC-152a sensor, mounted in the evaporator case, capable of detecting the presence of HFC-152a. If detected above a threshold level, a signal is sent to a controller, which activates a directed relief mechanism. The relief mechanism consists of two squib-initi-ated discharge devices, one on the high-pressure side and one on the low-pressure side of the system. The discharged refriger-ant is directed away from the vehicle by hoses attached to the discharge devices. Therefore, the system is designed to safely discharge the refrigerant away from the vehicle when leakage
is detected or a vehicle crash situation occurs. In the case of a crash, the discharge would be activated by the airbag crash-sensing system. Such a discharge quickly reduces the pressure in the system. This rapidly eliminates the driving force (pres-sure) for unwanted leakage elsewhere, thereby reducing any risk. The sensing system is capable of continuous monitoring when the vehicle is being driven and intermittent monitoring when the vehicle is parked.
In the event of a leak into the passenger cabin the safety sys-tem is reported to be able to discharge the refrigerant so fast that no significant amount of HFC-152a enters the passenger cabin. 6.4.3.2 Description of a HFC-152a indirect system
At the 2003 SAE Alternate Refrigerants Symposium (SAE, 2003), a direct expansion HFC-152a system and a secondary loop HFC-152a system were demonstrated (Ghodbane and Fernqvist, 2003).
The secondary loop system (Figure 6.9) was jointly dem-onstrated by a major European car manufacturer and a major MAC system supplier (Ghodbane and Fernqvist, 2003). The system was demonstrated on a Sport Utility Vehicle (SUV) with front and rear evaporators. A secondary loop system (Figure 6.9) would overcome the concern of leakage into the passen-ger cabin by allowing the refripassen-gerant to be contained under the hood where it is completely separated from the passenger compartment. The refrigerant cools a chiller (liquid-liquid heat exchanger), which, in turn, chills a water-glycol mixture that is then pumped into the passenger cabin heat exchanger(s) for cooling. This system would use the same components as the current HFC-134a system, with the addition of a chiller and liquid pump. It would therefore require a limited capital invest-ment. For the dual evaporator SUV, the HFC-134a charge was 1.3 kg compared to just 0.59 kg of HFC-152a for the secondary loop system – a significant reduction. This vehicle had one of the highest cooling performances of all of the vehicles demon-strated at the symposium.
From an energy perspective, a secondary loop requires about 10% more energy than a direct system. However, the great-er engreat-ergy efficiency of HFC-152a compared to HFC-134a (about 10%) would result in comparable cooling performance with comparable energy efficiency (Ghodbane and Fernqvist, 2003).
From a general safety perspective, the small amount of HFC-152a refrigerant needed, combined with its relatively low flammability and an effective safety system such as those de-scribed above, would result in a vehicle that would be both safe to drive and safe to park in a garage. Of course, safety during vehicle servicing and repair must also be considered.
6.4.3.3 Energy efficiency
The HFC-152a system described in 6.3.3.1 was an HFC-134a system that was first tested with HFC-134a and then simply charged with HFC-152a to provide a direct comparison with no component changes. HFC-152a provided better cooling (2– 3oC) and used 7–20% less energy than HFC-134a, reinforcing the results of the 2002 study. This vehicle had one of the highest cooling performances of all of the vehicles demonstrated at the symposium.
6.4.3.4 System costs and availability of HFC-152a
At present, only relatively small amounts of HFC-152a are pro-duced globally; the major manufacturer is in the USA. Three manufacturers producing small quantities exist in China and one in Japan. Production capacity would have to be developed for HFC-152a to be used in MAC systems and with the necessary capital investment this would take several years to achieve.
Due to the simpler processing, HFC-152a ought to cost less than HFC-134a. However, the MAC system would cost an ad-ditional 25–48 US$ to cover the cost of the safety system for a
Figure 6.8. Direct HFC-152a System with Safety System.
direct system or the additional cost of the secondary loop for an indirect system.
6.4.3.5 LCCP, TEWI
HFC-152a has been proposed as a replacement for HFC-134a because its global warming potential is about 10 times lower and it can be used with current HFC-134a components without any major modification (Baker et al., 2003; Ghodbane, 2003; Scherer et al., 2003).
HFC-152a has been assigned a GWP of 122 as opposed to 1410 for HFC-134a leading to a reduction in global warming impact of more than 90%. Moreover, the lower liquid density of HFC-152a compared to HFC-134a implies a refrigerant charge that is only 65% of the reference HFC-134a charge. For exam-ple, an HFC-134a system using 0.5 kg would be replaced by an HFC-152a system using 0.325 kg. This reduction in refrigerant charge will lead to lower emissions in the event of rupture and at vehicle end of life. The greater energy efficiency of the HFC-152a over HFC-134a would result in enough fuel savings to offset the GWP of 152a. The net result of replacing HFC-134a with HFC-152a would be the elimination of the direct cli-mate impact associated with current HFC-134a MAC systems. This has also been shown by Hafner et al. (2004). Table 6.10 shows a reduction of almost 40% in LCCP for the HFC-152a system compared to an energy-optimized HFC-134a system. 6.4.3.6 Safety aspects of future vehicle air-conditioning
systems
HFC-152a is a moderately flammable gas and is listed by the American Society of Heating, Refrigerating and Air-Conditioning Engineers (ASHRAE) Standard 34 (ASHRAE, 2001) as a Class A2 refrigerant, defined as being of lower flam-mability than Class A3 (hydrocarbons such as propane). As a reference, HFC-134a is Class A1, low toxicity and non-flam-mable. The flammability of HFC-152a will probably require added safety features such as those described below.
HFC-134a systems and the CFC-12 systems they replaced, are considered safe for the intended use. Replacement refrig-erant systems must also provide a comparable level of safety for both vehicle occupants and service technicians. SAE J639 (SAE, 1999), SAE J1739 (SAE, 2002b) and refrigerant manu-facturer’s safety data information all serve as reference docu-ments for designing safe systems. The latest draft of SAE J639 (SAE, 1999) provides an example of the conditions for safe de-sign that must be met. For example, ‘For refrigerants contained in components that are located within the passenger compart-ment, or in direct contact with passenger compartment airflow (e.g., evaporators and associated lines and fittings), system de-sign shall be such that neither a harmful nor a flammable condi-tion will result from a release of refrigerant into the passenger compartment.’.
SAE J1739 (SAE, 2002b) requires a safety assessment of proposed systems (by Failure Mode and Effects Analysis us-ing the Risk Priority Number) for the purpose of identifyus-ing all anticipated events that result in safety concerns and then taking
appropriate preventative, or mitigating action.
In addition, all regional, national and local regulations and codes for the safe handling of new refrigerants and new refrig-erant systems must be satisfied (e.g., flammability and pressure vessel requirements). Managing costs and risks will be an im-portant part of implementing alternatives.
6.4.4 HC-blend systems
In Australia and the USA, hydrocarbon blends, mostly HC-290/600a (propoane/isobutane) blends, have been introduced as drop-in refrigerants to replace CFC-12 and to a lesser extent for HFC-134a. The real number of cars that have been retro-fitted with such HC refrigerant blends is unknown. Maclaine-Cross (2004) has estimated that it is about 330,000 vehicles in Australia, although no data exist to confirm this. No accidents have been reported to date. These retrofits with HCs are legal in some Australian states and illegal in others and in the USA. US EPA has forbid the uses of HCs for retrofit but has considered the possible use of HCs for new systems, providing safety is-sues are mitigated.
HCs or HC-blends, when correctly chosen, present suitable thermodynamic properties for the vapour compression cycle and permit high energy efficiency to be achieved with well-designed systems. They have zero ODP and low GWPs, but their high flammability (lower flammability limit in the range of 1.8−2.1% v/v) means that they have not been considered by car manufacturers.
Some studies have been carried out using hydrocarbons in indirect systems, in which a water-glycol circuit provides cool-ing capacity in the cabin. This water-glycol coolant is in turn refrigerated by the refrigerating system using hydrocarbons (same system as the secondary loop system presented above for HFC-152a). Nevertheless, even with indirect systems, HCs are not seen by vehicle manufacturers as replacement fluids for mass-produced AC systems.
6.4.5 Alternative technologies to vapour compression
There are two types of alternative technologies: The Brayton-Joule air cycle and a number of heat-generated cooling sys-tems.
6.4.5.1 Air cycle
The air cycle has been thoroughly investigated by Bhatti (1998). Even if air is used as a refrigerant, with a zero GWP, the energy efficiency of the system is very low. Calculations of air cycle efficiency compared to the current HFC-134a system show an energy penalty of about 35%. Nevertheless, from the TEWI analysis the author concludes that the amount of CO2 emitted per year is in the same range (303 kg CO2 for the air cycle com-pared with 282 kg CO2 for current HFC-134a systems). 6.4.5.2 Metal hydrides
dif-ferent cooling cycles using the available heat from the exhaust gas. A first approach is the use of a metal hydride heat pump which makes use of the adsorption and desorption of hydrogen by metals. Desorption is an endothermic reaction and so ab-sorbs heat, whereas adsorption is exothermic and releases heat. Metal hydride systems are interesting due to the small number of moving parts. No refrigerant is needed but the COP is sig-nificantly lower, in the range of 0.4−1.5. The possible heat re-covery from the exhaust gas is also interesting. A first prototype has been developed in the USA, with a 5 kW AC system. The system weight was 22 kg and the COP was 0.33.
6.4.5.3 Absorption systems
Absorption systems that use either ammonia water or water-LiBr as working solution are well known. These systems use mainly heat but they need electrical energy for the fans and pump. The main drawback of absorption systems for cars is the heating-up time needed before cooling capacity can be pro-duced to create the temperature level necessary in the boiler to produce refrigerant vapour. This system therefore needs a re-frigerant storage as well as a minimum operating time of about half an hour before efficient cooling operation.
6.4.5.4 Adsorption zeolite systems
Zeolite systems are similar to metal hydride systems but use zeolite and water instead of metal hydride and hydrogen. The adsorption / desorption cycles usually need several separate re-action chambers for successive cycles in order to reach pseudo-continuous operation. Studies have been actively carried out for electrical vehicles using a burner to operate the AC system. The COP is considered to be relatively low (0.3−1.2). No prototype has been built in real cars in order to verify the performances.
6.4.5.5 Thermo-acoustics
Sound waves create small temperature oscillations. If those oscillations release or absorb heat within a regenerator, a sig-nificant temperature difference can be realized between the hot and the cold ends. A resonant cavity is used to enhance the ef-ficiency of thermo-acoustics systems. A COP up to 2 has been achieved on a laboratory test bench. However, the integration of the system into cars could be difficult due to the possible size of system needed for a capacity of about 3 kW.
6.5 Heat-load reduction and new design of AC systems
Independent of the vapour compression system, research is un-derway to improve comfort conditions in car cabins. If energy consumption is not integrated as a constraint in those develop-ments then it might be compromized by them. For example, panoramic roofs may increase heat loads in the cabin, but devel-opment of efficient reflecting glasses can mitigate the extra heat loads while improving the vision of car passengers. New de-signs such as ventilated seats associated with heating and cool-ing systems may lower the needed coolcool-ing or heatcool-ing capacity, due to a far more effective diffusion of cooling or heat close to the body. Insulation of the car itself may have contradictory ef-fects for summer and winter conditions and compromises will have to be found in order to improve the fast heat-up of the vehicle in the winter and fast cool-down in the summer. The AC system and car cabin must be jointly designed to achieve thermal comfort and low energy consumption.