Journal of Applied Food Technology
H o m e p a g e : h t t p s : / / e j o u r n a l 2 . u n d i p . a c . i d / i n d e x . p h p / j a f t
Optimization of Coffee-Clove-Ginger Formulated Powder Based on
Antioxidant Activity and Physicochemical Properties
Arisa Puji Lestari, Anang Mohamad Legowo, Siti Susanti*
Department Food Technology, Faculty of Animal and Agricultural Sciences, Diponegoro University, Semarang, Indonesia
*Corresponding author ([email protected])
Abstract Received: 14 February 2018 Article information:
Accepted: 30 June 2018 Available online: 6 Desember 2018
Keywords: Coffee Antioxidant Physicochemical Clove Ginger
© 2018 Indonesian Food Technologists All rights reserved
This is an open access article under the CC BY-NC-ND license
doi: 10.17728/jaft.54
The development of coffee products as functional drinks is hoped to increase the popularity of coffee as a healthy drink. One way of improving is by adding spices into the coffee. The purpose of this research was to obtain optimization of coffee-spice formulated powder based on its antioxidant activity, water content, ash content, and extract content. The spices used in this research were ginger powder and cloves(1:1). In this research, the ratio of coffee:spices (%,b/b) tested varied with F0(100%: 0%), F1(95%: 5%),
F2(90%:10%), F3(85%:15%), and F4(80%:20%) each ratios underwent 4
repetitions of tests for physic and chemical properties. F0-F4 was roasted for 35
minutes at 200 °C. The results showed that all formulas except F4 had met the
SNI certifications of ground coffee. The best formula was F3 had water(6.55%),
ash content(4.72%), extract content(28.13%) was the highest(p<0.05) out of all the high varying ratio of coffee: spices formula (F4), and F3 had the lowest
IC50(22.42μg/mL). Thus the formula with the lowest proportion of spices was
considered as the optimal formula based on the water content, ash content, and extract content, whereas of antioxidant status, the formula with the highest proportion of spices was considered the best formula. The conclusion of this research was proportion of spices in the formula, the better the antioxidant status, but less optimum in terms of its other physic and chemical properties. It is hoped that the spiced coffee formula could potentially serve as a functional beverage for the community.
Introduction
Coffee as a beverage is no longer a foreign product. It has a fragrant aroma, a distinctive taste and efficacy that can stimulate the body to be more awake or refreshed that make coffee quite popular and familiar on the tongue of the people. The content in coffee that most would correlate it with is caffeine. But additionally, it also contains vitamin C, vitamin E and phenolic components that act as antioxidants (Putri and Latunra, 2013). To increase the demand of coffee products, development needs to be done. One of the ways that can be taken is by adding spices into the coffee so that it can therefore be considered as functional coffee. Functional coffee itself is called so because in it there are nutrients or non-nutrients that if being consumed, not only will it give the effect of refreshment to the body alone but also provide positive health effects for consumers. Functional drink is a functional food type that has now become a trend to
raise public awareness of the importance of consuming healthy foods.
Spices added to the coffee are natural ingredients containing active components that are strong and effective enough to provide health effects such as antioxidants known as natural antioxidants (Embuscado, 2015). In Indonesia, spices are aplenty, however, cloves and ginger have particularly high antioxidants. Cloves have high eugenol compounds and were proven to have high antioxidant properties compared to bay leaves, cinnamon, and nutmeg (Towaha, 2012). Ginger is also a rhizome that has the highest antioxidant gingerol compared with other rhizomes.
natural antioxidants become alternatives needed by humans to prevent the formation of more radicals. If humans are to use synthetic antioxidants excessively it will create toxic and carcinogenic effects (Alenisan et al., 2017). Natural sources of antioxidants are found in fruits, vegetables, and spices. In this research, the source of natural antioxidants are taken from spices (ginger and cloves).
This study was conducted to obtain optimization of coffee-spice formulated powder based on antioxidant activity, water content, ash content, and extract content. It is hoped that this study can potentially promote spiced coffee as a functional beverage for the community.
Materials and Methods
Preparation of ground coffee, cloves, and ginger
Robusta coffee beans were obtained from Banaran Plant, while cloves and ginger were obtained at Rasamala traditional market. Coffee beans and ginger were roasted together for 35 minutes at 200 ° C. Then the roasted coffee and spices, were cooled first for 5 minutes, grounded and then sifted (60 mesh) to obtain coffee powder ready to brew. It is then packed in plastics according to a predefined formula.
Making of spiced coffee formula
Spiced coffee was made in 5 different formulas wherein each formula consisted of coffee: spice with proportions of F0 (100%: 0%); F1 (95%: 5%); F2 (90%:
10%); F3 (85%: 15 %) and F4 (80%: 20%). The proportion
of ginger: cloves in the spiced coffee formula was 1: 1. Each formula underwent 4 repetitions for physic and chemical properties.
Water Content
Water content analysis, based on the work of Handayani et al. (2016), was done using oven drying method. Porcelain plate coded according to the sample code was then heated in an oven with temperature of 105 °C for 1 hour. Porcelain cup was put in desiccator for ± 15 minutes, then the cup was weighed. 2 g (initial weight) of sample was weighed in a porcelain dish with a known mass then dried at 105 °C for 4 hours. The sample was weighed, then re-heated and re-weighed until constant weight (final weight) was obtained. The weight was considered constant if the weighing difference did not exceed 0.2 mg. Sample was inserted into the desiccator for ± 15 minutes then continued with weighing. Water content was calculated by the following formula: initial weight of sample minus final weight of sample divided initial weight of sample (in gram) multiplied one hundred persen.
Ash Content
Ash content analysis, according to Legowo et al.
(2005), was done using direct method. The principle of determining the ash content in a sample was to weigh the mineral residue produced from the burning of organic matter at a temperature of about 550 °C. Determination of ash content was carried out directly by burning the materials in high temperature (500 - 600 ° C) for 2 - 8 hours and then the residue left was weighed and was
regarded as ash. The amount in the samples that underwent ash content analysis was about 2 - 5 g. Ash content was calculated by the following formula: weight of ash divided mass of sample (in gram) multiplied one hundred persen.
Extract Content
Extract content analysis was undertaken based on SNI (1996) modification and Panggabean et al. (2013) gravimetric method. Approximately 1 g (w0) of sample
was weighed and dissolved in 150 ml of hot aquadest, then filtered with filter paper. However, before it was used, the filter paper had been first heated at 100 °C for 1 hour, then left in the desiccator for ± 15 minutes and then weighed. After filtration, the filter paper containing residue had been dried in a 105 °C oven for 3 hours, left in desiccator for ± 15 minutes and then weighed (w1).
The extract content was calculated by the following formula: sample weight – dry weight left in desicator divided dry weight left in desicator (in gram) multiplied one hundred persen.
Antioxidant Activity
One common method used in antioxidant testing is to use 2,2-diphenyl-1-picrylhydrazyl (DPPH). Testing of antioxidant activity was undertaken through analysis of different volume measurements of sample using micropipette with volumes of 30, 60, 90, 150 μL. The different volumes of sample were put into test tubes and added with 3.8 mL DPPH μM then put in the centrifuge and left for 30 minutes in the dark. The absorbance of the solution was then measured at a wavelength of 515 nm using a UV-VIS spectrometer (Andayani et al, 2008). Tests were performed on functional coffee samples. The antioxidant activity (IC50) was calculated according to the
linear equation between concentration and sample absorbance.
Data Analysis
The results of antioxidant activity test were analyzed descriptively. The results of moisture content, ash content, and extract content were analyzed by using
Analysis of Variance (ANOVA) at α = 5%. If there was a real difference then the analysis was continued with
Duncan Multiple Range Test (DMRT) test to find the difference between each treatments. Organoleptic results data were analyzed using Kruskall Wallis non parametric test at α = 5%.
Results and Discussion
Results of variable testing of water content, ash content, extract content, and antioxidant activity are illustrated in Table 1.
Water Content
powder with a maximum of 7%.However, F4 had a water content of 7.49% which did not meet the standard water content of ground coffee.
Water content of F4 formula was higher than that of F0-F1. It is suspected that the reason behind it was because the ingredients of spices (cloves and ginger) were used too much and still contained significant amount of water affecting the water content of coffee powder itself. According to Nurdjannah and Bermawie (2012), dry cloves had water content of 6.5% and Vasala (2012) stated that the water content of dried ginger was commonly 7%. Thus, the more cloves and ginger that still contained high amount of water added into the coffee, the higher the water content of the functional coffee. From the results obtained, the optimum water content of the functional coffee was in F3 formula where there was no significant difference between F2 and F3 (6.55%). This was because water content in a dry food products such as powder was expected to have water content as little as possible to achieve material resistance from damage caused by microorganisms during storage. Decrease in water content within this study was obtained from the process of roasting at the right temperature and time.
This corresponded with the opinion of Edvan et al. (2016)
which stated that with the right temperatures and duration of roasting, water content gradually decreased from its original water content so that it was cultivated to meet the Indonesian National Standard (SNI) of ground coffee water content. The lower water content of the coffee with added the less cloves and ginger is getting better.
Ash content
Table 1 shows the mean values of functional coffee ash content and DMRT test results that differed significantly (p <0.05) in the formula F0- F1 with F2, F3, and F4. F0- F4 ash contents were 4.52%; 4.63; 4.70; 4.72; 4.84 respectively, indicating that F0-4 fulfilled the standard set by Indonesian National Standard (SNI) 01-3542-2004 of ash content with maximum of 5%.
Ash contents of formula F0- F1 were lower than F2- F4. Differences in ash contents might be caused by differences in the amount of spices (cloves and ginger) added containing minerals that presumably increased the ash content in the coffee. Nurdjannah and Bermawie (2012) stated that the content of ash in cloves was 6.11% and Vasala (2012) stated that the dry ginger had ash content of 5.7%. Hence, the more cloves and ginger were added into the coffee, the ash content on the functional coffee was higher. According to the results obtained, the optimum ash content from the functional coffee was in F3 formula where there was no significant difference between F3 and F4 with value of 4.72%. The
lesser the ash content in coffee, the better the quality of
coffee produced. According to Febrianto et al. (2014) the
purpose of testing ash content as a parameter of nutritional value in food was to know whether or not the process of making ground coffee was sophisticated and highly qualified. It was also conducted to check the
excellence of the types of materials used.The lower ash
content of the coffee with added the less cloves and ginger is getting better.
Extract content
Table 1 shows the mean values of functional coffee extract concentrations and DMRT test results that differed significantly (p <0.05) on each of the F0-1 formulas with F2, F3, and F4. F0- F4 extract contents obtained were 30.60%; 29.68%; 29.02%; 28.13%; 28.03% respectively. This indicated that the formula F0- F4 already met the Indonesian National Standard (SNI) 01-3542-2004 of extract content of 20-36%.
The extract contents of the F0-1 formulas were higher than that of F2-4. High levels of extract might be influenced by the amount of water-soluble solids and volatile compounds in the coffee and the spice. This complied with the opinion of Edria (2010) which stated that the greater the value of extract it meant the product was dissolved more quickly thus creating convenience for consumers when using the product. Low levels of extract in the F2-4 were due to the amount of spice ingredients added containing lots of fibers and minerals that did not experience complete combustion during roasting. In consequence, it reduced the existing fiber in the material and the amount of dissolved materials in the coffee affecting the extract content. Extract content had strong opposite relation to ash content. The higher the ash content the lower the extract content in coffee. This was caused by the amount of deposits in the form of minerals within the coffee. From the results gained, we saw that extract content of the functional coffee was in F3 formula where there was no significant difference between F3 and F4 with value of 28.13%. The higher extract content of the coffee with added the less cloves and ginger is getting better.
Antioxidant Activity
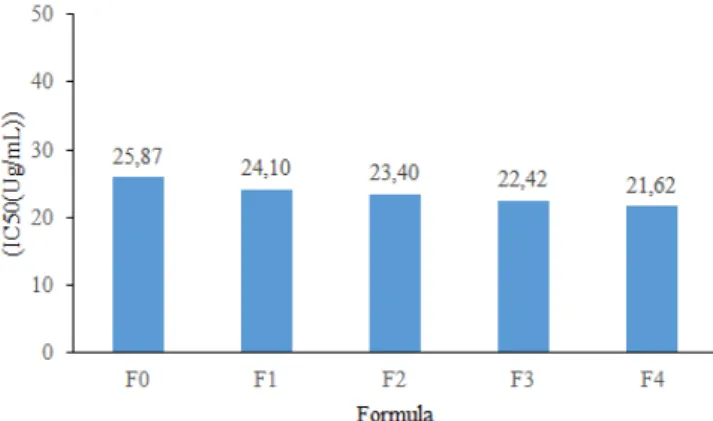
Based on Illustration 1, from the results of antioxidant activity test of IC50 using DPPH, there was significant difference of the functional coffee between each formulas (p <0.05). F0 had the highest IC50 value, that was 25.87 μg/mL, whereas F4 had the lowest IC50 value, that was 21.62 μg/mL but optimum was IC50 22,42 μg/mL. According to Filbert et al. (2014) the smaller the value of IC50, the higher the antioxidant activity of the sample. In this case, the higher the addition of cloves and
Table 1. Analysis results of functional coffee variable testing with different coffee and spices (cloves and ginger) formulas
Parameter Formula
F0 F1 F2 F3 F4
Water Content (%) 5,26±0,24a 5,58±0,12a 6,25±0,32b 6,55±0,25b 7,49±0,10c
Ash Content (%) 4,52±0,08a 4,63±0,15a 4,70±0,14ab 4,72±0,08ab 4,84±0,10b
Extract Content (%) 30,60±0,34a 29,68±0,50a 29,02±0,82ab 28,13±0,63bc 28,03±0,74c
Note: F0-F4= Formula of coffee and spices (cloves and ginger) with coffee:spice proportions of F0 (100%:0%) F1 (95%:5%) F2 (90%:10%) F3
ginger the antioxidant activity in the coffee increased. F3 showed the ability to inhibit free radical that was comparatively higher to other formulas because of the influence of the addition of cloves and ginger having antioxidant contents of phenol compounds such as eugenol and gingerol. This is in accordance with Erminawati and Naufalin (2014) reporting that the more amount of antioxidant-containing substances in the
sample the higher the antioxidant activity.The amount of
phenols in cloves and ginger greatly affected the activity of antioxidants. This is in accordance with the opinion of Husni et al. (2015) stating that the antioxidant activity was associated with the amount of phenols, wherein the higher the amount of phenol compounds contained the higher the antioxidant activity.
Illustration 1. Graphic of IC50 Antioxidant Activity of Functional Coffee
The highest level of antioxidant activity was found in the F3 formula with IC50 value of 21.62 μg/mL. This indicated that antioxidant activity, including IC50, was very active with value <50 μg/mL. This is consistent with
the opinion of Imrawati et al. (2016) suggesting that the
antioxidant activity strength of the compound tested using the DPPH method was classified according to IC50 value. This method was broadly considered as a good measurement of antioxidant efficiency of pure compounds or extracts. The high amount IC50 in F3 was mainly caused by the amount of ginger that was higher compared to the other spiced coffee formulas (F1-2),
according to Carlsen et al. (2010) wherein ginger
contained antibiotic activity of 31.8 μg/mL gingerol, while cloves contained antioxidant activity of eugenol of 1353.3 μg/mL, thus ginger had a high antioxidant activity in the mixture of spices. The more ginger added the higher the antioxidant activity was. Regardless of the addition of cloves and ginger, coffee had a high antioxidant as it contained chlorogenic acid which was one of the substances of phenol compounds. This is in accordance with the opinion of Putri and Andy (2013) stating that the largest chemical content of coffee as an antioxidant was chlorogenic acid. In coffee, chlorogenic acid had antioxidant activity of 41.0 μg/mL indicating that it contained very active antioxidants. This also went hand in hand with the opinion of Sato et al. (2011) which stated that IC50 chlorogenic acid had higher antioxidant activity than caffeine that were 41.0 μg/mL. Therefore, although the addition of a slight amount of spices (cloves and ginger) into the coffee formulas most likely produced
higher antioxidant activity. The optimum antioxidant activity of functional coffee was in F3 formula of 22.42 μg / mL among other formulas. The higher antioxidant activity of the coffee with added the more cloves and ginger is getting better.
Conclusion
The formula with the lowest proportion of spices was considered as the optimal formula based on the moisture content, ash content, and the extract content. However, based on its antioxidant activity, the formula with the highest proportion of spices was considered the best formula. The more the proportion of spices in the formula, the better the antioxidant status, although less optimum in its chemical properties tested. It is hoped that the spiced coffee formula could potentially serve as a functional beverage for the community.
References
Alenisan, M.A., Alqattan, H.H., Tolbah, L.S., Shori., A.B. 2017. Antioxidant properties of dairy product fortified with natural additives: A riew. 24: 101-106. DOI: 10.1016/j.jaubas.2017.05.001.
Andayani, R., Maimunah, Lisawati., Y. 2008. Determination of antioxidant activity, total phenol content and lycopene in tomatoes (Solanum lycopersicum L). J. Sains dan Teknologi Farmasi 13(1): 1-8 (in Bahasa Indonesia).
SNI. 1996. Traditional Powder Drink. SNI 01-4320-1996. National Agency for Standardisation, Jakarta (in Indonesia).
SNI. 2004. Quality Requirements of Powder Coffee. SNI 01-3542-2004. National Agency for Standardisation, Jakarta (in Indonesia).
Carlsen, M.H., Halvorsen, B.L., Holte, K., Bohn, S.K., Dragland, S., Sampson, L., Willey, C., Senoo, H., Umezono, Y., Sanada, C., Barikmo, I., Berhe, N., Willett, W.C., Phillips, K.M., Jacobs, D.R., Blomhoff, R. 2010. The total antioxidant content of than 3100 foods, beverage, spices, herbs and supplement used worldwide. J. Nutrition 9: 1475-2891.
Edria, D. 2010. Determination of age of functional instant drink Cinna-ale with arrhenius method . Thesis. Bogor Agricultural University, Bogor.
Edvan, B.T., Edison, R., Same, M. 2016. Influence of type and duration of roasting on robusta coffee quality (Coffea robusta). J. Agro Industri Perkebunan 4(1): 31-40 (in Bahasa Indonesia) Embuscado, M.E. 2015. Spices and herbs: Natural
sources of antioxidant – a mini review. J. Functional Food 18: 1-8. DOI: 10.1016/j.jff. 2015.03.005.
Erminawati and Naufalin, R. 2014. Physochemical and antioxidant properties of ant nest (Myrmecodia pendans). J. Teknosains Pangan 2(1): 115-123 (in Bahasa Indonesia).
Filbert, H.S.J., Koleangan, Runtuwene, M.R.J., Kamu,V.S. 2014. Determination of antioxidant activity based on IC50 value of methanol extract and its yield fraction on the skin of yaki betel nut (Areca vestiaria giseke) 3(2): 149-154 (in Bahasa Indonesia).
Handayani, H., Sriherfyna, H., Yunita. 2016. Extraction of soursop leaf antioxidant ultrasonic bath method (study of material ratio: solvent and extraction time). J. Pangan dan Agroindustri 4(1): 262-272 (in Bahasa Indonesia).
Husni, A., Ariani, D., Budhiyanti, S.A. 2015. The antioxidant activity and the level of consumer acceptance of instant drink enriched with Sargassum polycystum extract. J. Agritech 35(4): 368-376 (in Bahasa Indonesia).
Imrawati, M, Baitz, Jannah, M. 2016. Test of antioxidant activity of ethanol extract of acid flesh (Tamarindus indica L) origin Bima city of west Nusa Tenggara with DPPH method. J. Pharmaceutical and Medicinal Sciences 1(2): 75-78 (in Bahasa Indonesia).
Legowo, A.M., Nurwantoro, Sutaryo. 2005. Food Analysis. Diponegoro University, Semarang. Mu’nisa, A., Wreasdiyati, T., Kusumorini, N., Manalu, W.
2012. Antioxidant activity of clove leaf extract. J. Veteriner 13(2): 272-277 (in Bahasa Indonesia). Nurdjannah, N., and N. Bermawie. 2012. Handbook of
Herbs and Spices (Second Edition) Volume 1. Indonesian Agency for Agriculture Research and Development (IAARD), Indonesia.
Panggabean, J., Rohanah, A., Rindang, A., Susanto, E. 2013. Test the mesh difference to the quality of the multifucer grinder. J. Rekayasa Pangan dan Pertanian 1(2): 60-67 (in Bahasa Indonesia). Putri, W. and Andi. 2013. The content of caffeine and
polyphenols in Arabica L coffee beans from Enrekang Regency. J. Alam dan Lingkungan 4: 1-7 (in Bahasa Indonesia).
Putri, W. and I. Latunra. 2013. The content of caffeine and polyphenols in Arabica L coffee beans from Enrekang Regency. J. Alam dan Lingkungan 4(7): 1-7 (in Bahasa Indonesia).
Sato,Y., Itagaki, S., Kurokawa, T., Ogura, J., Kobayashi, N., Hirano, T., Sugawara, M., Iseki, K. 2011. In vitro and in vivo antioxidant properties of chlorogenic acid and caffeic acid. International Journal of Pharmaceutics 403: 136-138. DOI: 10.1016/j.ijpharm.2010.09.035
Towaha, J. 2012.Benefit of clove eugenol in various industries in Indonesia. J. Perspektif 11(2): 79-90 (in Bahasa Indonesia).