Sarla Biloniya et al IJSRE Volume 05 Issue 12 December 2017 Page 7754
Volume||5||Issue||12||December-2017||Pages-7754-7768||ISSN(e):2321-7545 Website: http://ijsae.in Index Copernicus Value- 76.10 DOI: http://dx.doi.org/10.18535/ijsre/v5i12.02
Modeling of Carbonic Anhydrase Inhibitor-I (Ca-I) With Log Ki (Nanomolar Affinity)
Authors
Sarla Biloniya1, Dr. R.G. Verma2, Dr. Aruna Solanki3, 1
Govt. Science College, Dewas 2
BLP Govt. College, Mhow
E-mail: [email protected], [email protected], ABSTRACT:
This paper deals with a QSAR study on a large set of carbonic anhydrase inhibitor-I using a combination of topological descriptor. The regression analysis has been carried out assuming linear relationship between LogKi nd topological descriptor. The analysis of the data has indicated that an excellent model is obtained. The obtained model is further supported through cross validation.
Keywords: QSAR/ topological descriptor/ carbonic anhydrase inhibitor-I/LogKi
INTRODUCTION
Quantitative Structure Activity (QSAR) is the method of choice. The method, using multivariate statistics, was developed by Hansch and Fujita[1], and it has been successfully applied to many drug and agrochemical design problems. In its simplest form the biological response is assumed to be a function of a number of molecular parameters which correlate with molecular size, lipid solubility or electronic properties [e.g. pI50 = f (physicochemical parameters)].
Quantitative Structure Activity (QSAR) technique represents an effort to link structural or property descriptors of compound with activities. These physico-chemical descriptors which obtain in parameters to accounts for hydrophobicity, topology, electronic parameters and steric effects, are determined empirically or more recently by computational methods. Quantitative Structure Activity Relationship (QSAR) is currently being applied in many disciplines, with many pertaining to drug design and environmental risk assessments.
In QSAR molecular structure are represented in the form of various descriptors, for the modeling of the properties or activities under consideration, the QSAR pipeline is represented below.
Sarla Biloniya et al IJSRE Volume 05 Issue 12 December 2017 Page 7755
Sulfonamides as a target molecule
The sulfonamides represent an important class of biologically active compounds with at least five different classes of pharmacological agents that have obtained from the sulfonamide structure as lead. The antibacterial sulfonamides continue to play an important role in chemotherapy, alone or in combination with other drugs. Furthermore, the sulfonamides that inhibit the zinc enzyme carbonic anhydrase pouses many applications as diuretic, antiglucoma or antiepileptic drugs among others[2]. Some antithyroid drugs have also been developed starting from the sulfonamide structure as lead molecule[3].
Carbonic anhydrase (CA) catalyzes the inter-conversion of carbon dioxide to biocarbonate. There are three classes α, β, and γ of CA, divided into three genetically unrelated families, viz: animal, plant and bacterial CAs, respectively{4,5}.
Carbonic anhydrase – I is a zinc dependent enzyme. It catalyzes the reversible hydration of carbon dioxide through a two step zinc hydroxide mechanism.[5,6]
CA catalyses the interconversion of CO2 to HCO3-in a two-stage reaction. Human CA catalyzes the reversible hydration of CO2 in two distinct half reactions.[7,8]
Topological Indices :
The descriptors tested has been divided into three separate category viz., Topological indices, Balaban and Balaban type descriptors and Quantum Theoretical descriptors.
In the fields of chemical graph theory, molecular topology, and mathematical chemistry, a topological index also known as a connectivity index is a type of a molecular descriptor that is calculated based on the molecular graph of a chemical compound[9]. Topological indices are numerical parameters of a graph which characterize its topology and are usually graph invariant. Topological indices are used for example in the development of quantitative structure-activity relationships (QSARs) in which the biological activity or other properties of molecules are correlated with their chemical structure[10].
Balaban indices:
Balaban Distance Connectivity Index, J
Quantum Theoretical Descriptors:
Quantum chemical calculations, in principle, can express all of the electronic and geometric properties of a molecule as the electronic structure is fundamental to other molecular observables. The quantum chemical methods used throughout this work will be presented in section 1.4 given below. Chapter 3 gives an overview of quantum chemical descriptors used in present work.
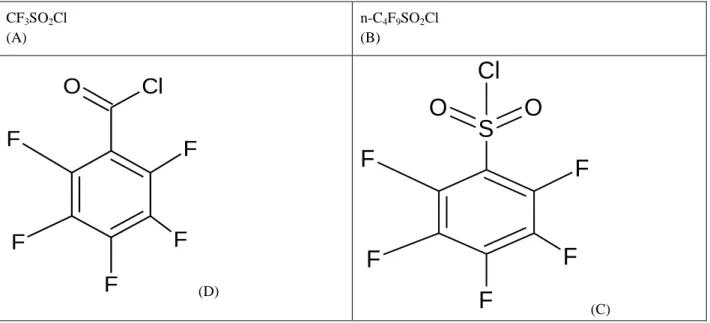
Sarla Biloniya et al IJSRE Volume 05 Issue 12 December 2017 Page 7756 CF3SO2Cl
(A)
n-C4F9SO2Cl
(B)
O
Cl
F
F
F
F
F
(D)
F
F
F
F
F
S
O
O
Cl
(C)
Figure 1
RESULT & DISCUSSION 3.1 Biological activities
The first step in developing QSAR equations is to compile a list of compounds for which the experimentally determined inhibitory activity is known. This can be obtained from various sources such as from electronic database, directly from experimental method and most commonly from the literature.
This list consists of 95 substituted aromatic sulfonamides collected from the literature.[11-13]
The inhibition data are expressed in terms of nanomolar affinity (KI) as log Ki for the investigated isozyme and are presented in the Table 1. This biological activity can also be expressed as an inhibition potency of the compounds i.e., its inhibition potency to reduce the activity of Carbonic anhydrase enzyme, participating in many biological actions.
The type of tail attached to the different substituted aromatic sulphonamides is indicated by A, B, C, & D and the substituted sulphonamides are represented by 1, 2, 3, 4 ………
Table 1 : The Inhibition activity logKi (hCAI) of the substituted sulphonamides used in the present study.
S.No Compound logKi
1. A1 4.311
2. A2 4.272
3. A3 4.037
4.
A4 4.17
5.
A5 3.699
6. A6 2.778
7. A7 2.699
8.
A8 2.863
9.
A9 3.017
Sarla Biloniya et al IJSRE Volume 05 Issue 12 December 2017 Page 7757 11.
A11 1.954
12.
A12 2
13. A13 1.38
14. A14 1.114
15.
A15 0.477
16.
A16 0.699
17. A17 1.322
18. A18 1.362
19. A19 1.398
20.
A20 -0.046
21. A21 -0.046
22. A23 0
23.
A24 3.708
24.
A25 2.74
25. B1 2.398
26. B2 2.23
27.
B3 2.204
28.
B4 2.255
29. B5 2.176
30. B6 2.176
31.
B7 1.991
32.
B8 2.628
33. B9 2.686
34. B10 1.708
35.
B11 0.903
36.
B12 0.301
37. B13 0.301
38. B14 0.477
39.
B15 0.301
40.
B16 0.602
Sarla Biloniya et al IJSRE Volume 05 Issue 12 December 2017 Page 7758 42.
B18 1.301
43.
B19 1.301
44. B20 -0.301
45. B21 -0.301
46.
B23 0
47.
B24 2.663
48. B25 2.585
49. C1 1.38
50. C2 1
51.
C3 1
52. C4 1.204
53. C5 1.176
54.
C6 1.176
55.
C7 0.954
56. C8 2.041
57. C9 2.097
58.
C10 1.176
59.
C11 0.699
60. C12 -0.523
61. C13 -0.523
62.
C14 -0.398
63.
C15 0
64. C16 0.176
65. C17 0.903
66.
C18 0.903
67.
C19 1.041
68. C20 -0.699
69. C21 -0.523
70.
C23 -0.301
71.
C24 1.602
Sarla Biloniya et al IJSRE Volume 05 Issue 12 December 2017 Page 7759 73.
D1 1.544
74.
D2 1.279
75. D3 1.23
76. D4 1.362
77.
D5 1.301
78.
D6 1.23
79. D7 1.176
80. D8 2.097
81. D9 2.193
82.
D10 1.58
83. D11 1.079
84. D12 0.301
85.
D13 0.176
86.
D15 0.301
87. D16 0.903
88. D17 1.255
89.
D18 1.556
90.
D19 1.431
91. D20 -0.301
92. D21 -0.222
93.
D23 -0.155
94.
D24 1.732
95. D25 1.699
* A,B,C,D represents respective tails attached to the mentioned aromatic sulphonamides. 3.2 Calculation of Topological Descriptors
In order to deduce the correlation of observed activity, in terms of logKi of reported compounds with different structural parameters, systematic QSAR investigations have been carried out using the QSAR model proposed.
Sarla Biloniya et al IJSRE Volume 05 Issue 12 December 2017 Page 7760
3.3 Regression analysis
Correlation analysis was carried out with the response variable and independent parameters of the 95 substituted aromatic sulphonamides set. Multiple linear regression analysis is the method of choice in the present investigation.
From this large set of descriptors, the useful or relevant descriptors are selected using the methodology of variable selection in multiple regression analysis.
The intercorrelatedness of all variables i.e., dependent and independent variables is demonstrated in Table 5 in the form of correlation matrix. There are two types of stepwise multiple linear regression methods : 1. Stepdown multiple linear regression : In this method, initially combination of all possible descriptors are taken in consideration and in each step one descriptor shall be removed from the large pool of descriptor. In this method number of independent parameter in the mathematical equation decreases with each step and finally reaches to the significant model. i.e., model starts from multivariate combination and ends at heptavariate, hexavariate, pentavariate, tetravariate and so on.
2. Stepup multiple linear regression method :
On the other hand this starts from univariate, bivariate, trivariate and so on, that means each descriptor has been added in a successive step. In the present investigation/study step – up multiple linear regression has been adopted. The results of various combination has been demonstrated in the Table 6, showing all the relevant statistical parameters of each combination.
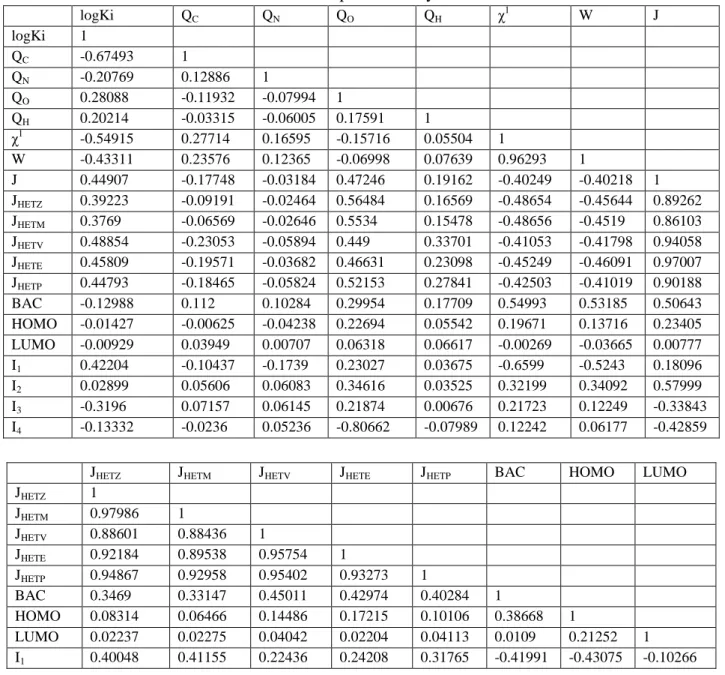
Table 5 : Correlation matrix of all variable used in present study.
logKi QC QN QO QH χ
1
W J
logKi 1
QC -0.67493 1
QN -0.20769 0.12886 1
QO 0.28088 -0.11932 -0.07994 1
QH 0.20214 -0.03315 -0.06005 0.17591 1
χ1 -0.54915 0.27714 0.16595 -0.15716 0.05504 1
W -0.43311 0.23576 0.12365 -0.06998 0.07639 0.96293 1
J 0.44907 -0.17748 -0.03184 0.47246 0.19162 -0.40249 -0.40218 1 JHETZ 0.39223 -0.09191 -0.02464 0.56484 0.16569 -0.48654 -0.45644 0.89262
JHETM 0.3769 -0.06569 -0.02646 0.5534 0.15478 -0.48656 -0.4519 0.86103
JHETV 0.48854 -0.23053 -0.05894 0.449 0.33701 -0.41053 -0.41798 0.94058
JHETE 0.45809 -0.19571 -0.03682 0.46631 0.23098 -0.45249 -0.46091 0.97007
JHETP 0.44793 -0.18465 -0.05824 0.52153 0.27841 -0.42503 -0.41019 0.90188
BAC -0.12988 0.112 0.10284 0.29954 0.17709 0.54993 0.53185 0.50643 HOMO -0.01427 -0.00625 -0.04238 0.22694 0.05542 0.19671 0.13716 0.23405 LUMO -0.00929 0.03949 0.00707 0.06318 0.06617 -0.00269 -0.03665 0.00777 I1 0.42204 -0.10437 -0.1739 0.23027 0.03675 -0.6599 -0.5243 0.18096
I2 0.02899 0.05606 0.06083 0.34616 0.03525 0.32199 0.34092 0.57999
I3 -0.3196 0.07157 0.06145 0.21874 0.00676 0.21723 0.12249 -0.33843
I4 -0.13332 -0.0236 0.05236 -0.80662 -0.07989 0.12242 0.06177 -0.42859
JHETZ JHETM JHETV JHETE JHETP BAC HOMO LUMO
JHETZ 1
JHETM 0.97986 1
JHETV 0.88601 0.88436 1
JHETE 0.92184 0.89538 0.95754 1
JHETP 0.94867 0.92958 0.95402 0.93273 1
BAC 0.3469 0.33147 0.45011 0.42974 0.40284 1
HOMO 0.08314 0.06466 0.14486 0.17215 0.10106 0.38668 1
Sarla Biloniya et al IJSRE Volume 05 Issue 12 December 2017 Page 7761 I2 0.3482 0.31968 0.40533 0.45938 0.34408 0.83932 0.47406 -0.01027
I3 -0.17153 -0.16168 -0.2419 -0.27705 -0.17815 -0.12652 0.17704 0.19921
I4 -0.58546 -0.57773 -0.39337 -0.43051 -0.49053 -0.29711 -0.22353 -0.08752
I1 I2 I3 I4
I1 1
I2 -0.33803 1
I3 -0.33803 -0.33803 1
I4 -0.3286 -0.3286 -0.3286 1
The correlation matrix for the aforementioned descriptors and logKi is presented in Table 5 and shows that there is significant correlation among the logKi and QC (Mulliken charge on Carbon atom of sulphonamide group) and χ1
(First order connectivity index) descriptors with -0.67493 and -0.54915 regression coefficient, respectively, which is greater than 0.5 value.
From the correlation matrix it can also conclude that none of the aforementioned indices is highly correlated with the activity and none of the individual parameters is sufficient to explore quantitative structure activity relationship (QSAR). This means that it is not possible to obtain a statistically significant mono-parametric model. Based on the correlation matrix, it is concluded that only multiparametric regressions involving combinations of the indices mentioned before may result in a statistically significant regression expression. For achieving this goal we have carried out step-wise regression analysis following the multiple linear regression method. The different results obtained in step wise method, ie., starting from monoparametric to multiparametric models are given in Table 6. Although thousands of permutation combinations are tested, but only few combinations are listed below.
3.4 QSAR Models Monoparametric Model
The resulting mono parametric models are depicted in model 1-12, along with statistical parameters of the regression. The results are taken with the entire dataset of 95 compounds (n = 95).
Out of the 12 significant monoparametric results model 1 shows best statistical results and the model can be expressed in the form of Eq 1 as below :
logKi = -7.82 (±0.886) QC + 1.6511 --- (1)
n = 95, r = -0.6749, Se 0.8632, F = 77.808, Q = 0.782
The regression coefficient of Mulliken charge of Carbon atom of sulphonamide group is -7.82, the negative coefficient indicate that inhibition potency decreases with increase in value of QC and vice versa. The standard error of mulliken charge QC is mentioned within parentheses.
Therefore, any factor which reduces mulliken charge on the Carbon atom increase inhibition activity. The r value of -0.6749 is the maximum r value shown by the single descriptor, rest all descriptors shows lesser r value and this can be clearly observed in correlation matrix and correlation Table (i.e., Table 6). However χ1
is second descriptor showing significant r value i.e., -0.5492. In order to determine more descriptive model, biparametric combinations were tested. Relatively more emphasis has been given to the biparametric combinations containing either QC or χ1.
The stanadard error of estimation of Eq (1) is 0.8632, which is greater than the value of r, therefore this also illustrate the requirement of biparametric model. The higer value of Se and comparatively lower value of r result in very low quality factor i.e., Q = 0.782
Biparametric Model
In order to improve above result upto the more significant level, biparametric combinations were tested and some biparametric models are shown in Table 6, the most appropriate result has been obtained by the combination of QC and χ1 and model is expressed in the form of Eq 2.
Sarla Biloniya et al IJSRE Volume 05 Issue 12 December 2017 Page 7762 n = 95, r = 0.773, Se = 0.7462, F = 68.303, Q = 1.04
In Eq (2) logKi (inhibition constant) shows similar dependence on QC as shown by the Eq (1), another parameter introduced in the model is the Randic first order connectivity index. The negative correlation coefficient of the connectivity index indicate that inhibition potency decreases with increase in the value of the χ1
. Therefore, lower values of both QC and χ1 is favorable for the inhibition activity of the given set of substituted aromatic sulphonamides.
The significant raise in the value of r from -0.6749 to 0.773 has been observed, and reduction in the value of standard error of estimation, from 0.8632 to 0.7462, but there is slight reduction in F ratio from 77.808 to 68.303, but this can be justify by the significant raise in the value of Q (Quality factor), from 0.782 to 1.04, therefore Eq (2) is statistically justifying the incorporation of χ1 in the equation.
Biparametric model clearly demonstrating the substitution which reduce mulliken charge on Carbon atom of sulphonamides as well as reducing χ1
of the compound is favorable and enhancing the inhibition potency of the sulphonamides.
Triparametric Model
In the step wise systematic multiple linear regression procedure, after obtaining biparamteric model, triparametric combinations has been tested to find out the third descriptor participating in regulating inhibition activity of the compounds.
Again several tri combinations has been tested, few are presented in Table 6. The more importance has been given to the triparametric combinations containing parameters of Eq (2) i.e., QC and χ1 . Also, it has been observed that the best results has been shown by the combination which carries QC and χ1 .
The Triparametric with its statistical parameters is as below :
logKi = -6.1321 (±0.717) QC - 0.3162 (±0.0486) χ1 + 0.0012 (±0.00024) W + 7.763
---(3) n = 95, r = 0.8262, Se = 0.6664, F = 65.216, Q = 1.24
In triparametric combination, Wiener index is introduced as a third parameter. However rest of the two parameters i.e., QC and χ1 are playing same role as in Eq (1) and Eq (2) with their negative correlation coefficient.
On the other hand newly introduced Wiener index showing positive correlation coefficient, leads to the increase in the value of logKi with raise in the value of W. Therefore, sulphonamides having substitution, which reduces Mulliken charge at Carbon atom of sulphonamide group, possessing lower connectivity index and higher value of Wiener index results in efficient inhibitory potency.
Statistical parameters also justifying the incorporation of W in the model. There is a significant raise in the value of r from 0.773 to 0.8262, standard error of estimation reduced from 0.7462 to 0.6664, F ratio however reduced from 68.303 to 65.216 but this can be ignored due to considerable increase in Quality factor Q from 1.04 to 1.24. All statistical parameters supporting the fitness of model.
Therefore, from Eq (3) it has been clearly demonstrated that higher value of W and lower value of QC and χ1
has been favorable for the inhibitory activity of the substituted aromatic sulphonamides. Tetraparametric model
Another step of step wise multiple linear regression method introduce one more parameter to improve statistical results of the model. This helps to find out the fourth important parameters, participating in the inhibition activity of the sulphonamides under consideration.
As in the previous step, several tetraparametric combinations has been tested, out of which few are presented in the Table 6 in the tetraparametric models. It has been observed that tetraparametric combination, which contain all the three parameters of triparametric models are the most promising among all the other tetraparametric combinations.
Sarla Biloniya et al IJSRE Volume 05 Issue 12 December 2017 Page 7763 logKi = -5.6814 (±0.6521) QC - 0.3153 (±0.0437)χ1 + 0.0013 (± 0.00022) W + 0.7233 (±0.1528) JHETV + 6.0029 --- (4)
n = 95, r = 0.8636, Se = 0.5996, F = 66.018, Q = 1.44
The positive coefficient of newly introduce parameter JHETV, i.e., Balaban type index for van der waal weighted distance matrix, indicate that inhibition activity increases with increase in the value of JHETV. Rest three parameters are following the same trends as they are in Eq (1), (2)and (3).
The inclusion of JHETV is justified by observing statistical parameters of Eq (4), the r value increased from 0.8262 to 0.8636, standard error of estimation reduced from 0.664 to 0.5996 and the most remarkable achievement in this model is the raise in the value of F ratio from 65.216 to 66.018, Also, there is increase in the value of Q from 1.24 to 1.44.
Eq (4) suggests that the lower value of QC and χ1 and higher values of W and JHETV is favorable for the inhibitory action of the sulphonamides.
Pentaparametric model
In order to improve results upto its atmost level, pentaparametric combination has been tested and recorded in Table 6. Out of all result only few important ones are listed in the Table 6.
The Pentaparametric combination is shown below in the form of Eq (5)
logKi = -4.5733 (± 0.6876) QC - 0.3919 (± 0.0464) χ1 + 0.0016 (± 0.00022) W - 0.5327 (± 0.1494) JHETM + 1.7727 (±0.3275) JHETV + 7.23 ---(5)
n = 95, r = 0.8818, Se = 0.564, F = 62.237, Q = 1.56
The incorporation of JHETM has been justified by the relative trends in statistical parameters, from Eq(4) to Eq (5) which can be described as : Raise in r from 0.8636 to 0.8818, decrease in Se from 0.5996 to 0.564 and increased Q value from 1.44 to 1.56.
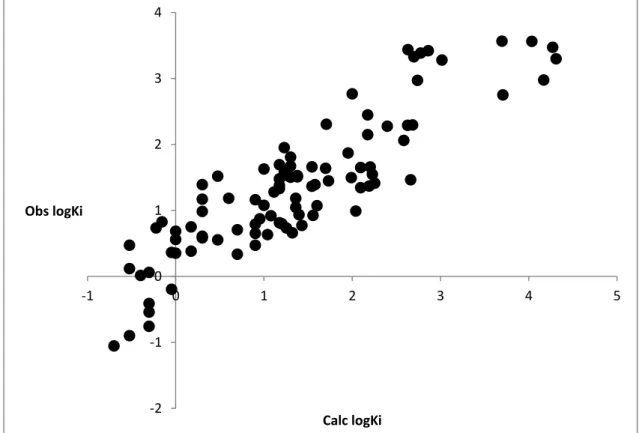
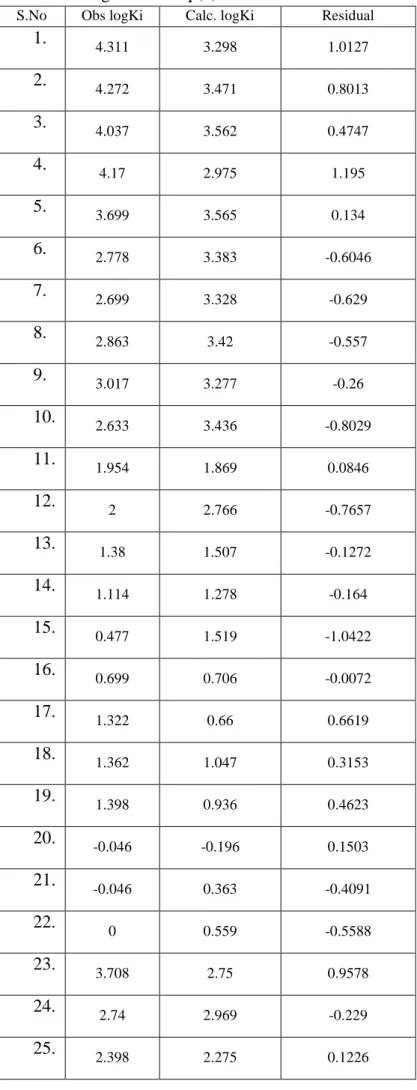
The logKi values has been calculated for all the 95 compounds with their residual values (difference of Observed logKi and Calculated logKi). The fitness of the model can also observed by ploting a linear graph between observed and calculated logKi. The observed, calculated logKi with their residual are given in Table 7, and graph as Figure 1
Figure 1: Graphical representation of Obs. logKi and Calc. logKi from Eq (5)
-2 -1 0 1 2 3 4
-1 0 1 2 3 4 5
Obs logKi
Sarla Biloniya et al IJSRE Volume 05 Issue 12 December 2017 Page 7764
Table 7: Observed logKi, Calculated logKi from Eq (5) with their residual values S.No Obs logKi Calc. logKi Residual
1. 4.311 3.298 1.0127
2. 4.272 3.471 0.8013
3. 4.037 3.562 0.4747
4. 4.17 2.975 1.195
5. 3.699 3.565 0.134
6. 2.778 3.383 -0.6046
7. 2.699 3.328 -0.629
8. 2.863 3.42 -0.557
9. 3.017 3.277 -0.26
10. 2.633 3.436 -0.8029
11. 1.954 1.869 0.0846
12. 2 2.766 -0.7657
13. 1.38 1.507 -0.1272
14. 1.114 1.278 -0.164
15. 0.477 1.519 -1.0422
16. 0.699 0.706 -0.0072
17. 1.322 0.66 0.6619
18. 1.362 1.047 0.3153
19. 1.398 0.936 0.4623
20. -0.046 -0.196 0.1503
21. -0.046 0.363 -0.4091
22. 0 0.559 -0.5588
23. 3.708 2.75 0.9578
24. 2.74 2.969 -0.229
Sarla Biloniya et al IJSRE Volume 05 Issue 12 December 2017 Page 7765
26. 2.23 1.546 0.684
27. 2.204 1.657 0.5471
28. 2.255 1.412 0.8432
29. 2.176 2.148 0.0276
30. 2.176 2.446 -0.2704
31. 1.991 1.497 0.4943
32. 2.628 2.29 0.3382
33. 2.686 2.295 0.3911
34. 1.708 2.304 -0.5959
35. 0.903 1.161 -0.2579
36. 0.301 1.389 -1.0883
37. 0.301 0.608 -0.3073
38. 0.477 0.553 -0.0755
39. 0.301 1.17 -0.8688
40. 0.602 1.184 -0.582
41. 1.176 1.329 -0.1526
42. 1.301 1.67 -0.3687
43. 1.301 1.502 -0.2005
44. -0.301 -0.411 0.1097
45. -0.301 -0.541 0.2399
46. 0 0.685 -0.6849
47. 2.663 1.464 1.1992
48. 2.585 2.059 0.5256
49. 1.38 1.526 -0.1464
50. 1 1.628 -0.6285
Sarla Biloniya et al IJSRE Volume 05 Issue 12 December 2017 Page 7766
52. 1.204 0.795 0.4093
53. 1.176 1.478 -0.3021
54. 1.176 1.693 -0.5168
55. 0.954 0.873 0.0811
56. 2.041 0.99 1.0506
57. 2.097 1.648 0.4487
58. 1.176 0.811 0.3647
59. 0.699 0.335 0.3637
60. -0.523 0.472 -0.9953
61. -0.523 0.117 -0.6401
62. -0.398 0.015 -0.4133
63. 0 0.351 -0.3507
64. 0.176 0.382 -0.2056
65. 0.903 0.471 0.4316
66. 0.903 0.789 0.1142
67. 1.041 0.633 0.4078
68. -0.699 -1.054 0.355
69. -0.523 -0.898 0.3754
70. -0.301 0.06 -0.3612
71. 1.602 1.071 0.5309
72. 1.544 1.365 0.1788
73. 1.544 1.659 -0.1153
74. 1.279 1.521 -0.2418
75. 1.23 1.583 -0.3534
76. 1.362 1.182 0.1799
Sarla Biloniya et al IJSRE Volume 05 Issue 12 December 2017 Page 7767
78. 1.23 1.951 -0.7209
79. 1.176 1.377 -0.2015
80. 2.097 1.343 0.7541
81. 2.193 1.368 0.8247
82. 1.58 1.39 0.1897
83. 1.079 0.919 0.1602
84. 0.301 0.984 -0.6827
85. 0.176 0.749 -0.5727
86. 0.301 0.582 -0.2811
87. 0.903 0.651 0.2521
88. 1.255 0.732 0.5226
89. 1.556 0.924 0.6321
90. 1.431 0.772 0.6586
91. -0.301 -0.758 0.4566
92. -0.222 0.733 -0.9555
93. -0.155 0.827 -0.9819
94. 1.732 1.448 0.2841
95. 1.699 1.639 0.0598
Usually on the basis of maximum residual value the compound are removed from the dataset, but in present case the improvement in result is only observed by removing compounds no 93 from above dataset.
In a stepwise manner few outliers has been removed one by one, first compounds no 93 was removed. After removing compounds no 93 the same combination i.e., Eq (5) has been tested for the set of 94 substituted aromatic sulphonamides, and the model.
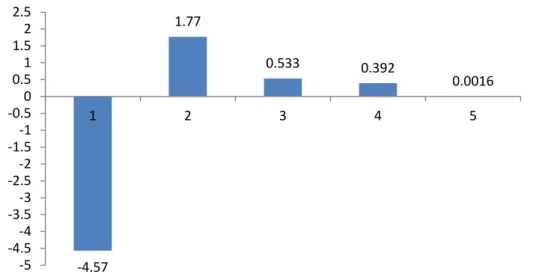
According to both the Eq’s the QC possessed the highest correlation coefficient among all the five descriptors and W showing least correlation coefficient among all the five parameters. Therefore, the sequence of priority on the basis on their correlation coefficient shall be arranged as :
Sarla Biloniya et al IJSRE Volume 05 Issue 12 December 2017 Page 7768
Figure 7 : Relative contributions of the all the five parameters participating in the Eq (5) to model inbitory activity of the sulphonamides.
CONCLUSION:
From above mention result and discussion it is conclude that models which obtained by the combination of topological indices and structural description have better predictivity and quality.
REFERENCES
1. Todeschini R, Consonni V (2000) Handbook of molecular descriptors. Wiley-VCH, Weinheim.
2. Singh, J.; Lakhwani, M.; Khadikar, P. V.; Agrawal, V. K.; Balaban, A. T.; Clare, B.W.; 3. Supuran, C. T. Romania Rev 2006.
4. S. Parkkila in W. R. Chegwidden, N. D. Carter, Edwards, Y.H. (eds.), Carbonic Anhydrase New
Horizons: An Overview of the Distribution and Function of Carbonic Anhydrase in Mammals,
Birkhauser Verlag Basel, Switzerland, 2000, pp 80-93.
5. B. Ulmasov, A. Waheed, G. N. Shah, J. H. Grubb, W. S. Sly, C. K. Tu, D. N. Silverman, Proc. Natl.
Acad. Sci.USA, 2000, 97, 14212.
6. Supuran, C. T.; Scozzafava, A.; Casini, A. Med. Res. Rev. 2003, 23, 146.
7. Casini, A.; Scozzafava, A.; Mincione, F.; Menabuoni, L.; Supuran, C. T. J. Enz. Inh. Med. Chem. 2002, 17, 333.
8. Casini, A.; Mincione, F.; Vullo, D.; Menabuoni, L.; Scozzafava, A.; Supuran, C. T. J. Enz. Inh. Med. Chem. 2002, 17, 9.
9. Kim, C.-Y.; Whittington, D. A.; Chang, J. S.; Liao, J.; May, J. A.; Christianson, D. W. J. Med. Chem. 2002, 45, 888.
10. Gute, B. D., Basak, S. C. Predicting acute toxicity of benzene derivatives using theoretical molecular descriptors: a hierarchical QSAR approach. SAR QSAR
11. EnViron. Res. 1997, 7, 117-131.
12. Basak, S. C., Grunwald, G. D. Predicting mutagenicity of chemicals using topological and quantum chemical parameters: A similarity based study. Chemosphere 1995, 31, 2529-2546.
13.Kier, L. B.; Hall, L. H. Molecular ConnectiVity in Chemistry and Drug Research; Academic Press: New York, 1976.
14. Kier, L. B.; Hall, L. H. Molecular ConnectiVity in Structure-ActiVity Analysis; Research Studies Press: Letchworth, U.K., 1986.
15. Trinajstic ´, N. Chemical Graph Theory, 2nd ed.; CRC Press: Boca Raton, FL, 1992. 16. Diudea, M. V.; Ivanciuc, O. Molecular Topology; Comprex: Cluj, Romania, 1995.
17. Balaban, A. T. From Chemical Graphs to 3D Molecular Modeling. In From Chemical Topology to
Three-Dimensional Geometry; Balaban, A. T., Ed.; Plenum: New York, 1997; pp 1-24.
-4.57
1.77
0.533 0.392
0.0016
-5 -4.5 -4 -3.5 -3 -2.5 -2 -1.5 -1 -0.5 0 0.5 1 1.5 2 2.5