How well do physicians predict the life expectancy of older adult outpatients?
A systematic review and discussion of the implications for cancer screening guidelines
By
Meredith Gilliam
A Master’s Paper submitted to the faculty of the University of North Carolina at Chapel Hill
in partial fulfillment of the requirements for the degree of Master of Public Health in
the Public Health Leadership Program
Chapel Hill 2012
Advisor:
Date
Second Reader:
ABSTRACT
Background: Shortened life expectancy may limit older adults’ ability to benefit from certain medical interventions, such as preventive services. Appropriate consideration of a patient’s life
expectancy may help physicians weigh potential benefits against potential harms for that
individual. Some recent cancer screening guidelines have recommended this individualized
approach to cancer screening decisions to avoid overscreening or underscreening. However, it
is not clear how competent physicians are at predicting life expectancy, and there is little
consensus about how these predictions should guide their recommendations for or against
cancer screening.
Purpose: This systematic review attempts to characterize physicians’ accuracy and reliability at
predicting the life expectancy of older adult outpatients. A discussion further considers what
level of evidence is needed to justify the replacement of an age-based cancer screening
guideline to a life expectancy guideline for stopping cancer screening.
Data Sources: MEDLINE, EMBASE, PsycINFO, reference lists
Study Selection: Studies that assess physicians’ estimates of life expectancy for older adults
who are not terminally ill are included.
Data Extraction: Data relating to physicians’ accuracy and reliability, as well as physician
attributes associated with predictive performance, are extracted. Study quality is assessed according to criteria adapted from the Centre for Review and Dissemination’s quality
assessment criteria for diagnostic tests.
Data Synthesis: Six small, cross-sectional studies utilizing patient vignettes and comparing physicians’ predictions to some reference standard are included. As a group, physicians have a
tendency to underestimate life expectancy by 1–2 years and 10-year mortality risk by 10-15%,
with poor inter-rater reliability. Among studies that reported LE predictions in years (n = 3), the
3
Limitations: Quality ratings for included studies were generally fair or poor. Major limitations
include the use of patient vignettes in place of real patient encounters, reference standards for
life expectancy of unclear quality, and small, nonrandom samples of physicians.
Conclusions: As a group, physicians are moderately accurate in their predictive ability for the
life expectancy of older adults but reliability among individuals is poor. Larger studies of physicians’ predictions for real patients are needed, possibly incorporating life expectancy
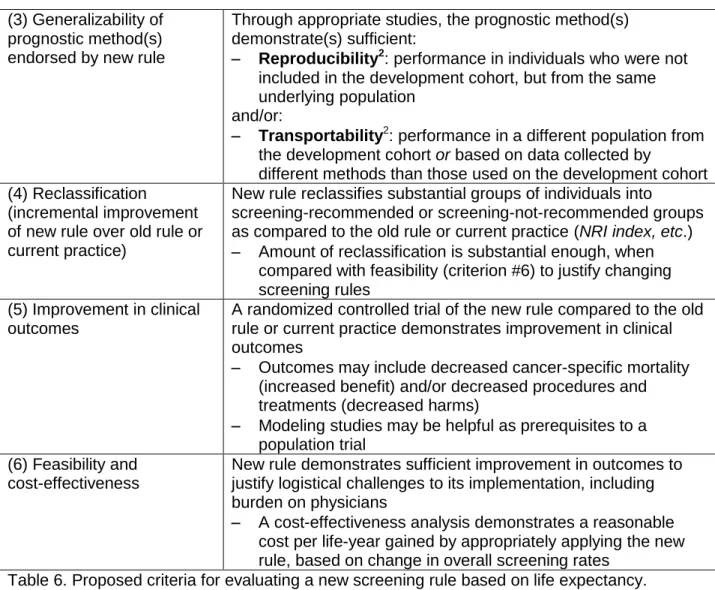
prediction rules to assist physicians. Six criteria for evaluating whether there is enough evidence
to support a life expectancy-based cancer screening guideline are proposed.
INTRODUCTION
Knowledge of a patient’s prognosis, including life expectancy, is helpful in many clinical
decision-making scenarios.1, 2 These scenarios range from decisions about how aggressively to manage a patient’s known disease, to how tightly to control risk factors for future disease, and
importantly, whether or not to use clinical preventive services, such as cancer screening. In the
case of cancer screening, the mortality benefits of the screening intervention may take years to
be appreciated, while the harms of the intervention may be felt much sooner. Knowledge of a patient’s life expectancy, especially an elderly patient who may have years rather than decades
of life remaining, may help providers balance the likelihood of benefit against the likelihood of
harm for a particular patient.
Various tools for predicting a patient’s life expectancy are available to health care
providers. Actuarial data in the form of life tables are available for large populations, and may
report average years of life remaining for individuals of various ages, as well as the range of
years remaining over quartiles of health.1 The life insurance and health insurance industries have developed various risk calculators to adjust these population average life expectancies for
prospective studies of patient cohorts, taking into account patient data such as comorbidities,
functional status, and biometrics. A high-quality systematic review of prediction rules for
all-cause mortality in older adults was recently published,2 and the authors published a useful website (www.eprognosis.org) summarizing the prediction rules they found as a resource for
clinicians.4
In practice, when physicians are making cancer screening decisions with patients, they
may not have immediate access to actuarial data or prediction rules for life expectancy, but rely
on some understanding of these data and their clinical experience. While a growing body of literature describes physicians’ poor performance at predicting the life expectancy of terminally
ill patient groups,5-10 there is less evidence for their predictive performance for general
populations of older adults. The goal of this is systematic review is to summarize the literature
on the accuracy and reliability with which physicians estimate the life expectancy of older adults in outpatient settings. Accuracy refers to the nearness of the physicians’ predictions to a
reference standard for life expectancy. Reliability, or precision, refers to the agreement among
different predictions for the same patient. Inter-rater reliability describes the agreement among
multiple physicians making predictions for the same patient (poor reliability means a high
degree of variation among their predictions). Intra-rater reliability describes the agreement
between two or more predictions made by the same physician for the same patient, on different
occasions.
Life expectancy and cancer screening
Prognosis is important in the case of cancer screening because many years must pass
before a patient may experience benefit from screening, a concept sometimes referred to as “lag time,”11-13 while harms may be experienced immediately. Net benefit is defined as benefits minus harms, and the likelihood of net benefit therefore depends on a patient’s life expectancy
5
The benefits of screening are generally measured as reduction in cancer-specific
mortality, expressed as lives extended divided by number of individuals screened over a certain
period of time. A full complement of potential benefits, however, may include other physical,
psychological, or financial effects of screening, such as reassurance in a patient who screens
negative, or avoidance of cancer-related symptoms through early treatment.
The potential harms of screening are more diverse and may result from any element of the “screening cascade,” which includes initial screening, work-up of abnormal or inconclusive
results including false positives, and the management of detected lesions. These harms may
include emotional concern or distress, bodily harm, hassle, financial drain, or opportunity cost
resulting from the screening cascade. They may be experienced in the short term or the long
term.14 Choosing the example of breast cancer screening, key harms may include pain and radiation exposure during mammography, anxiety due to false positive imaging, pain or scar
due to biopsy, psychological effects of diagnosing a patient with cancer including overdiagnosis,
physical and psychological effects of breast cancer treatment, and hassle and costs associated
with all these steps.
Special considerations for cancer screening in older adults
Attention to the balance of benefits and harms for cancer screening is particularly
pertinent for older adults. With increasing age, both the benefits and harms of screening are
understood to shift in complex ways.1, 12, 13, 15 An individual’s overall risk of death from cancer increases with age; however, the benefit of cancer screening decreases with decreasing life
expectancy.1 The accuracy of screening tests may change with age; for instance, the sensitivity of sigmoidoscopy for colorectal cancer may decrease with age because the absolute risk of
right-sided cancer increases, while the sensitivity of mammography increases with age because
For individual patients, a time will come when the overall harms of screening equal or outweigh
the overall benefits; in other words, the net benefit of screening becomes zero or negative.
Deciding when to stop cancer screening in older adults is a challenge. The simplest predictor of a patient’s prognosis is her age, and cancer screening guidelines have traditionally
used age-based thresholds to indicate when to stop screening.17 In recent years, however, there has been a movement toward individualized decision making involving patients, including
consideration of their age and individual prognostic factors when making cancer screening
decisions1, 2, 1816. Screening guidelines have adapted to this trend in different ways. Some guidelines recommend that cancer screening be restricted to individuals with life expectancy
greater than a certain number of years, such as five years, and others make reference to life
expectancy or comorbidity without specification as to number of years. The choice of a life
expectancy threshold in years is generally based on the separation of survival curves for
screened and unscreened populations,17 but is a very nuanced choice that I will discussed later in this paper. Table 1 presents four example breast cancer screening guidelines from prominent
panels and professional organizations.
Organization Breast Cancer Screening Recommendation
US Preventive Services Task Force
≥ 75 yrs: Insufficient evidence to balance the benefits and harms of the service19 (2009)
"[T]he evidence [for mammography] is also generalizable to women aged 70 and older...if their life expectancy is not compromised by comorbid disease20" (2002)
American Cancer Society
No upper age limit.
“[I]f an individual has an estimated life expectancy of less than three to five years, severe functional limitations, and/or multiple or severe comorbidities likely to limit life expectancy, it may be appropriate to consider cessation of screening21” (2003)
American Geriatrics Society
Continue screening older women who have a life expectancy >= 4 years22 (2000)
American College of Obstetricians and Gynecologists
No upper age limit.
“Medical comorbidity and life expectancy should be considered in a breast cancer screening program for women aged 75 years or older”23 (2011)
7
Current practice of cancer screening in older adults
Actual cancer screening practices for older adults in the United States are
heterogeneous. One way they can be described is by rates of screening in age-eligible
populations. One recent study24 examined cancer screening in racially diverse older adults through the National Health Interview Survey, an annual, in-person survey of health trends. The
authors analyzed self-reported screening among 1697 adults in the 75-79 age group and 2376 adults in the ≥80 age group, as well as younger adults. Screening was reported as having
received an appropriate cancer-specific screening test within the past number of years
described as an appropriate screening interval by the US Preventive Services Task Force (e.g.,
fecal occult blood testing within one year, sigmoidoscopy within five years, or colonoscopy
within ten years). Screening prevalence declined with age, but remained high even in the oldest
age group. Among adults aged 75 to 79, they were 62% for breast cancer, 57% for colorectal
cancer, 57% for prostate cancer, and 53% for cervical cancer. Among adults aged 80 or older,
the rates declined to 50% for breast, 47% for colorectal, 42% for prostate, and 38% for cervical.
No association was found between cancer screening and number of self-reported comorbidities
except in the case of prostate cancer, for which one or more comorbidities was associated with
a higher rate of prostate specific antigen (PSA) screening, possibly due to increased interactions with health care leading to increased opportunities for screening in this group.
Although there are limitations to their reliance on self report, the authors appropriately speculate
that the high screening rates among older adults may reflect the performance of screening
without full consideration of risks and benefits. Unfortunately, such population-based statistics
are limited because they cannot tell us about the appropriateness of screening decisions for
individual patients. According to 2007 U.S. Life Tables,25 the average life expectancy of an 80 y.o. woman, the youngest in the ≥80 age group, is 9 years. The average woman in the ≥80 age
group is likely older than 80 and has a more limited life expectancy. The finding that half (50%)
who would not be expected to live long enough to benefit from the cancer screening. However,
analysis of this data cannot define prognostic information available at the time the screening
decision was made.
There is some additional evidence from population studies that groups of patients who
are unable to benefit from cancer screening are being screened. One study26 of mammography based on Medicare claims in women with and without dementia estimates that nationally,
120,000 screening mammograms were performed on women with severe cognitive impairment in 2002, despite this group’s median survival of 3.3 years. Another study27 of women undergoing
dialysis for end stage renal disease found that, despite a low (25%) overall rate of biennial
screening mammography in this group, 13% of women who died within five years from the start
of the study were screened. One prospective study28 of Medicare patients with advanced cancer found that, despite their poor prognosis, 9% of women received mammograms, 6% received
Papanicolaou tests, and 15% of men received PSA tests. Other studies have further
documented overscreening in terms of inappropriate frequency of screening29 or inappropriate consideration of medical history (e.g., cervical cancer screening in women without a cervix30).
At the same time, there may also be older adults in excellent health for whom the
benefits of screening outweigh the harms, but are not being screened. In one prospective
study12 of veterans over age 70, 47% of patients with no comorbidities who had life
expectancies greater than 5 years were not screened for colorectal cancer. Another study31 on self-reported mammography in Medicare patients found that 22% of women with good 5-year prognosis (mortality risk ≤ 10%) had not been screened in the past 2 years, and that screening
rate was further associated with wealth, regardless of prognosis.
These studies of screening rates provide some evidence of both underscreening and
overscreening, but are nonetheless unable to illuminate how screening decisions are being
made at the level of the physician and patient. A few small studies have examined this decision
9
considering patients’ prognosis and other factors. One qualitative study32 interviewed 16
physicians at a large academic center about how they counsel women older than 80 about screening mammography. All of the physicians mentioned that the patient’s health and
functional status influenced the screening decision, and half reported that they stopped
recommending or recommended against screening women they perceived to have low life
expectancy. Other themes that emerged were the discomfort of broaching the issue of stopping
screening with patients, the difficulty of explaining the potential harms of screening, and clinical
uncertainty about the harms and benefits of screening older women. Another qualitative study33 interviewed fifteen primary care physicians in community practices about their decisions to
continue or stop colorectal cancer screening in elderly patients. Physicians in the study report
considering numerous factors in the screening decision process and practicing shared decision
making in cases of clinical uncertainty. Clinical factors of importance to the physicians included
age, functional status, and estimated life expectancy of 5 or 10 years. Physicians emphasized
uncertainty about life expectancy as well as the large number of factors influencing the
screening decision as sources of difficulty. Individual patient factors such as personality and
previous screening behavior became more important when there was uncertainty about the patient’s clinical prognosis.
Definitions
It is helpful to define some terms for this review. Prognosis is a general term that refers to the probability of an individual developing a certain outcome, such as death, over a specific
period of time.18Life expectancy (LE) falls under the umbrella of prognosis, and may be defined as the average number of years an individual of a given age is expected to live if current
mortality rates apply.3 Therefore, a predicted life expectancy may be compared against the best actuarial or epidemiological data available, which are often stratified by age, gender, and
longevity for each age. Mortality risk reflects a patient’s probability of death within a certain number of years; for instance, a 10-year mortality risk of 50% means that a patient has a 50%
chance of dying within 10 years. While they provide different types of information about a patient’s prognosis, both life expectancy and mortality risk are useful when it comes to clinical
decisions. Mortality risk may in fact be the more helpful statistic for cancer screening decision because it helps physicians consider a patient’s likelihood of surviving past a certain threshold
necessary to reap net potential benefit from screening.
Key Question
How accurate and reliable are physicians at predicting the life expectancy of older adults in the
outpatient setting?
METHODS
Data Sources and Searches
I searched MEDLINE, EMBASE, and PsycINFO from inception through April 22, 2012 for relevant studies addressing this key question. I used the MeSH search terms “Life
Expectancy,” “Forecasting,” “Prognosis,” “Outpatients,” and “Nursing Homes,” along with other
relevant key words. Complete search strategies for each database are listed in Appendix A. I
also hand searched the bibliographies of all relevant studies identified through these searches,
as well as other related literature, and used Google Scholar to search for articles that cited my included studies. I finally used MEDLINE’s related articles search feature for included studies in
attempt to identify additional studies. I did not attempt to search for studies not published in
peer-reviewed journals. A librarian specialist in health sciences provided guidance for this
search strategy.
Study Selection
Studies identified by database and hand searches were reviewed by the present author
11
reviewed the titles and abstracts of all studies and excluded those that did not match inclusion
criteria. If it was not clear from the abstract whether the study met criteria, I reviewed the full text.
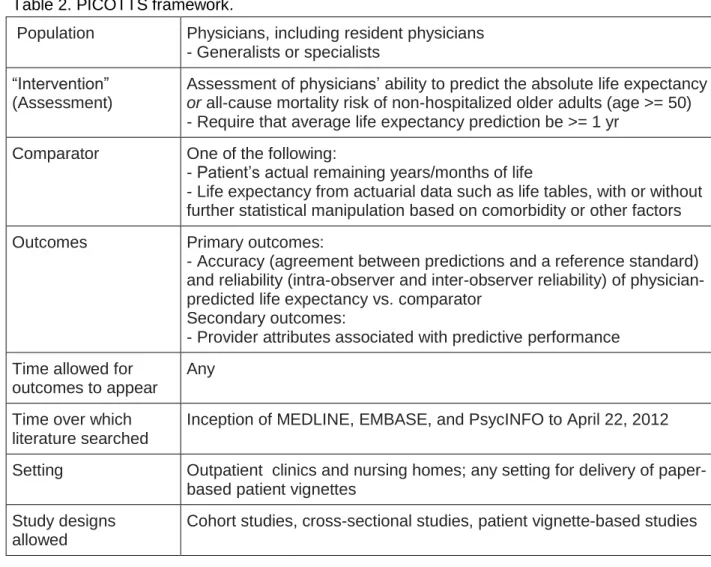
Inclusion criteria are outlined by the PICOTTS method in Table 2.
Table 2. PICOTTS framework.
Population Physicians, including resident physicians - Generalists or specialists
“Intervention” (Assessment)
Assessment of physicians’ ability to predict the absolute life expectancy
or all-cause mortality risk of non-hospitalized older adults (age >= 50) - Require that average life expectancy prediction be >= 1 yr
Comparator One of the following:
- Patient’s actual remaining years/months of life
- Life expectancy from actuarial data such as life tables, with or without further statistical manipulation based on comorbidity or other factors
Outcomes Primary outcomes:
- Accuracy (agreement between predictions and a reference standard) and reliability (intra-observer and inter-observer reliability) of physician-predicted life expectancy vs. comparator
Secondary outcomes:
- Provider attributes associated with predictive performance Time allowed for
outcomes to appear
Any
Time over which literature searched
Inception of MEDLINE, EMBASE, and PsycINFO to April 22, 2012
Setting Outpatient clinics and nursing homes; any setting for delivery of paper-based patient vignettes
Study designs allowed
Cohort studies, cross-sectional studies, patient vignette-based studies
Rationale for Eligibility Criteria
I chose to include all study designs to keep my search as broad as possible. The study
designs of highest relevance to this review are cross-sectional studies, prospective cohort
studies, and/or clinical trials of life expectancy prediction. Although this review is primarily
interested in life expectancy predictions made in the primary care setting where cancer
hypothesized that providers’ understanding of patient prognosis comes from their training and
clinical experience with elderly patients, which may not be dissimilar across medical specialties.
I also expected that data for primary care providers may be very limited.
I established the following exclusion criteria:
Prediction of single-cause mortality (e.g., predicting years to death from breast cancer).
A patient’s probability of benefit from cancer screening depends on the likelihood that a
certain cancer will kill her before another cause of death does. Therefore, I am only interested in a patient’s life expectancy with regard to all-cause mortality.
Prediction in populations with terminal illness or other advanced disease (average
predicted LE <= 1 year) who would not be screened for cancer by a reasonable
physician. One may wonder whether a provider’s ability to predict life expectancy over a
short period of time may correlate with her ability to predict life expectancy over a longer
period of time among healthier adults. For instance, if providers perform poorly at
predicting life expectancy in short-term clinical scenarios, may we assume they perform
as poorly or worse at predictions over longer periods of time? I have decided it is not
reasonable to assume that short-term predictions may function as a proxy for long-term
predictions, which are influenced by different factors.
Study setting in an underdeveloped country, where the average life expectancy and
major causes of death may differ greatly from the United States.
Non-English study.
Data Extraction and Quality Assessment
I collected results from included studies in a standardized way in Table 3. Whenever
possible, I abstracted results on prediction performance for licensed providers (including
resident physicians) from other subjects such as medical students, nurses, and other medical
13
on physician performance. I did not attempt to contact the authors of other studies. I assessed
the quality of included studies in a systematic way using criteria adapted from The Centre for Reviews and Dissemination’s quality assessment criteria for diagnostic tests (CRD Monograph
Table 2.1).36 These criteria are in turn adapted from a study of sources of bias (internal validity) and variation (external validity) in studies of diagnostic accuracy conducted by Whiting and
colleagues, 2004.37 Using this approach, I considered clinicians’ estimation of life expectancy or mortality risk as a type of diagnostic “test,” and the actuarial data their predictions were
compared against as the “reference standard.” A sample quality assessment form including
descriptions of potential quality problems is shown in Table 3. I did not develop specific
definitions for the final ratings of internal validity and external validity, but based these on the
sum of evidence listed in each form. Quality assessment forms for each included study are
included in Appendix B.
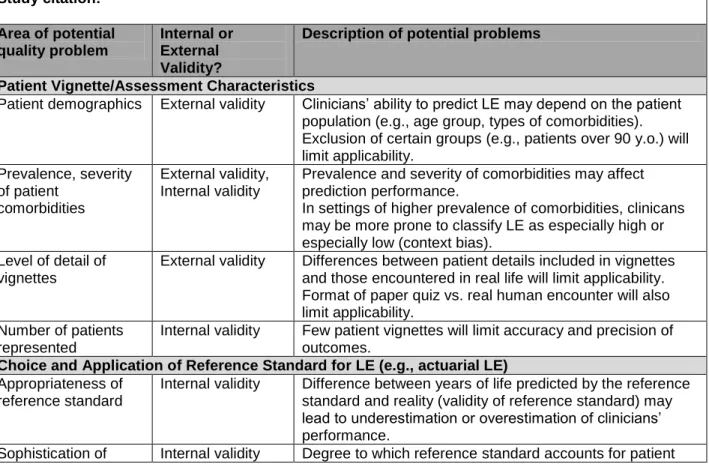
Table 3. Sample Quality Assessment Form (adapted from CRD Monograph Table 2.136) Study citation:
Area of potential quality problem
Internal or External Validity?
Description of potential problems
Patient Vignette/Assessment Characteristics
Patient demographics External validity Clinicians’ ability to predict LE may depend on the patient population (e.g., age group, types of comorbidities). Exclusion of certain groups (e.g., patients over 90 y.o.) will limit applicability. Prevalence, severity of patient comorbidities External validity, Internal validity
Prevalence and severity of comorbidities may affect prediction performance.
In settings of higher prevalence of comorbidities, clinicans may be more prone to classify LE as especially high or especially low (context bias).
Level of detail of vignettes
External validity Differences between patient details included in vignettes and those encountered in real life will limit applicability. Format of paper quiz vs. real human encounter will also limit applicability.
Number of patients represented
Internal validity Few patient vignettes will limit accuracy and precision of outcomes.
Choice and Application of Reference Standard for LE (e.g., actuarial LE) Appropriateness of
reference standard
Internal validity Difference between years of life predicted by the reference standard and reality (validity of reference standard) may lead to underestimation or overestimation of clinicians’ performance.
reference standard characteristics such as comorbidity affects its validity. Clinician recruitment, characteristics
Sample size of clinicians
Internal validity Small sample size will limit power of study.
Subject selection External validity Identification and appropriate sampling of source population for subjects affect applicability. Potential subjects who refuse participation or do not complete assessment should be noted.
Clinician characteristics
External validity Different clinician groups will have different performance characteristics.
Assessment Methods Assessment
administration
Internal validity, External validity
Manner of assessment delivery (e.g. relaxed vs. hectic environment, timed or untimed) affects external validity. Differential access to resources during assessment (e.g., “cheating” among subjects) affects internal validity. Overall potential for
measurement bias
Internal validity (low/moderate/high)
Outcomes and Analysis Handling of
incomplete responses
Internal validity May lead to biased assessment of test performance.
Other analysis problems
Internal validity Blinding of scorers of assessments, incomplete reporting of results, problems with statistical analysis, etc.
Overall internal validity (good/fair/poor): Overall external validity
(good/fair/poor): Comments:
Data Synthesis and Analysis
I conducted a qualitative synthesis of the primary and secondary outcomes, as available,
for each included study. I did not conduct a formal assessment of heterogeneity.
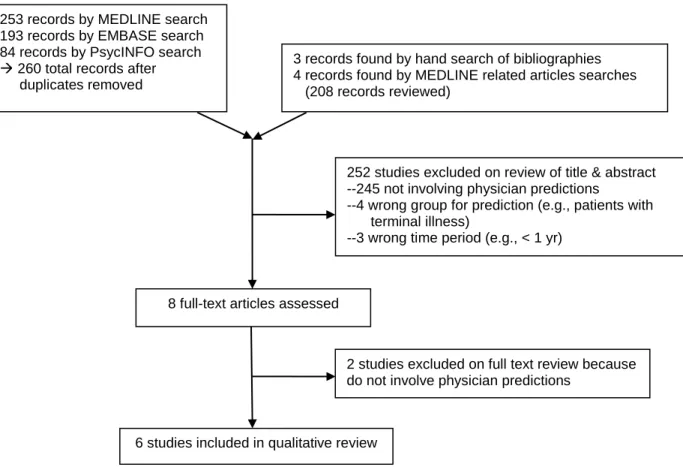
RESULTS
I identified and reviewed 475 unique titles and abstracts through the stated search
strategy. I excluded 467 of these on the basis that they were not relevant (did not address
clinician prediction of life expectancy), assessed predictions on the wrong patient population, or
assessed predictions of life expectancy that averaged less than one year. I selected eight
studies for review of full text, excluded two of these for irrelevance, and included six
cross-sectional studies in the final review (see Figure 1 below). All included studies addressed
15
vignettes or simple demographics. There were no studies that involved physician prediction of
life expectancy in real patients over the time period I specified; these type of studies appear to
be limited to predictions over short time periods5 or narrow patient populations.38
Figure 1. PRISMA flow diagram of included studies
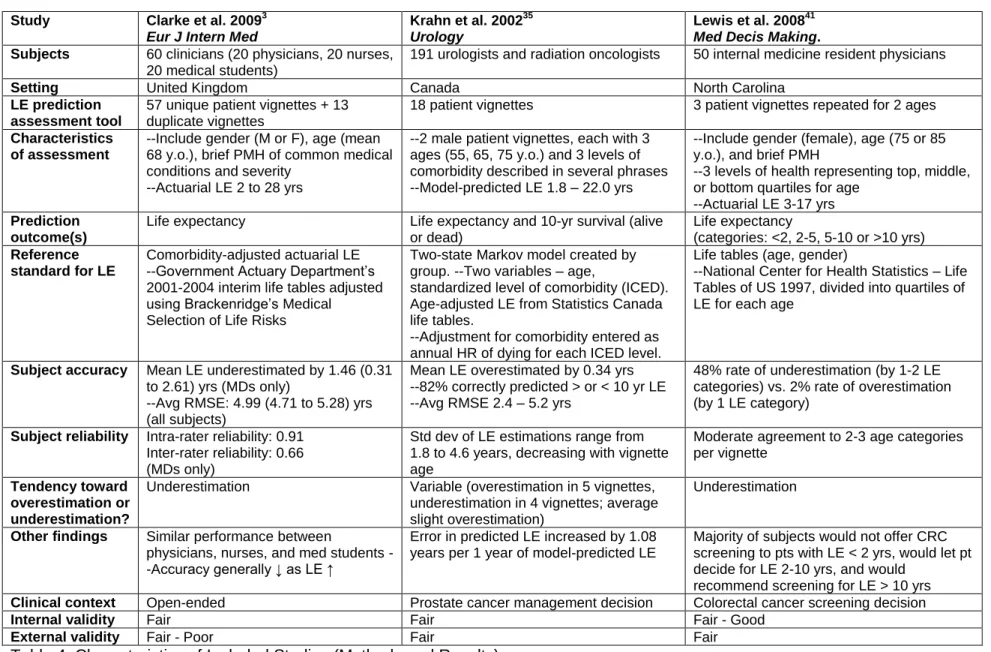
Summary Description of Included Studies
Table 4 summarizes the methods and results of the six included studies, all of which use
patient vignettes in their design. All studies were published in the last ten years and took place
in Germany, the United Kingdom, Canada, or the United States. Half of the studies (n=3)
addressed LE prediction in the context of prostate cancer treatment decisions, referencing
guidelines that limit active treatment of prostate cancer to patients with adequate LE. The
studies enrolled modest sample sizes (n = 18 to 211) of clinicians, including physicians and 252 studies excluded on review of title & abstract --245 not involving physician predictions
--4 wrong group for prediction (e.g., patients with terminal illness)
--3 wrong time period (e.g., < 1 yr)
8 full-text articles assessed
2 studies excluded on full text review because do not involve physician predictions
6 studies included in qualitative review 253 records by MEDLINE search
193 records by EMBASE search 84 records by PsycINFO search
260 total records after duplicates removed
resident physicians from various specialties, medical students, nurses, and other staff such as
physical and occupational therapists. For the purpose of this review, data were abstracted for
physicians and resident physicians (except in the case of Walz et al. 2002, for which three medical students’ responses are mixed with 16 physicians’ responses). Physician only sample
sizes ranged from n = 16 to 191. All studies provided subjects with paper surveys involving brief
patient vignettes or scenarios. The reporting of responses is heterogeneous and includes subjects’ prediction of LE in years (3 studies); LE by range of years, e.g. <2, 2-5, 5-10, >10
years (1 study); 10-year mortality risk as a percent (1 study), 10-year survival as yes or no for
each subject (1 study); and 10-year survival of an entire cohort of patient vignettes as a percent (1 study). The subjects’ predictions are compared to various reference standards, which include
LE derived from life tables without adjustment (1 study), LE from life tables divided into quartiles
based on overall health status (1 study), LE from life tables with statistical adjustment for
specific comorbidities (2 studies), LE prediction by a Markov model (1 study), and actual LE
from retrospective study of a patient database (1 study). All studies provide some reporting of the subjects’ predictive accuracy and intra- or inter-rater reliability compared to these
heterogeneous reference standards.
Quality Summary of Included Studies
Quality assessment tables for each study are provided in Appendix B, and overall
assessments of internal and external validity are summarized in the bottom rows of Table 4.
Most studies received fair or fair-poor ratings in both areas. I did not consider any to have a
definite fatal flaw warranting a poor rating. One study received a fair-good rating for internal
validity based on thorough reporting of methods and a design specifically assessing
prognostication in screening decisions. In general, internal validity was limited by the use of
vignettes rather than real patients and the uncertain performance of reference standards used
17
sizes, convenience sampling of subjects or lack of reporting on subject recruitment, and paucity
of primary care physicians among the included subjects.
Summary of Primary and Other Outcomes
The reporting of outcomes is heterogeneous and not suitable for meta-analysis. I was
able to abstract the results for physicians (including resident physicians) from those of other
clinicians in all cases except the study by Walz and colleagues, in which case medical students
are included but represented only 16% of the sample. In general, the studies show that
physicians are moderately accurate at predicting the life expectancy of older adults, but have
poor reliability as a group. Five out of six studies report that on average, physicians slightly
underestimate LE, while one study reports variable estimation (Krahn et al.,35 reporting average overestimation for 5 vignettes and underestimation for 4 vignettes, average slight
overestimation). For studies that reported LE predictions in years (n = 3), the prediction error (±
standard deviation) ranged from -1.63 (± 3.70) years34 to +0.34 (± 3.29) years.35 Table 4 shows the results of the three studies that reported other outcomes.
Regarding physician attributes associated with their predictive performance, reporting is
limited and heterogeneous. Two studies (Walz et al. 200739 and Clarke et al. 20093) report no differences in predictive performance between physicians and physicians-in-training, suggesting
that years of training may not be associated with performance. One study (Wilson et al. 200540) reports better performance among senior consultants than among junior doctors; however, they
do not report whether this difference is statistically significant and furthermore the senior
physicians were of different specialties than their juniors (urologists and oncologists vs.
surgeons), so it is not clear whether the trend may be due to years of experience or specialty.
One study did find that specialty significantly influenced accuracy (Wirth & Sieber 2012,34 geriatricians are more accurate than non-geriatricians), while another found that specialty is not
and Sieber further reported that neither subjects’ age nor gender is associated with predictive
performance. No studies examined any other demographic factors.
Study Clarke et al. 20093 Eur J Intern Med
Krahn et al. 200235 Urology
Lewis et al. 200841 Med Decis Making. Subjects 60 clinicians (20 physicians, 20 nurses,
20 medical students)
191 urologists and radiation oncologists 50 internal medicine resident physicians
Setting United Kingdom Canada North Carolina
LE prediction assessment tool
57 unique patient vignettes + 13 duplicate vignettes
18 patient vignettes 3 patient vignettes repeated for 2 ages
Characteristics of assessment
--Include gender (M or F), age (mean 68 y.o.), brief PMH of common medical conditions and severity
--Actuarial LE 2 to 28 yrs
--2 male patient vignettes, each with 3 ages (55, 65, 75 y.o.) and 3 levels of comorbidity described in several phrases --Model-predicted LE 1.8 – 22.0 yrs
--Include gender (female), age (75 or 85 y.o.), and brief PMH
--3 levels of health representing top, middle, or bottom quartiles for age
--Actuarial LE 3-17 yrs Prediction
outcome(s)
Life expectancy Life expectancy and 10-yr survival (alive or dead)
Life expectancy
(categories: <2, 2-5, 5-10 or >10 yrs) Reference
standard for LE
Comorbidity-adjusted actuarial LE --Government Actuary Department’s 2001-2004 interim life tables adjusted using Brackenridge’s Medical
Selection of Life Risks
Two-state Markov model created by group. --Two variables – age,
standardized level of comorbidity (ICED). Age-adjusted LE from Statistics Canada life tables.
--Adjustment for comorbidity entered as annual HR of dying for each ICED level.
Life tables (age, gender)
--National Center for Health Statistics – Life Tables of US 1997, divided into quartiles of LE for each age
Subject accuracy Mean LE underestimated by 1.46 (0.31 to 2.61) yrs (MDs only)
--Avg RMSE: 4.99 (4.71 to 5.28) yrs (all subjects)
Mean LE overestimated by 0.34 yrs --82% correctly predicted > or < 10 yr LE --Avg RMSE 2.4 – 5.2 yrs
48% rate of underestimation (by 1-2 LE categories) vs. 2% rate of overestimation (by 1 LE category)
Subject reliability Intra-rater reliability: 0.91 Inter-rater reliability: 0.66 (MDs only)
Std dev of LE estimations range from 1.8 to 4.6 years, decreasing with vignette age
Moderate agreement to 2-3 age categories per vignette
Tendency toward overestimation or underestimation?
Underestimation Variable (overestimation in 5 vignettes, underestimation in 4 vignettes; average slight overestimation)
Underestimation
Other findings Similar performance between
physicians, nurses, and med students --Accuracy generally ↓ as LE ↑
Error in predicted LE increased by 1.08 years per 1 year of model-predicted LE
Majority of subjects would not offer CRC screening to pts with LE < 2 yrs, would let pt decide for LE 2-10 yrs, and would
recommend screening for LE > 10 yrs Clinical context Open-ended Prostate cancer management decision Colorectal cancer screening decision
Internal validity Fair Fair Fair - Good
External validity Fair - Poor Fair Fair
Study Walz et al. 200739 BJU Int.
Wilson et al. 200540 BJU Int.
Wirth and Sieber 201234 Gerontology
Subjects 19 clinicians (6 urologists, 10 resident physicians, 3 medical students)
18 physicians (8 urologists, 2 oncologists, 8 surgeons)
211 lecture attendees (51 physicians, 38 medical students, 122 others including nurses, OTs, PTs, NAs)
Setting Canada - Quebec United Kingdom Germany
LE prediction assessment tool
50 patient vignettes Same as Clarke et al. 2009 8 hypothetical patient groups
Characteristics of assessment
--Include gender (male), age (median 67 y.o.), comorbidity list, CCI score (median 2)
--Actual survival: 60% at 10 yrs
Same as Clarke et al. 2009 --Men and women ages 0, 70, 80, and 90 --Actuarial LE 3.9 to 82.5 yrs
Prediction outcome(s)
10-yr survival (alive or dead) 10-yr mortality risk Life expectancy
Reference standard for LE
Actual patient mortality
--Quebec Health Plan database reporting of vital status for 50 randomly selected patients
--Actuarial data also used to predict LE as a second reference standard; methods not reported
Comorbidity-adjusted actuarial LE --Life tables adjusted using Brackenridge’s Medical Selection of Life Risks plus Charlson Index to derive 10-yr mortality risk
Actuarial LE from life tables (age, gender) --Statistisches Bundesamt: German death statistics 2007-2009
Subject accuracy Mean subject-predicted 10-yr survival of vignette cohort underestimates actual 10-yr survival by 14.0% (46.0% predicted vs. 60.0% actual)
--C-statistic for predicting 10-yr survival: 0.68 (0.64-0.71)
Mean mortality risk underestimated by 10.8% (95% CI 10.1-11.5%)
MDs only:
--Mean LE underestimated by 1.63 years (2.44 yrs for 70 y.o. adults, 1.81 years for 80 y.o. adults, 0.64 years for 90 y.o. adults)
Subject reliability Range of predicted survival: 20.0% of vignette cohort to 70.0% of vignette cohort
Intra-rater reliability: 0.74 (0.31 - 0.94) Inter-rater reliability: 0.56 – 0.58
Std dev of LE estimations range from 1.6 to 4.3 years, decreasing with vignette age
Tendency toward overestimation or underestimation?
Underestimation Underestimation Underestimation
Other findings Similar performance between urologists, residents, and medical students
Surgeons were least accurate (were also the most junior subjects)
Participants with geriatrics training less likely to underestimate LE
--Accuracy generally ↓ as LE ↑ Clinical context Prostate cancer management decision Prostate cancer management decision Open-ended
Internal validity Fair - Poor Fair Fair - Poor
External validity Fair - Poor Fair - Poor Fair
M. Gilliam 21
A brief summary of the methods, results, and quality of the six included studies are listed
below, in order of decreasing validity and relevance to the key question. Please see Appendix B
for more detailed reporting.
Lewis et al. 200841
Lewis and colleagues recruit a convenience sample of internal medicine resident
physicians (n = 50) in North Carolina with the aim of assessing both their LE prediction
performance and associated colon cancer screening recommendations. The resident physicians
are provided 6 patient vignettes including age (75 y.o. or 85 y.o.), gender (all female), and brief
comorbidity with severity (3 levels) intended to represent women in the bottom quartile, middle two quartiles, or top quartile of health for her age. They are asked to predict the patient’s LE in
years (open-ended), their recommendation regarding colorectal cancer screening (recommend
against, recommend for, let the patient decide, or do not discuss), and whether or not they are
uncertain about their recommendation (yes/no). The reference standard is based on the Walter
& Covinsky 20011 framework for screening older patients, and uses LE derived from life tables which is then divided into quartiles (25th, 50th, or 75th percentile).
The resident physicians’ responses for LE are reported according to the following
categories: < 2 years, 2-5 years, 5-10 years, or > 10 years. The residents choose the correct
(actuarially determined) LE category 51% of the time, underestimate by 1 or 2 categories 48%
of the time, and overestimate by no more than 1 category 2% of the time. For each patient vignette, the spread of responses is over 2-3 age categories. The residents’ screening
recommendations varied with their predicted LE; those who predicted > 10 years LE would
either recommend screening or let the patient decide and most who predicted < 2 years would recommend against or not offer screening. For predicted LE of 2 – 10 years, there was a broad
proportion of residents reported uncertainty about their screening recommendations (48-86%,
depending on vignette).
This study earns a “fair–good” rating for internal validity. Strengths include thorough
reporting of methods including survey design and distribution and a high response rate of 96%.
One weakness is that the precision of the reference standard may be limited due to the
approximation of health status into quartiles. The study earns a “fair” rating for external validity
due to its inclusion of residents only (more experienced physicians may perform differently) and
relatively few vignettes. The vignettes are reasonably sophisticated in their design and
encourage residents to think about LE in terms of screening decisions.
Krahn et al. 200235
The purpose of this Canadian study is to determine urologists and radiation oncologists’
performance at predicting the LE and 10-year survival (alive or dead) for typical prostate cancer
patients, in order to identify candidates for curative therapy (LE > 10 years). The authors mail
surveys to all actively-practicing adult urologists and genitourinary radiation oncologists
registered with appropriate professional organizations, and achieve a 69% response rate (n =
138 urologists, 53 radiation oncologists). The subjects are provided 18 patient vignettes of men with localized prostate cancer, but are instructed to determine the patients’ years to death from
other causes besides the cancer. They are also asked to select one of three prostate cancer
management options for the patients. The vignettes include age (55, 65, or 75 y.o.), gender (all
male), and comorbidity (3 levels: healthy, moderate, or severe comorbidity). The reference
standard for LE is derived from a 2-state Markov model developed by the authors that
incorporates data from life tables and the Index of Coexistent Disease (ICED). The model predicts a range in LE of 1.8 – 22 years for the patient vignettes.
On average, the physicians underestimate LE by 0.34 years, with a standard deviation
23
study authors and reported in Appendix B). Overall, 31% of physicians’ predictions were
accurate within +/- 1 year of model-predicted LE, 48% were within 2 years, and 67% were within 3 years. The RMSE for the physicians’ estimates ranged from 2.4 to 5.2 years, depending on
the vignette. When asked to predict 10-year survival (yes/no), physicians were correct 82% of the time. Clinicians’ error increases by 1.08 years per year of the model’s prediction. Neither
patient age nor comorbidity are associated with physician error, however.
The study earns a “fair” rating for internal validity; main limitations are the unsupervised
completion of surveys by study participants (opportunity for “cheating”) and unclear validity of
the model created by the study authors to predict LE as a reference standard. The study also earns a “fair” rating for external validity; strengths include their sampling design for subject
selection and use of patient vignettes that would be appropriate for difficult screening decisions,
while weaknesses include the lack of primary care doctors in their sample and lack of female
patient vignettes.
Clarke et al. 20093
The authors recruit 20 physicians and 40 medical students and nurses in the United
Kingdom by an unclear recruitment strategy and provide them with 57 unique and 13 duplicate
patient vignettes. Two physicians are general practitioners. The vignettes included patient age (range 55 – 82), gender (both male and female), and a short description of comorbidities and
their severity. The subjects are asked to predict LE for each vignette patient without reference to
any particular clinical decision. The reference standard for LE is life tables for the United
Kingdom adjusted down for comorbidity and severity using actuarial statistics, for a mean
reference LE of 11.6 (range 2 to 28) years.
Physician subjects underestimate the reference LE by a mean and 95% confidence
reference LE (error increased as reference LE increased). Physicians underestimate LE in 62%
of cases and overestimated in 29%. Intra-observer reliability for physicians, based on the 13
duplicate patient vignettes, was 0.91 (statistical derivation of this statistic not reported), while
inter-observer reliability was 0.66. There are no statistically significant differences in the mean
prediction errors of physicians, students, and nurses.
This study earns a “fair” rating for internal validity based primarily on its moderately
detailed patient vignettes and unclear accuracy of the reference standard as a proxy for actual LE. It earns a “fair—poor” rating for external validity based on the small sample of physicians
including only two who would be expected to make cancer screening decisions in their work, lack of reporting about subject recruitment. On the other hand, the study’s patient vignettes do
appear to represent the types of older adult outpatients who would face difficult screening
decisions.
Wilson et al. 200540
Similar to both Krahn et al. and Walz et al., the study authors are interested in physicians’ predictions of the life expectancy of prostate cancer patients around the 10 year
mark for making treatment decisions. The recruitment of 18 United Kingdom physicians (8
urologists, 8 surgeons, and 2 oncologists) is not described. The physicians are given the same
57 unique patient vignettes and 13 duplicate vignettes as described in the 2009 study by Clarke
and colleagues,3 which include patient age (range 55 – 82), gender (both male and female), and a short description of comorbidities and their severity. Unlike the Clarke study, the physicians
are asked to estimate mortality risk at 10 years as a percent for each patient. The reference
standard is the same comorbidity-attuned LE from actuarial data as described in the Clarke
study, but the authors further apply the Charlson Index to convert LE in years to mortality risk at
25
On average, the physicians underestimate mortality risk by 10.8% (range 3.9 to 33.2%)
in absolute percentage points. Fifteen physicians predominantly underestimated, while three predominantly overestimated. Intra-rater reliability is reported as 0.74 (range 0.31 – 0.94) based
on the 13 duplicate cases, while inter-rater reliability is 0.58 (derivation of this statistic is not
reported). The authors note that if a 50% probability of survival to 10 years were used as a
threshold for some medical decision for this subject group, as many as 34% of vignette patients
would be denied treatment based on underestimation of LE, and 24% would be inappropriately
offered treatment based on overestimation of LE.
This study earns a “fair” rating for internal validity; concerns include unclear accuracy of
their reference standard and a potential intellectual conflict of interest in that the authors are
engaged in the development of a software tool to help physicians predict LE, which may have led them to interpret subjects’ performance in a poorer light. The study earns a “fair—poor”
rating for external validity based on the small sample size, lack of reporting about subject
selection and subject demographics, and exclusion of primary care physicians.
Wirth and Sieber 201234
This German study is unique in that it subjects are asked to predict the LE of patient
scenarios based on age and gender alone, without information about health status. The authors
recruit 211 health care workers (51 physicians including 11 geriatricians and 160 others) who are attendees of the primary author’s lectures on general medicine topics. The subjects are
asked to predict the LE in years of average German men and women age 0, 70, 80, and 90.
They are not offered any particular clinical context. The reference standard is LE derived from
life tables.
I obtained data for the 51 physicians from the primary author and excluded data for
infants (age 0). On average, physicians underestimated LE by 1.63 years with a standard
For example, their average (± standard deviation) prediction error for the 70 y.o. woman with an
actuarial LE of 16.4 years was -2.02 (±4.34) years, but for the 90 y.o. man with an actuarial LE of 3.9 years it was -0.03 (± 2.05) years. Compared non-geriatricians, geriatricians’ (n = 11)
predictions were more accurate and had similar reliability: average LE underestimated by 0.69
(± 3.37) years.
This study earned a “fair—poor” rating for internal validity; the main limitation is that
physicians were asked to determine LE for average patients of an age and gender without knowledge of any health information. It is likely that in real life, information about patients’ health
or other factors would alter these age/gender LE predictions to a greater or lesser extent. On
the other hand, the reference standard may be considered more accurate to real life because
the life table estimates were not adjusted for comorbidity in a way that may introduce
uncertainty. The study earned a “fair” rating for external validity for its relatively modest sample
size and selection of lecture attendees who may differ in some way from primary care
physicians at large.
Walz et al. 200739
Similar to Krahn and colleagues, the purpose of this Canadian study is to determine clinicians’ performance at predicting 10-year survival (alive or dead) for typical prostate cancer
patients, in order to identify candidates for curative therapy vs. watchful waiting. The recruitment
of 6 urologists, 10 resident physicians, and 3 medical students in Quebec province is not
described. These 19 clinicians are provided 50 patient vignettes that are based on real patient
data obtained through retrospective review of a health insurance database, including age
(median 67 y.o.), gender (all male), and comorbidities as reported by ICD-9 codes. All patients
also had prostate cancer, but subjects were instructed to ignore this diagnosis and determine
27
uses real patient data. The authors additionally determined actuarial LE (converted to 10-year
survival) for each patient, but do not report how this actuarial LE was derived.
On average, the clinicians predicted that 46.0% of the cohort of 50 vignette patients
would survive to 10 years, with a range for 20.0% to 70.0%. The actual 10-year survival of the
cohort is 60.0%, while the actuarial-predicted survival is 57.3%. Therefore, the clinicians on average underestimated the cohort’s actual survival by 14 percentage points (absolute
difference). Results for physicians (n = 16) cannot be separated from medical students (n = 3)
from the data provided. Results for individual patients within the cohort of 50 vignette patients
are also not omitted. Receiver operating curves for the three types of clinicians are provided. The area under the curve (AUC) of the ROC for urologists is 0.67 with a 95% CI of 0.60 – 0.72;
similarly for resident physicians it is 0.69 with a 95% CI of 0.64 – 0.74.
This study earns a “fair–poor” rating for internal validity. Major concerns include the use
of ICD-9 codes to describe the vignette patients’ comorbidities; the coding of actual patients’
conditions may be incomplete and may not describe the severity of a condition. For instance, there is only one ICD-9 code for Alzheimer’s type dementia, which could indicate mild cognitive
impairment with a relatively benign course or advanced, immobilizing dementia with a very poor
prognosis. Furthermore, there is no description of how the vignettes were administered. The study also earns a “fair-poor” rating for external validity because of its small sample size,
omitted reporting of the subject selection process and of subject demographics, and exclusion
of primary care providers who might make cancer screening decisions (the specialties of
resident physicians are not reported).
Physician Reliability Declines with Increasing LE
To determine whether the reliability with which physicians predict patients’ life
expectancies varies with patients’ actuarial life expectancies, I examined the standard deviation
physician predictions for a given patient. The two authors I contacted for original data (Krahn et
al. 2002 and Wirth and Sieber 2012) provided this information. Krahn and colleagues report the standard deviation of 191 physicians’ predictions for 18 patient vignettes with unique
model-predicted LE. Wirth and Sieber report the standard deviation of 51 physicians’ predictions for 6
patient scenarios with unique actuarial LE. I report results for the larger study, Krahn et al.,
below. I examined Wirth & Sieber separately and found a very similar trend.
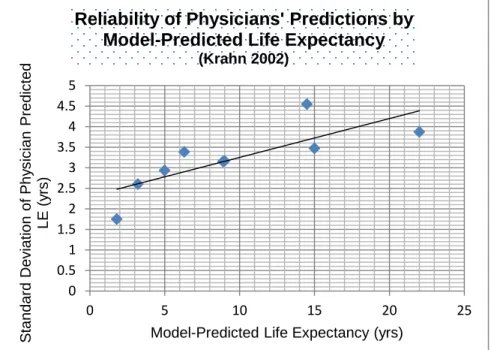
Figure 2. Reliability of physicians’ predictions declines with increasing model-predicted life expectancy, Krahn et al. 2002.35 Simple linear regression applied.
Figure 2 plots the standard deviations against model-predicted (reference) LE. In general, as actuarial LE increases, physicians’ predictions become increasingly unreliable or imprecise
(standard deviation increases). I used linear regression to generate a very rough estimation of
the standard deviation that would be expected for patients with model-predicted life
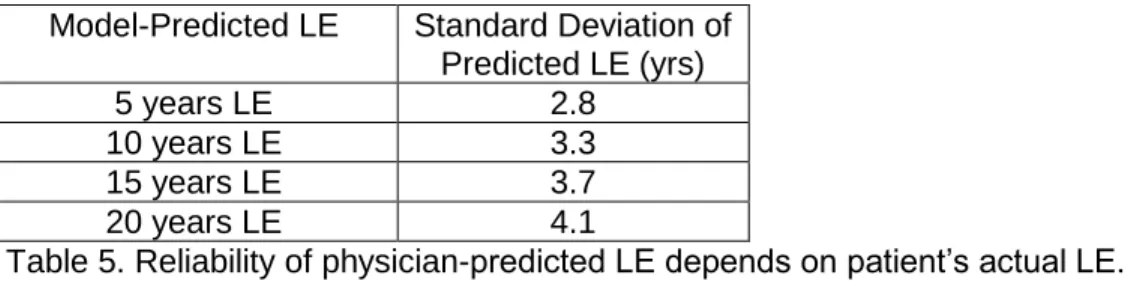
expectancies of 5, 10, 15, and 20 years. Table 5 reports these rough estimates, which are
similar to those derived from the Wirth & Sieber data. 0
0.5 1 1.5 2 2.5 3 3.5 4 4.5 5
0 5 10 15 20 25
S
tan
da
rd
Dev
iati
on
of
P
hy
s
ic
ian
P
red
ic
ted
LE
(
y
rs
)
Model-Predicted Life Expectancy (yrs)
Reliability of Physicians' Predictions by
Model-Predicted Life Expectancy
29
Model-Predicted LE Standard Deviation of Predicted LE (yrs)
5 years LE 2.8
10 years LE 3.3
15 years LE 3.7
20 years LE 4.1
Table 5. Reliability of physician-predicted LE depends on patient’s actual LE.
For patients who have an expected 5 years of life remaining, the expected standard deviation is close to 3; in other words, out of a sample of physicians like those in Krahn’s study, roughly two
thirds would be expected to predict a LE between 2 and 8 years. For a patient with an expected
20 years of life remaining, about two thirds would be expected to pick between 16 and 24 years.
DISCUSSION
This systematic review attempts to characterize the accuracy and reliability of health care providers’ predictions of life expectancy for older adult outpatients, as well as attributes
associated with predictive performance. The quality of 6 identified studies is limited and their
reporting of results heterogeneous. Overall, physicians are moderately accurate in their
predictive ability for the life expectancy of patient vignettes. As a group, they have a tendency to underestimate life expectancy by 1–2 years and 10-year mortality risk by 10-15%. As individuals,
however, predictive performance varies greatly with poor reliability among individuals. This poor
reliability has important implications for the use of life expectancy in screening decisions.
Implications for Screening Decisions
Three questions are important when it comes to the use of provider predictions of life
expectancy when making cancer screening recommendations. First, are providers willing to
undertake a complex individualized approach to screening decisions, considering numerous
individual patient factors, as opposed to a simpler, age based rule? Second, are primary care providers as a whole able to accurately and precisely predict older patients’ life expectancy
degree will providers use information about life expectancy when making final screening
decisions with their patients? This third question is relevant because many factors may enter into screening decisions, including patient preferences, physicians’ responses to different and
competing guidelines, peer influences, financial incentives and rules set up by practices, and so
on.
This systematic review attempts to answer the second question only. In the case of
cancer screening, we are interested in predicting life expectancy above or below a threshold at
which the probability of a patient benefiting from cancer screening outweighs the probability of her being harmed by the screening. This threshold has also been referred to as a “lag time”1113
to benefit, referring to the idea that cancers for which we have screening tests require some
years to grow from a screen-detectable but asymptomatic tumor to a potentially fatal tumor
burden. In randomized controlled trials of cancer screening, survival curves for screened and
unscreened groups are not observed to separate until five (breast cancer)42 or approximately four to five (colorectal cancer)43 years. However, it is important to remember that patients must not only live long enough to potentially benefit from screening, but also long enough that the
magnitude and likelihood of potential benefit outweighs the magnitude and likelihood of potential
harms. Therefore, it may be the case that this benefit-to-harm ratio is not favorable until 10, 15,
or even 20 years depending on how one chooses to weigh benefits against harms. Furthermore,
there are few randomized controlled trials of cancer screening including patients over age 70, so
the changes in harms of screening that may be experienced with increased age and comorbidity
can only be estimated.13 The issue of threshold choice is discussed further below.
Returning to the second question, then, are primary care providers accurate and precise
enough to predict life expectancies above or below a threshold of 5, 10, 15, or 20 years? In
short, the data are varied but physicians are moderately accurate at predictions around the 5
and 10 year thresholds, and their poor reliability as a group becomes a limiting factor at
31
queried by Krahn et al. correctly predicted patients’ life expectancy above or below a 10-year
threshold 82% of the time.35 The resident physicians studied by Lewis et al. were correct above or below a 10-year threshold 75% of the time (excluding one patient vignette with a LE of
exactly 10 years) and above or below a 5-year threshold 77% of the time.41 Wilson et al. asked physicians to predict 10-year mortality risk. If a ≤50% mortality risk were used as the threshold
for screening, then physicians would correctly predict over or under only 42% of the time. If the threshold were changed to only screen patients with a ≤30% mortality risk, however, then
physicians would improve to correctly predicting over or under 69% of the time.40
The decreasing reliability of physicians’ life expectancy estimates made over longer
periods of time is important because it indicates that, for higher life expectancy thresholds,
physicians become less reliable as individuals. The importance of this decreasing reliability
depends on the life expectancy threshold one chooses for screening decisions. Table 5
presents very rough estimates of physicians’ reliability at life expectancy thresholds of 5, 10, 15,
or 20 years based on one modest-sized study. Unfortunately, it is difficult to determine physicians’ average accuracy around these thresholds because complete data sets allowing
interpolation are only available for the Krahn et al. and Wirth & Sieber studies, which have
different trends regarding accuracy (Krahn et al. is the only study that does not show consistent
underestimation of life expectancy).
It is important to remember that in clinical practice, physicians do not always make a firm
recommendation for or against cancer screening, but may share information with the patient and
encourage him to make a screening decision through informed decision making. In their study of
resident physicians, Lewis et al. asked participants to make a screening recommendation, including the option to “let the patient decide.” Letting the patient decide was positively
associated with reported clinical uncertainty, and the majority of all recommendations (53%)
of informed or uninformed decision making in clinical practice. Patients’ choices may be a
moderate driver of the screening rate of older adults.41
Physician predictions versus prediction rules for life expectancy
While this review has examined physicians’ predictions of life expectancy based on
experience or intuition, there are, of course, resources available to physicians to assist them in
their predictions. Life tables for large populations are readily available online. In their
much-referenced framework for individualized cancer screening decisions,1 Walter and Covinsky further provide life expectancies for older U.S. men and women broken down by quartiles of
health. Finally, a number of moderately sophisticated prediction rules for life expectancy have
been developed and validated in prospective cohorts of older adults. A 2012 systematic review
by Yourman and colleagues summarizes the characteristics and quality of these prognostic
indices.2 Of note, only two of these indices extend over a period of years that might be appropriate for cancer screening. The first index developed by Lee and colleagues predicts
4-year mortality risk for community-dwelling older adults.44 The second developed by Schonberg and colleagues predicts 5-year mortality risk for community-dwelling adults over age 65,45 with extended follow-up to 9-year mortality.46 Both require similar inputs of 11-12 risk factors for mortality including biometric factors, comorbidities, and functional status, and produce scores
that correspond to mortality risk ranging from <5% to 64% (Lee et al.) or 7% to 92% (Schonberg
et al. 9 year mortality risk). Both are available in an interactive format online.4 Depending on the life expectancy threshold agreed upon for cancer screening, these indices might or might not
extend far enough to assist screening decisions. Yourman et al. describe these indices as being
well calibrated with good to very good discrimination, but overall conclude that prospective
testing of the indices in samples larger and more diverse than their validation cohorts is lacking,
33
An important question remains as to whether physicians’ predictions or predictions
based on a “tool” such as one of these prognostic indices or the Walter and Covinsky framework
do a better job of estimating patients’ true years of life remaining. Unfortunately, I have been
unable to find a satisfactory head-to-head comparison for life expectancy predictions made over many years. The studies of physicians’ predictions in this review cannot be indirectly compared
to prognostic indices because there is not enough patient information contained in any of the
patient vignettes to calculate a score using a prognostic index.
In his review article on prognostication, Kellet briefly discusses literature comparing physicians’ intuition to prediction models in other, generally short-term clinical scenarios, such
as post-surgical outcomes and survival among patients in intensive care units.47 In some cases clinicians perform as well as or better than available prediction tools, and in other cases they fall short of the predictive tools’ accuracy. For example, several studies have compared scores from
the APACHE II scoring system for intensive care patient mortality to physicians’ predictions of
mortality, and found that physicians predictions’ and APACHE scores were similar in their ability
to predict real patient outcomes.48-50 This type of prognostication over the short term based largely on physiologic data differs from predictions of life expectancy over many years in the
context of cancer screening, however. Further research is needed to compare humans to
prediction rules in this context.
It is possible that physicians’ use of prediction tools along with their own clinical
judgment may be superior to the use of either alone. As part of their study of resident physicians’
screening decisions for patient vignettes, Lewis and colleagues41 asked participants to predict the life expectancy of three 85 y.o. women independently, then provided them with life tables
including quartiles. Access to this tool was associated with 26% of residents changing their
screening recommendation for one of the three vignettes, but no significant change in
are not greatly influenced by their access to this tool, but a modest proportion found it of great
enough value to change their recommendations.
Limitations of this Review
Limitations of this systematic review include the absence of a second reader, as well as
the decision to include studies that may be deemed by some readers to have low quality due to
one of the several limitations of the evidence listed below. I chose to report on all studies that
met eligibility criteria in this report in order to include as much evidence as possible for this
understudied research question, regardless of quality. I am encouraged that, despite the
limitations of individual study designs, the authors generally draw similar conclusions from their
results. Finally, a second reader would have been valuable for a review such as this one to
verify appropriate inclusion and exclusion of studies, as well as abstraction and reporting of
results.
Limitations of the Evidence
Patient Vignettes as a Proxy for Real Patient Encounters
A common limitation to all of the included studies in this review is their reliance on paper
surveys with patient vignettes as a substitute for live patient encounters. For each study, the
information contained in these vignettes is limited to a few lines or less (in the case of the Wirth & Sieber study, just the patient’s age and gender). In real life outpatient scenarios, physicians
would likely have access to much more information, such as details of the past medical history, information about the patient’s functional status, smoking status, self-perceived health, and
other factors that have been associated with life expectancy in cohort studies.4445 The appearance and behavior of a live patient may helpfully inform or unhelpfully bias the
physician’s life expectancy assessment. Physicians are also susceptible to cognitive biases that
may alter their assessments of live patients in ways that are not measurable with patient