Overweight and Obesity Prevalences for United States Military Veterans
By
Nathaniel Almond
A Master's Paper submitted to the faculty of The University of North Carolina at Chapel Hill
In partial fulfillment of the requirements for the degree of Master of Public Health in
the Public Health Leadership Program
Chapel Hill
2006
L
Abstract
Objective: Overweight and obesity prevalences are established for the U.S. general population and for the 1.4 million U.S. active duty military; however, the prevalences of overweight and obesity for the 26.4 million U.S. military veteran population are unknown. This study will determine the U.S. military veteran prevalences of overweight and obesity and adjusted odds ratios for overweight and obesity for veterans as compared to non-veterans adjusted for characteristics which affect the relationship between veteran status and overweight and obesity. Methods: The author performed an analysis of the 2004 BRFSS (Behavioral Risk
Factor Surveillance System) to determine overweight and obese prevalences and adjusted odds ratios for overweight and obesity for military veterans as compared to non-veterans.
Results: Prevalence of overweight (BMI ;::o: 25 kg/m2) in veterans was 73.3%
Conclusions: Both male and female veterans had high crude prevalences of
overweight and obesity, although these prevalences were not as high as reported in prior studies of veterans who use Veterans Health Administration medical facilities. These prevalences for overweight and obesity were similar to non-veteran prevalences after adjusting for socio-demographic and health status confounders. Demonstration of overweight and obesity burdens in veterans is important for its implications in assessment of primary preventive efforts within the active duty military population as well as for establishing a baseline
Introduction
The prevalences of overweight and obesity within the United States are of great public health concern. Both overweight (defined as Body Mass Index (BMI) ~25 kg/m2) and obesity (defined as BMI ~30 kg/m2) have increased in prevalence in the U.S. since 1960. 1"3. Approximately 97 million adults meet this National
Heart Lung and Blood Institute criteria for overweight. 4 Two specific annual nationwide surveys serve to measure the prevalences of overweight and obesity in the U.S. population. These surveys are the National Health And Nutritional Examination Survey (NHANES) and Behavioral Risk Factor Surveillance System (BRFSS).
Administered by the Centers for Disease Control and Prevention (CDC)'s
National Center for Health Statistics, the NHANES includes measured height and weight. The CDC recommends that the data are more accurate when reported as multiple years of data rather than individual years of data, and this data is usually reported as groups of at least two years of data. NHANES age-adjusted
prevalence data from 2003-2004 estimated that 71% of men, 62% of women, and 66% of the total U.S. population were overweight, while 31% of men, 33% of women, and 32% overall were obese.5 NHANES data also demonstrate the increases in overweight and obesity age-adjusted prevalence from 1960-2002. 1"3
Prevalence of overweight in U.S. adults increased from 45% in 1960-1962 to 66% in 2003-2004 5, while obesity prevalence of U.S. adults increased from 13% in
The BRFSS is an annual state-based cross-sectional telephone survey of adults
ages 18 and over conducted by state health departments with assistance from the
CDC. Height and weight measures are self-reported. Population age-adjusted
overweight prevalence estimates of the U.S. population from the 2001 BRFSS
were 66% for men, 51% for women, and 58% overall. The age-adjusted
prevalence estimates for obesity in 2001 were 22% for men, 21% for women, and
22% overall. 7
The tendency to under-report weight and over-report height has been
documented. 8 Thus, self-reported BRFSS data tends to underestimate the
prevalences of overweight and obesity compared to NHANES data, which is
measured. In a study of data from 1999-2000, this underestimation was 5.7% for
overweight and 9.5% for obesity.9 Understanding this underestimation is useful
when comparing data from BRFSS, NHANES, and other sources.
Overweight and obesity are associated with increased morbidity and mortality as
well as increased economic burden to society. The mortality attributed to obesity
has been estimated to be between 111,919 and 365,000 deaths annually.10"13
Comorbid conditions associated with obesity include hypertension, dyslipidemia,
stroke, gallbladder disease, diabetes, coronary heart disease, and osteoarthritis, as
well as breast, prostate, colorectal, gall bladder, and endometrial cancer.14 The
Overweight and obesity are an important concern to the United States military, which commissioned an Institute of Medicine report on military weight
management in 2003.16 This report demonstrated the burden of overweight and obesity to the military forces as well as the necessity for preventive efforts in this population.
The United States census reports detailed demographic information on U.S. military veterans. Military veterans are defined by the U.S. Census as anyone who is not currently on active duty, but who once served in the United States Army, Navy, Air Force, Marine Corps, or Coast Guard, or who served in the Merchant Marine during World War II. This definition includes persons discharged from the service, counting even those who served for a brief period oftime, and it also includes retirees, who have served more than 20 years. It does not include currently active duty members or active duty for training for national guard or reserve.17
The 2000 U.S. census counted 26.4 million veterans, which accounts for 13% of the U.S. population 18 or older.17 Of these, approximately 5 million use the VHA system18 and 1.9 million receive retired pay 19. In 2004-2005, there were 1.4
Several studies have estimated the prevalences of overweight and obesity in various military or veteran sub-populations. The prevalence of overweight based on self-reported height and weight in active duty personnel in 2002 was 62% in males, 32% in females, and 57% overall.21 These numbers are surprising given physical fitness and body fat standards required of military service members. One explanation may be the inability of BMI, which is a proxy for adiposity, to
distinguish "overfat" individuals from very athletic and heavily muscled individuals in the BMI range of25-29.9 kg/m2• A limitation of the active duty
survey was that it did not differentiate between overweight and obese. However, the study did stratify by gender and age. The trend in overweight males increased by 10% from age 20-25 (19%) to age 26-34 (29%) to ~5 (34%). As uncertainty exists regarding the ability ofBMI to correctly classify overweight, making inferences regarding longitudinal development of overweight and obesity is difficult.
A comparison of the overweight prevalence between Air Force recruits and BRFSS age-adjusted controls found that 42% of the general population in the control group was overweight , compared to only 22% in the cohort of Air Force recruits 22• In another study, 38-64 year old military health care eligible
knowing whether respondents were veterans or spouses of veterans and of sampling only respondents ages 38-64 prohibits drawing definitive conclusions regarding all veterans, but it does suggest that a high percentage of retired veterans are overweight.
The prevalence of overweight among 1,800,000 veterans receiving care from Veterans Health Administration (VHA) outpatient clinics in the Year 2000 was estimated to be 73% among men and 68% among women, based on measured heights and weights.18 Obesity prevalence was 33% among men and 37% among women. Although this data included only veterans in its sampling, the data is not representative of the overall veteran population because VHA users have been shown to have poorer health status and lower income than the overall veteran
I . 24
popu atwn.
It is difficult to directly compare prevalences in overweight and obesity between studies of military populations and studies of the entire U.S. population.
are higher than NHANES and BRFSS estimates for the general U.S. population.
However, national prevalence estimates of overweight and obesity for the entire
population of military veterans are unknown.
The epidemic of obesity has impacted the military in multiple ways. This includes
every aspect of personnel, from recruits to retirees. Specifically, the potential
pool of recruits is decreased due to the increasing proportion of adolescent/young
adults who do not meet military entry standards for weight. It is estimated that
13-18% ofU.S. men and 17-43% of U.S. women in the general population exceed
the weight standard for enlistment.25 This increases the resources needed for
recruiting efforts.16 Overweight prevalence within the military itself is also
increasing, with the overall self-reported prevalence of overweight among all
active duty personnel increasing from 49% in 1995 to 57% in 2002 21• In 2002,
the Department of Defense (DOD) discharged 1,419 personnel due to failing the
body weight standard.16 As increasing numbers of service members are
discharged secondary to weight problems, the recruiting requirements for the
military increases further. Lastly, overweight and obesity adds to the economic
burden of the DOD's health care budget, which is currently estimated at $36
billion with projected costs in 5 years to be $61 billion annually.26
Establishment of overweight and obesity prevalences for all U.S. veterans is
needed for several reasons. First, knowledge of these prevalences has implications
disease. Informing primary preventive efforts could also inform other non-military behavioral modification programs. Next, these prevalences could serve as a baseline comparison for Veteran's Health Administration planners as well as other policy makers who are examining smaller subsets ofthe veteran population. Lastly, as veterans may re-enlist or be recalled to duty, they constitute a valuable potential resource for the nation's defense and knowledge of their disease burden would inform military preparedness.
opportunities for those who fail to meet them. Understanding the development of disease that occurs to members of a population after they have left the
expectations and standards of such an environment could inform other non-military weight management programs.
The aims of this study were to: 1) determine the overall prevalence of overweight and obesity among all United States Veterans by gender and age group using self-reported BMI data from the 2004 Behavioral Risk Factor Surveillance System and 2) To compare the prevalence of overweight and obesity in the veteran population with a comparison non-veteran population by calculating odds ratios which adjust for characteristics that confound the relationship between veteran status and overweight and obesity.
Methods:
Data Source and Study Population:
Data were used from the 2004 BRFSS (Behavioral Risk Factor Surveillance System), a monthly conducted, annually aggregated and reported state-based cross-sectional random-digit dialed telephone survey conducted by state health departments with assistance from the CDC's Behavioral Surveillance Branch. The BRFSS is the largest continuously conducted telephone health survey in the world. The BRFSS 's annually revised questionnaire is designed to measure behavioral risk factors in a representative sample of United States
state health departments using a disproportionate stratified sampling design. Data are weighted to represent population estimates for each state. The BRFSS
questionnaire includes core questions that are asked by every state in addition to module questions that are used at each state's discretion. Further info on the BRFSS methodology may be obtained at
http://www.cdc.gov/brfss/technical_infodata/surveydata/2004.htrn.
Measures:
The 2004 BRFSS included core questions of veteran status (see table I) as well as core questions of self reported height and weight, which are needed to calculate Body Mass Index (BMI). (see table I). Overweight and obesity prevalences determined by BMI classification were the primary outcome measures. Self reported height and weight were used to calculate BMI as: (weight in
pounds/(height in inches)2)(703). BMI was classified as I) normal or under weight (BMI < 25 kg/m2), or 2) overweight but not obese, (BMI ;:::: 25 kg/m2 but
< 30 kg/m2) or 3) obese (BMI ;:::: 30 kg/m2) or 4) overweight (BMI ;:::: 25 kg/m2).
These classifications for overweight and obesity are according to the guidelines published by the National Heart, Lung, and Blood Institute 4
Covariates
(did not graduate high school, graduated high school, attended college or
technical school, graduated college or technical school), annual household income
(5levels), self-reported health status (dichotomized to good to excellent and fair
to poor) and smoking status (never, former, or current) were considered as
possible confounders of the relationship between veteran status and overweight or
obesity prevalence.
Analysis
The analysis included only respondents who answered both the veteran status
questions and the self reported height and weight questions (287,467 respondents
ofthe total 303,882 surveyed). Ofthese, 39,627 indicated they were military
veterans. Veterans were classified as those who responded yes to question I and
responded with c,d, ore to question 2. (see Table I) According to the U.S. census,
current active duty and national guard members are not veterans. 17
STAT A 9.0 survey commands were used in all analyses to account for BRFSS's
complex multistage cluster sampling survey design.
Frequencies were calculated for various demographic and health behavior
characteristics of both the veteran and non-veteran populations. These include the
variables listed in the covariate section above.
Crude prevalence of overweight but not obese (BMI ;;:: 25 kg/m2 and< 30 kg/m2),
veterans and non-veterans using proportion estimation commands for these weight categories. Since this determination of crude prevalence (see specific aim #I) was for surveillance purposes only and the intention was not to do statistical comparisons, standard errors for these crude prevalences are reported instead of confidence intervals.
Due to the high prevalence of males in the veteran group compared to the non-veteran group, BMI category was stratified by gender and determined using STAT A survey proportion subpopulation commands. Also, since older veterans would be more likely to have served during an earlier period of service which included a draft instead of during an all-volunteer veteran period, the prevalence of BMI category by veteran status was also determined for various age categories by using STAT A survey proportion subpopulation commands.
To further examine the relationship between veteran status and overweight and obesity, two logistic regression models were used to calculate adjusted prevalence odds ratios. In the first model, the dependent outcome was overweight,
categorized as BMI ;;:: 25 kg/m2. In the second model, the dependent outcome
was obesity, categorized as BMI ;;:: 30 kg/m2. Covariates that in the literature
male U.S. population than female veterans are representative of the overall female U.S. population. In consideration of this difference, interaction between veteran status and gender was assessed for inclusion in the models using the Wald test.
Variables that were not found to confound the relationship between veteran status and overweight and obesity were considered for removal to arrive at final model for the relationship between I) veteran status and overweight and 2) veteran status and obese. This study received exemption from review from the UNC School of Public Health IRB.
Results
Demographics
Subjects included 287,467 respondents responding to height, weight and veteran status questions, 39,627 (13.8%) indicating they were veterans. Retired veterans made up 13% of this veteran sample, while 18% reported getting health care at the VHA. Table 2 displays demographic and health status characteristics among veterans and non-veterans. The veteran population in this sample was primarily male (94%), married (72%), older than 35 years (92%), and white (81 %). Over 93% of veterans had at least a high school education, while over 43% of veterans reported incomes of greater than 50,000 dollars per year. Also, over 80% rated their health as good, very good, or excellent. More veterans reported formerly smoking (43%) than never smoking (36%). The non-veteran population included a larger percentage of females, non-whites, non-married, non-high school
Prevalences of overweight and obesity
Table 3 describes prevalences of overweight but not obese, obese, and overweight in veterans and non-veterans by gender. Prevalence of overweight but not obese in veterans was markedly higher in males (48%) than females (32%). Prevalence of obesity in veterans was similar between males (25%) and females (21 %). Overall prevalence of veteran obesity (25%) was lower than overall veteran prevalence of overweight but not obese (47%).
Age stratification by gender and veteran status for prevalence of overweight but not obese are displayed in figures I and 2, while age stratification by gender and veteran status for prevalence of obese are displayed in figures 3 and 4.
Foil owing are discussion of ranges and trends by gender and age groups: veteran prevalences of overweight but not obese for males ranged from a low of 44% to a high of 50%, while non-veteran prevalences ranged from a low of 31% to a high of 50%. Generally, veteran prevalences had little variation between different age groups; however, non-veteran prevalences were markedly lower in the younger age group of 18-24 (31 %) than in subsequently older age groups.
high of 31%. Age group trends were also similar between veterans and non-veterans, with one distinctive difference. Although both groups had their lower obesity prevalences at the extreme age categories of 18-24 and 80+, the veteran 25-29 year old males had similar obesity prevalence to the 18-24 year old veteran males (16% in comparison to 13 %respectively), while the non-veteran 25-29 year old male obesity prevalence was markedly higher than the non-veteran 18-24 year old male group (22% in comparison to 14%, respectively). Between the ages of30 to 69, both veteran and non-veteran male groups have similarly high obesity prevalences.
Female veteran data by age was characterized by larger standard errors,
there was a corresponding increase in obesity prevalence until age 64, with a following decrease in obesity prevalence by age category.
In sununary, veteran and non-veteran overweight and obesity data by gender and age displayed similar trends and ranges with two notable exceptions. First, male non-veteran overweight but not obese prevalence was markedly lower in 18-24 year old groups than subsequently older non-veteran aged groups, while male veteran overweight but not obese prevalence was similar between all age groups. Next, while male veteran obesity prevalence in the 25-29 year old group was similar to the 18-24 year old male veteran obesity prevalence, the prevalence of obesity of male non-veterans in the 25-29 year old group was higher markedly higher than the 18-24 year old non-veteran group and was similar to obesity prevalences in subsequently older age categories for non-veterans. Lastly, data regarding different aged categories of female veterans was imprecise but appeared similar to female non-veteran data.
Multivariate Analysis
outcome. Prior to developing these models, bivariate analysis between veteran status and potential confounders as well as between the dependent outcomes and potential confounders was performed using chi-square testing, with the goal of identifYing variables that could be removed from these models ifthey did not appear to be confounders. Variables were considered potential confounders if they were associated with p values of less than 0.1 0. Each variable met these criteria in the bivariate analysis.
Prior to the development of the full models, interaction was assessed between gender and veteran status with the Wald test. This test indicated significant interaction, by p value of the interaction term, between gender and veteran status when tested with logistic regression models that included only the dependent outcome, veteran status, gender, and an interaction term for veteran status and gender, as in the following models:
Overweight Model:
Logit P(Overweight) =a+ ~(veteran status)+ )2(gender) +
o
1 (veteran status x gender) Obesity Model:Logit P(BMI :80 kg/m2 ) =a+ ~(veteran status)+ )2(gender)
+
o
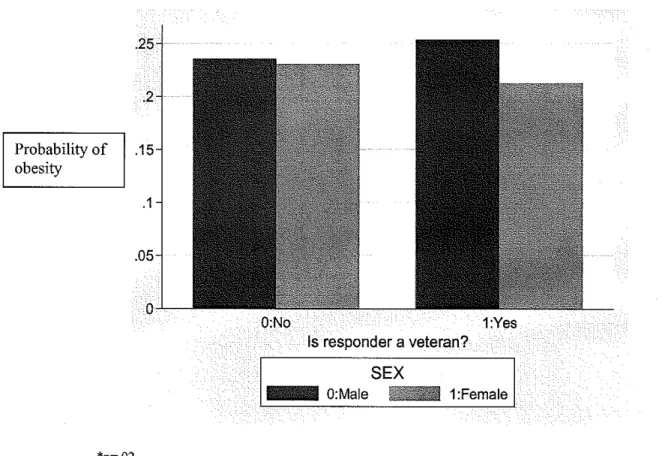
1(veteran status x gender)gender. Fignre S suggested that the probability of overweight associated with
veteran status was higher in males but essentially unchanged in females. In figure
6, the probability of obesity was higher in male veterans compared to male
non-veterans but lower in female non-veterans compared to female non-non-veterans. In
summary, this interaction between gender and veteran status on the probability of
the dependent outcomes appeared to be significant in the preliminary analysis.
To further develop these models, dummy variables were used for variables of
race, education, income, and smoking history. Veteran status, gender, marital
status, and self-perception of health were each assessed as dichotomous variables,
while age was assessed as a continuous variable. Additionally, interaction
between veteran status and gender was included to form the following models:
Overweight Model:
Logit P(Overweight)
=a+
il(veteran status)+ ')'J(gender) + ')'z(age) + ')'J(race2) + /'4(race3)+ ')'s(race4) + /'6(marital status)+ ')7(education leve12) + ')'s( education level3) + ')'9( education leve14) + ')'10(income level2) +')'11(income level3) + ')'12(income level4) + ')'13(income levelS)+ /'I4(self-perception of health)+ ')'15(smoking history2) + /'t6(smoking history3) +
o
1 (veteran status x gender)Obesity Model:
Logit P(Obesity)
=a+
il(veteran status)+ /'I(gender) + )2(age) +')'3(race2) + /'4(race3)+ ')'s(race4) + /'6(marital status)+ ')7(education level2) + ')'s( education level3) + ')'9( education level4) + ')'10(income level2) + ')'11(income level3) + ')'12(income level4) + ')'13(income levelS)+ ')'J4 (self-perception of health)+ /'Is( smoking history2) + /'J6(smoking history3) +
o
1(veteran status x gender)Using these full models, interaction was first assessed between veteran status and
gender. Although the interaction between veteran status and gender was initially
significant in preliminary analysis, after the interaction was placed in the full
with p values of 0.88 and 0.25 in the models for overweight and obesity, respectively. Additionally, the odds ratios associated with veteran status in the models which did and did not include the interaction term were not significantly different. Therefore, interaction was not included in the final models. The criteria for determining whether to drop a potential confounder from the final model was to assess whether the odds ratio for veteran status changed by more than five percent in a model with the potential confounder removed compared to the veteran status odds ratio in the initial model containing all potential
confounders. In both models for overweight and obesity, only gender and age met this criterion for confounding the relationship between the dependent variables and veteran status; therefore, all variables except for gender and age could be eliminated, making a preliminary analysis model of:
Modell:
Logit P(overweight)
=a+
~(veteran status)+ ')'1(gender) + 12(age)Model2:
Logit P(obesity)
=a+
~(veteran status)+ /'!(gender)+ ')'z(age)Although these logistic models would have been the most simplified, they would not have contained basic demographic information commonly described in the literature when reporting overweight and obesity data. Therefore, all variables from bivariate analysis that were initially determined to be potential confounders were returned to the model, making the final overweight and obesity models: Final overweight model:
'Yn(income level3) + -y12(income level4) + -yn(income level5) +
'YI4(self-perception of health)+ -y15(smoking history2) + 'YI6(smoking history3) Final obesity model:
Logit P(obesity)
=ex+
,6(veteran status)+ -y1(gender) + ')2(age) +')'J(race2) + 'Y4(race3)+ 'Ys(race4) + 'Y6(marital status)+ 'YJ(education level2) + -y8( education level3) + -y9( education level4) + -y10(income level2)
-y11(income level3) + -y!2(income level4) + -y13(income level5)
+
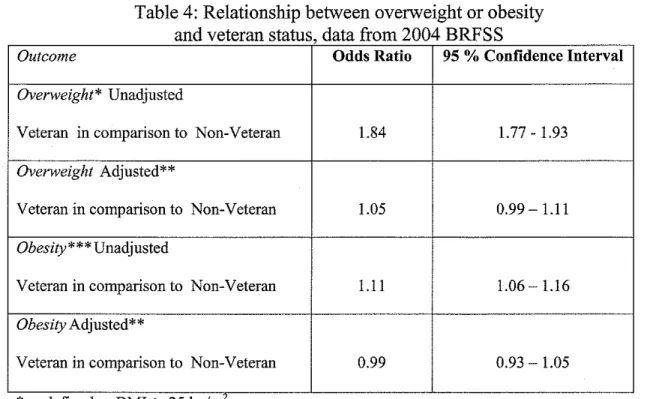
-y14(self-perception of health)+ -y15(smoking history2) + 'YI6(smoking history3) In these models, veterans were 1.05 times as likely as non-veterans to be
overweight (95% CI 0.99-1.11 ), while veterans were 0.99 times as likely as non-veterans to be obese (95% CI 0.93-1.05) (see table 4).
Discussion:
This is the first reported prevalence of overweight and obesity for a nationally representative sample of U.S. military veterans. This study determined the self-reported prevalence of overweight and obesity in U.S. military veterans, stratified this prevalence by age group and gender, and examined the relationship between veteran status and overweight and obesity prevalence. These findings could serve as a baseline to monitor trends in the overall veteran population or as a
comparison to related subgroups such as active military or smaller subsets of veterans such as retirees or VHA medical facility users. The BRFSS has included veteran questions since the year 2000. By continuing to include veteran questions on future BRFSS questionnaires, the CDC could help to facilitate further
surveillance of trends in overweight and obesity in this population.
surveillance as the two groups were not comparable demographically. Comparison to data from prior prevalence studies is also difficult due to differences in methodology, such as covariate and outcome definition and
measurement. Also, as this study was a survey of veteran overweight and obesity prevalences in 2004 and not intended as a direct comparison to national surveys from other years, it did not age-adjust these prevalences, making direct
comparisons to national survey prevalences, which are age-adjusted, difficult. However, both the veteran and non-veteran population groups from the 2004 BRFSS data had slightly higher prevalences of obesity compared to the overall 2001 BRFSS population data and lower prevalences of obesity than the overall 2002-2004 NHANES population data. This is consistent with the tendency of self-reported BRFSS data to underestimate obesity prevalence compared to NHANES measured data.
Contrasting the overall burden of overweight between the veteran population and actively serving military members may help to inform primary prevention efforts within the active military. Active military population prevalence of overweight in 2002 is lower in both genders than in the population of veterans from the 2004 BRFSS data. In one study of the active military population, 62% of males and 32% of females were overweight. 21 In this study of veterans, 73% of males and 54% offemales were overweight. Although the veteran and active military populations are different groups, particularly with regards to age, this data does suggest the need for future research to further examine the trajectory of
overweight and obesity among military members.
Age group stratification in this cross-sectional study does not convey a
Trends of higher disease prevalence with subsequently older age groups have also been demonstrated in prior cross-sectional studies of overweight in active duty military members and in subsets of military veterans such as VHA users and are consistent with our study of veterans. Active duty prevalence of males with BMI
~7.8 kg/m2 was higher in subsequently older groups, with 19% in ages 20-25, 29% in ages 26-34, and 34% in ages 35 and older. 21 Obesity prevalence of veteran males using VHA medical facilities was also higher with subsequently older aged groups, with 18-29 year old males group 27% obese and 30-39 year old males 38% obese, with obesity prevalences ranging from a low of37 to a high of 40% in subsequently older male age groups till age 70. 18 Increased obesity prevalences in older aged groups of VHA user females is also established, with 23% obesity prevalence in females ages 18-29 and 35% prevalence in ages 30-39, with obesity ranging from a low of 35% to a high of 46% in subsequently older age groups until age 70.18
could inform the trajectory ofthe development of obesity within veterans and help to target appropriate aged groups for primary prevention efforts.
Neither the relationship between veteran status and overweight nor the
relationship between veteran status and obesity was significant once adjusted for confounding factors. This analysis failed to reveal a strong association between serving in the military and prevalence of overweight or obesity. However, this has implications for behavioral management of obesity. The military experience includes regnlarly scheduled fitness tests and enforced body weight standards. This experience might be thought to convey some lasting protective benefit from overweight or obesity. However, this study did not find a significant association between veteran status and overweight or obesity prevalence.
Considerations
Another limitation of this study is the inability ofBMI to differentiate between body fat and muscle tissue. It is possible that some veterans could be
misclassified as overweight due to a large amount of muscle tissue.16 This ar~a requires further research.
This study and its results emphasize the prevalence of overweight and obesity in the U.S. veteran population. Additional research could further delineate the trajectory of overweight and obesity and also suggest appropriate age groups to approach with primary intervention programs. Future longitudinal studies could better inform the trajectory of the development of the disease burden. This study also provides a baseline prevalence of overweight and obesity for the overall U.S. military veteran population, which could be useful for researchers and planners as they examine trends in either the overall population of veterans, related
References
1. Hedley AA, Ogden CL, Johnson CL, Carroll MD, Curtin LR, Flegal KM. Prevalence of overweight and obesity among US children, adolescents, and adults, 1999-2002. JAMA. Jun 16 2004;291(23):2847-2850.
2. Kuczmarski RJ, Flegal KM, Campbell SM, Johnson CL. Increasing prevalence of overweight among US adults. The National Health and Nutrition Examination Surveys, 1960 to 1991. JAMA. Jul 20
1994;272(3):205-211.
3. Ogden CL, Fryar CD, Carroll MD, Flegal KM. Mean body weight, height, and body mass index, United States 1960-2002. Adv Data. Oct 27
2004(347):1-17.
4. Clinical Guidelines on the Identification, Evaluation, and Treatment of Overweight and Obesity in Adults--The Evidence Report. National Institutes of Health. Obes Res. Sep 1998;6 Suppl2:51S-209S.
5. Ogden CL, Carroll MD, Curtin LR, McDowell MA, Tabak CJ, Flegal KM. Prevalence of overweight and obesity in the United States, 1999-2004. JAMA. Apr 5 2006;295(13): 1549-1555.
6. CDC. Health, United States, 2003. Overweight, obesity, and health weight among persons 20 years of age and over, according to sex, age, race, and Hispanic origin: United States, 1960-62, 1971-74, 1976-80,1988-94, and
1999-2 000 [http://www. cdc. gov /nebs/ data/bus/tab les/2003/03 hus068. pdf. Accessed 03/31, 2006.
7. Ahluwalia IB, Mack KA, Murphy W, Mokdad AH, Bales VS. State-specific prevalence of selected chronic disease-related characteristics--Behavioral Risk Factor Surveillance System, 2001. MMWR Surveil! Summ. Aug 22 2003;52(8):1-80.
8. Nawaz H, Chan W, Abdulrahman M, Larson D, Katz DL. Self-reported weight and height: implications for obesity research. Am J Prev Med. May 2001 ;20( 4):294-298.
9. Yun S, Zhu BP, Black W, Brownson RC. A comparison of national estimates of obesity prevalence from the behavioral risk factor
10. Flegal KM, Graubard BI, Williamson DF, Gail MH. Excess deaths associated with underweight, overweight, and obesity. JAMA. Apr 20 2005;293(15): 1861-1867.
11. Allison DB, Fontaine KR, Manson JE, Stevens J, Vanltallie TB. Annual deaths attributable to obesity in the United States. JAMA. Oct 27
1999;282(16): 1530-1538.
12. Mokdad AH, Marks JS, Stroup DF, Gerberding JL. Correction: actual causes of death in the United States, 2000. JAMA. Jan 19
2005;293(3):293-294.
13. Mokdad AH, Marks JS, Stroup DF, Gerberding JL. Actual causes of death in the United States, 2000. JAMA. Mar 10 2004;291(10):1238-1245.
14. Bray GA. Medical consequences of obesity. J Clin Endocrinol Metab. Jun 2004;89(6):2583-2589.
15. Finkelstein EA, Fiebelkorn IC, Wang G. National medical spending attributable to overweight and obesity: how much, and who's paying?
Health Aff(Millwood). Jan-Jun 2003;Suppl Web Exclusives:W3-219-226.
16. Institute of Medicine (U.S.). Subcommittee on Military Weight
Management. Weight management: state of the science and opportunities for military programs. Washington, D.C.: National Academies Press;
2003.
17. Richardson C, Waldrop J, United States. Bureau of the Census. Veterans, 2000. Washington, DC: U.S. Dept. of Commerce Economics and Statistics Administration U.S. Census Bureau; 2003.
18. Das SR, Kinsinger LS, Yancy WS, Jr., et a!. Obesity prevalence among veterans at Veterans Affairs medical facilities. Am J Prev Med. Apr 2005;28(3):291-294.
19. Actuary. DOD Statistical Report on the Military Retirement System. In: Actuary DOot, ed; 2004.
21. Bray R, Janice M, Vincus AA, Pemberton MR. 2002 Department of Defense Survey of Health Related Behaviors among military personnel. http://www.tricare.osd.mil/main/news/DoDSurvey.htm#3.2.6, 2005.
22. Poston WS, Haddock CK, Peterson AL, et al. Comparison of weight status among two cohorts of US Air Force recruits. Prev Med. May
2005;40(5):602-609.
23. Kress AM, Hartzel MC, Peterson MR. Burden of disease associated with overweight and obesity among U.S. military retirees and their dependents, aged 38-64,2003. Prev Med. Jul2005;41(1):63-69.
24. Agha Z, Lofgren RP, VanRuiswyk N, Layde PM. Are patients at
Veterans Affairs medical centers sicker? A comparative analysis of health status and medical resource use. Arch Intern Med. Nov 27
2000; 160(21 ):3252-3257.
25. NolteR, Franckowiak SC, Crespo CJ, Andersen RE. U.S. military weight standards: what percentage ofU.S. young adults meet the current
standards? Am J Med. Oct 15 2002; 113(6):486-490.
26. Mateczun J. General Remarks by Deputy Navy Surgeon General. Paper presented at: 45th Occupational Health and Preventive Medicine
Conference Opening Ceremonies; March 20, 2006; Hampton, VA.
27. McTigue KM, Garrett JM, Popkin BM. The natural history of the
Table 1: 2004 BRFSS questions on veteran status and weight/ height Veteran Status Questions
1. The next question relates to military service in the United States Armed Forces, whether in the regular military or in a National Guard or Reserve Unit. Have you ever served on active duty in the United States Armed Forces, either in the regular military or in a national Guard or military reserve unit?
2. Which ofthe following best describes your service in the United States Military a. Currently on Active duty,
b. Currently in a national guard or reserve unit c. Retired from military service
d. Medically discharged from military service, e. Discharged from military service
Weight/ Height Questions
Table 2: Percentage distribution of selected characteristics of
Veterans and Non Veterans data from 2004 BRFSS
,
Characteristic
N*
Veterans
Non-Veterans
[% (% SE)]
[% (% SE)]
N=39,627 N=247840
Gender 287,467
Male 94.1 (0.2) 43.0(0.2)
Female 5.9 (0.2) 57.0_{_0.2)
Age 287,467
18-24 1.4 (0.1) 14.9 (0.2)
25-34 7.0 (0.3) 19.8 (0.2)
35-44 12.1 (0.3) 21.5 (0.2)
45-54 16.4 (0.4) 19.0 (0.2)
55-64 23.9 (0.4) 11.3 (0.1)
>65 39.0 co.5i 13.4 (0.1)
Marital Status 286,767
Married 71.5 (0.4) 57.0 (0.2)
Not Married 28.5 (0.4) 43.0 (0.2)
Race 285,031
White 81.2 (0.5) 69.0 (0.2)
African American 8.6 (0.3) 10.0 (0.1)
Hispanic 5.5 (0.3) 14.9 (0.2)
Multiracial and non-Hispanic 4.8 (0.3) 6.2 (0.1)
Education 284,043
Did not graduate High School 6.4 (0.2) 12.4(0.2)
Graduated High School 29.4 (0.4) 29.9 (0.2)
Attended College or 29.9 (0.5) 26.0 (0.2)
Technical
Graduated College or 34.2 (0.5) 31.7 (0.2)
Technical
Annual Household Income 252,127
Less than 15,000 6.8 (0.3) 12.3 (0.2)
15,000 to 25,000 16.2 (0.4) 17.8 (0.2)
25,000 to less than 35,000 14.0 (0.4) 13.2 (0.2) 35,000 to less than 50,000 19.3 (0.4) 16.1 (0.2)
50,000 or more 43.6 (0.5) 40.7 (0.2)
Self Reported Health Status 286,600
Good, very good, or excellent 80.2 (0.4) 84.5 (0.2)
Fair or Poor 19.8 (0.4) 15.5 (0.2)
Smoking Status 286,618
Never Smoked 36.3 (0.5) 58.3 (0.2)
Former Smoker 43.2 (0.5) 20.6 (0.2)
Current Smoker 20.4 (0.4) 21.1 (0.2)
Table 3: Prevalence of overweight but not obese, obese, and overweight by veteran status and gender, data from 2004 BRFSS
% Overweight but not obese* (%SE)
Veteran Non-Veteran
Males
48.0 (0.5) 42.8 (0.4)
N~ll4,805 Females
32.4 (1.6) 29.4 (0.2)
N~l72,662 Overall
47.1 (0.5) 35.2 (0.2)
N~287,467
*defined as BMI ;;, 25 and< 30 **defined as BMI ;;, 30
***defined as BMI ;;, 25
% Obese ** (%SE) % Overweight
***
(%SE)Veteran Non-Veteran Veteran Non-Veteran
25.3 (0.4) 23.5 (0.3) 73.3 (0.4) 66.4 (0.3)
21.2 (1.4) 23.0 (0.2) 53.6 (1.7) 52.4 (0.2)
Figure 1: Male % Overweight But Not Obese (SE) By Veteran Status, Data From 2004 BRFSS
-
0"'
"' 55 "' 45 "' 35
.<:1 25 0
15
*
5j EJ veterans 111 non-veterans
Age
Figure 2: Male% Obese (SE) By Veteran Status, Data From 2004 BRFSS
I EJ veterans 111 non-veterans
L________ _ _ _ _ _ _ _ - '
Figure 3: Female% Overweight But Not Obese (SE) By Veteran Status, Data From 2004 BRFSS
! -' o
1.,
I-I " 55
I
:::
-'= .,45 "'35 I " ' "'25 I ·-..Q"' 015 :;: 5 '
"'
>
0
"' 55 "' 45 "' 35
.c 0 25
15
#. 5
1m veterans 111 non-veterans
Age
Figure 4: Female% Obese (SE) By Veteran Status, Data From 2004 BRFSS
m veterans 111 non-veterans
Age
Probability of overweight
.2
*p~ .001
Figure 5: Interaction* between Veteran status and gender on probability of overweight**
O:No 1:Yes
Is responder a veteran?
SEX
1:Female
I
O:Male
Figure 6: Interaction* between Veteran status and gender on probability of obesity**
.2
Probability of .15 obesity
.1
.05
0
O:No 1:Yes
Is responder a veteran?
SEX O:Male 1
' 1:Female
I
*p~.02
Table 4: Relationship between overweight or obesity and veteran status data from 2004 BRFSS
'
Outcome Odds Ratio 95 % Confidence Interval
Overweight* Unadjusted
Veterau in comparison to Non-Veterau 1.84 1.77 - 1.93
Overweight Adjusted**
Veteran in comparison to Non-Veterau 1.05 0.99- 1.11
Obesity*** Unadjusted
Veteran in comparison to Non-Veterau 1.11 1.06- 1.16
Obesity Adjusted**
Veteran in comparison to Non-Veterau 0.99 0.93-1.05
* defined as BMI ~ 25 kg/m
-"
** Adjusted for age, gender, marital status, race, education level, income level, smoking history, and self-rated health status