Correlation between seismicity and topographic
lineaments in western North Carolina
by Hannah Robinson
Senior Honors Thesis in the Department of Geological Sciences University of North Carolina at Chapel Hill
April 2019
I. Abstract
To discover what is causing earthquakes in western North Carolina, I conducted research to confirm my hypothesis that earthquakes in western North Carolina lie in planes that correlate to topographic lineaments, and thus, to active fault zones. In North Carolina, the only known active fault is the Boone fault, which lies in the northwest corner of the state. A small fault, it is
unlikely that the Boone fault could cause all of the earthquakes in the western portion of the state. In order to test my hypothesis, I compiled data from various sources. This included taking strike and dip measurements of outcrop fractures, studying structural and geologic deformation, and using ArcGIS software to analyze the location of earthquake hypocenters found from the USGS database. I found evidence to support my hypothesis, where earthquakes and their subsequent damage lied parallel or closely parallel to the topographic lineaments surrounding them. My findings support the notion that, in addition to the Boone fault, there are more young and active faults in western North Carolina.
II. Introduction
When most North Carolinians think about earthquakes they recall the 5.8 magnitude Virginia quake that shook the mid-Atlantic coast of the United States in 2011. However, many residents of North Carolina would be surprised to learn that, over the past 40 years, there have been at least 130 earthquakes in the western part of their own state. Albeit small (most under M=3), these earthquakes are substantial enough to be felt and to cause noticeable damage and deformation.
western North Carolina between 1978 and 2019. Next, I analyze the importance of rock outcrops and how their strike orientations can be related to topographic lineaments. Lastly, I take a closer look at earthquake damage to structures in Watauga County, along the same road where my rock outcrops are exposed. By compiling this research, I was able to test my hypothesis.
III. Earthquake zones: Fitting three-dimensional planes through earthquake
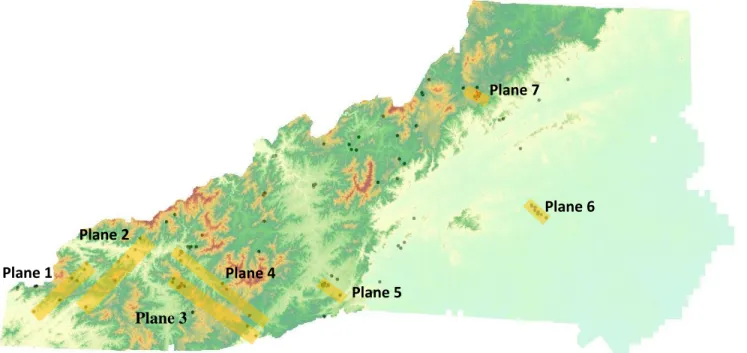
By using ArcGIS software, I was able to view a variety of earthquakes in three dimensions. In nature, we would typically expect earthquakes to occur along fault planes. However, when mapping a hypocenter, and using technology to do so, we have to account for a margin of error in determining the exact location of an earthquake. This is especially true for older earthquakes where the technology of locating the hypocenters was not as accurate. We correct for any errors by using expanded 3D zones that we can view as cross sections of the earth. These zones, of which I found seven, correlate to topographic lineaments shown in Figures 2 through 8.
Plane 1 Plane 2 Plane 4 Plane 7 Plane 6 Plane 5
Figure 1: DEM of western North Carolina. Planes 1 – 6 represent the intersection of best-fit planes through earthquake hypocenters. The yellow boxes show where the planes make contact with the surface of the earth.
Figures 2-8 show the individual cross sections of each of the seven planes from two views, 90 degrees apart. Earthquakes within the plane are depicted in blue.
View 1
View 2
Plane 1 Figure 2
View 1
View 2
Plane 2 Figure 3
5 km 10 km
5 km 10 km
5 km 10 km
5 km 10 km
15km 30km
View 1
View 2
Plane 3 Figure 4
View 1
View 2 Figure 5
Plane 4
5 km 10 km
5 km 10 km
5 km 10 km
5 km 10 km
Plane 6
View 1
View 2 Figure 7
View 1
View 2 Plane 5 Figure 6
Plane 6
5 km 10 km
5 km 10 km
10km 20 km
2.5 km 5 km
2.5 km 5 km
The earthquakes excluded from these seven planes could not be correlated to a topographic lineament for a few different reasons. In some cases, there are simply not enough earthquakes to argue that a fault zone exists in that area. In other cases, there are earthquakes that can fit to a plane but the plane did not correlate to a topographic lineament so I did not include it in my research.
Plane 7 Figure 8
View 2
View 1
2.5 km 5 km
2.5 km 5 km
Figure 9 depicts a map of ancient fault zones in Western North Carolina. Looking back at Figure 1, there are certain topographic features that correspond to ancient fault zones where we
would expect to see earthquakes, but do not. The Brevard Fault Zone is one of these instances (Figure 10). A known ancient fault that can be clearly seen on any map of North Carolina, it is surprising to see almost no earthquakes surrounding it. While some recent earthquakes fall along
Figure 10 shows the ancient Brevard fault zone, which is hardly associated with any earthquakes in the past 40 years.
ancient fault zones, most do not. This tends to be the case in many areas of North Carolina. However, in the cases where earthquakes do fall along ancient fault zones, like in Planes 1 and 2, we have to wonder, is there a younger active fault overlying the ancient ones? Are recent
earthquakes associated with ancient fault zones?
IV. Outcrops
One of the best ways to examine the impact of fault zones is to look at the deformation of the earth up close. Hannah Holtzman, Kevin Stewart, and I travelled to Boone in February 2019 to look at rock outcrops on the side of Highway 321. We measured the strike orientations of six outcrop fractures and compiled the data into stereonet rose diagrams (Figures 12&13).
Outcrop 1 fractures’ strike north-south, which does not correlate with the topographic lineaments. Outcrop 2 fractures’ have variable strikes, but some are parallel or nearly parallel to the three topographic lineaments present in Figure 4. Outcrop 3 fractures’ do not strike parallel to the nearby topographic lineaments, but do strike SE-NW, parallel to the Boone fault.
Fractures in outcrops 4 and 5 strike SE-NW, mirroring the lineaments labeled in Figure 13, which are also parallel to the Boone fault. The fractures in outcrop 6 show a considerable variation in strike but align with the lineaments surrounding it.
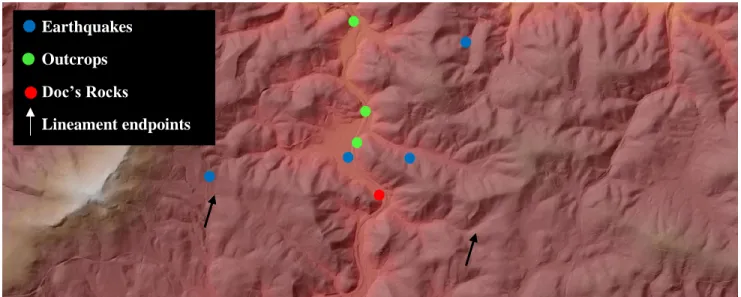
Outcrop locations
Figure 12 shows the locations of outcrops 1-3 and the topographic lineaments around them, depicted with dotted lines.
Outcrop 1
Outcrop 3 Outcrop 2
Although some of these outcrops do not represent the Southeast-Northwest direction we would expect in such close proximity to the Boone fault, they make sense in terms of
deformation. When a fault, like the Boone fault, causes deformation, the fractures and structure damage will not exclusively favor one direction. While the large areas of deformation and deformation patterns may follow this general direction, there are sure to be areas in between that crack, fold, and move in any direction. Alternative strike directions will not dominate the overall deformation when looked at from a broad point of view, but they will still exist.
V. Doc’s Rocks earthquake damage
An August 2013 earthquake that caused a landslide and other subsequent damage on the border of Blowing Rock and Boone is one of many pieces of evidence for small fault zones in western North Carolina. The owners and workers of Doc’s Rocks, a gem store in Boone, felt a
Figure 13 shows the locations of outcrops 4-6 and the topographic lineaments around them.
Outcrop 6 Outcrop 4
Outcrop 5
6
hard thud on the afternoon of August 25, 2013. Though a small earthquake in magnitude,
measured at M=2.9, the damage was not extreme but was certainly noticeable. “Doc”, the owner of the shop with a master’s degree in geology, described feeling the p-waves but not the
subsequent s-waves, indicating the close proximity of the store to the earthquake hypocenter. After the initial shock of the earthquake, Doc noticed several changes to his building and the surrounding foundation. Behind the shop is a deck that leads to an upward sloping hill with a 2-foot stone wall at its base. The earthquake formed a crack that propagated through the hillslope, the retaining wall, and a nearby tree (Figure 14).
Upon further investigation of the hillslope, we found a landslide scarp directly above where the crack had propagated. Hannah Holtzman, who has conducted significant research on
landslides in the area, noted that, while the earthquake could not have been the lone actor in the landslide, it catalyzed its movement downhill. Additionally, a wooden staircase built up against
the hill has been slightly displaced (Figure 15). A few other minor shifts in the foundation of the building show tangible evidence of earthquake damage. This includes, but is not limited to, a shift in verticality of the store walls, a drop in a cement sidewalk, and a crack cutting through a large portion of Highway 321, which runs in front of the store (Figure 16). Connecting the 2013 earthquake with every instance of damage in and around the storefront creates a line that mirrors a topographic lineament lying parallel to the Boone fault (Figure 17). As further evidence to support the “Doc’s Rocks” lineament, the strike orientations of outcrops 4 and 5 mentioned earlier lie roughly parallel to it. These outcrops exist less than half a mile from the storefront.
Figure 16: Crack propagated through Highway 321 from Aug 2013 earthquake.
Earthquakes
Outcrops
Doc’s Rocks
Lineament endpoints
VI. ArcGIS Tutorial: Projecting Points on a Map in ArcMap and ArcScene
ArcMap
When plotting points on a map (or DEM layer) in ArcMap, it is sometimes helpful to have a base map to ensure that your DEM layer is exactly where it should be.
To do this, go to File Add Data Add Base map Next, import your DEM layer, if you have one.
1. Select the Add Data button in your toolbar (Beige square with black +) and select your file.
a. An alternative way to import your DEM is to select Catalog on the far right
navigate to your DEM file right click on the file and select Unpack. 2. The DEM layer may show up without color. To change this double click on the layer
file and go to the Symbology tab. Select a color scheme from the Color Ramp drop down list.
3. To make your DEM easier to see and analyze, you can add the Hillshade effect. Open Arc Toolbox 3D Analyst Tools Raster Surface Hillshade choose DEM from drop down list.
4. Select Dem transparency 50%
Lastly, you must import your data points. These data points should be in an excel file. 1. Select Arc Toolbox from your toolbar (a red button).
3. Once your excel file is displayed in your table of contents, right click on the file name.
4. Select Display XY Data.
5. Make sure ArcMap is selecting the correct X and Y coordinates, and press OK. 6. In some cases, the DEM layer and Excel table information may not be projected in
the same plane. To check, right click on each layer and select Properties. Under the Source tab scroll down to XY Coordinate System to make sure each layer is projected in the same coordinate system.
ArcScene
In ArcScene you must have a topographic map or some type of layer file because it is not possible to use base maps.
1. Select the Add Data button in your toolbar (Beige square with black +) and select your file.
2. The DEM layer may show up without color. To change this double click on the layer file and go to the Symbology tab. Select a color scheme from the Color Ramp drop down list.
3. Select the Base Heights tab. Select the “Floating on a Custom Surface” option. Below “Elevation from features” there will be a drop down list. Select “custom”. To the right of this drop down list is a box where you can change the vertical exaggeration of your map. Inputting a “1” will give you the true map scale, while inputting a 2, 3, or 4 may show your mountains and valleys better.
1. Select Arc Toolbox from your toolbar (a red button).
2. Open Conversion Tools Excel Excel to Table. Select your excel file and wait for ArcScene to convert your file (this can take a few minutes).
3. Once your excel file is displayed in your table of contents, right click on the file name.
4. Select Display XY Data.
5. Make sure ArcScene is selecting the correct X, Y, and Z coordinates, and press OK. 6. In some cases, the DEM layer and Excel table information may not be projected in
the same plane. To check, right click on each layer and select Properties. Under the Source tab scroll down to XY Coordinate System to make sure each layer is projected in the same coordinate system.
If any layers ever do not display it helps to right click on the file and select Zoom to Layer to see where in space they are.
Running into issues
export the file as a shapefile and re- import it as new data, selecting your new column as the z coordinate. If for some reason your Z coordinate does not display, there is another way. Double click on your point file. Navigate to the Base Heights tab. Under Elevation from features select Use a constant value or expression. In the drop down list, select the name of your Z coordinate column and select OK.
2. I ran into issues projecting my earthquake points onto my topographic map because my DEM layer did not have a defined projection. Whereas ArcMap will resolve this issue for you automatically, ArcScene does not project on the fly and cannot fix this problem. To fix this issue we defined the data projection for the DEM layer (in my case we used North Carolina 1983 FIPS 3200 Feet). We then took the earthquake points and projected them to create a new shape file in the same plane as the DEM (North Carolina 1983 FIPS 3200 Feet) and put it in ArcScene.
a. Another (perhaps simpler) solution to the problem presented in #2 is to import the DEM and define the projection in feet (NC 1983 FIPS 3200 Feet, for example) and project the earthquake points in WGS 1984. Because the earthquake points are in decimal degrees, they do not project correctly in a feet projection.
Similarly, the DEM that I am using is scaled in terms of feet, so it does not
display correctly in WGS 1984. Although it seems counterintuitive to project your points differently than your layer pack, this is the only way it works.
VII. Discussion
fault. If I were to continue my research to find undeniable proof of additional fault zones in North Carolina, I would have to look at more cases like Doc’s Rocks where earthquake damage consistently supports the strike of the lineaments and outcrop fractures surrounding it. Jesse Hill and Kevin Stewart, along with a team of geologists, found the Boone fault zone to be, “the first seismically active fault documented in the western North Carolina Blue Ridge.”2 Their evidence for this came from doing small-scale research in the town of Boone by looking at earthquake damage, outcrops, and landslides. While my research finds evidence that the Boone fault cannot stand alone, I would have to look at earthquake deformation up close to confirm that more fault zones exist.
In a region where plate tectonics are assumed to be stagnant, it is surprising that earthquakes are occurring and that, therefore, the earth is shifting. Yes, the movement of these fault zones may be miniscule, but it is movement nonetheless. If we look at the data presented and the myriad of earthquakes that have occurred, we must conclude that the Boone fault could only have caused the earthquakes closest to it. In research presented by Kevin Stewart in 2007, he found a correlation between topographic lineaments and earthquake epicenters. He found evidence for active fault zones, the Swannanoa and Laurel Creek faults, both south of Boone.4 Epicenters do not allow us to see the three-dimensional occurrence of earthquakes, but Stewart’s research adds further evidence to support the presence of active faults in the area. If the Boone fault has caused deformation in Watauga County similar to other areas that border the western edge of the state, why should we have any doubt that there are more faults like it?
VIII. Conclusion
IX. References
1. ArcGIS program software
2. Old Wine in New Bottles: Active Tectonics and Active Landscapes in an Ancient Orogen.
In: Carolina Geological Society 79th Annual Meeting. October 5-72018. pg. 108
3. USGS earthquake points, 1978-Jan 2019, https://earthquake.usgs.gov/earthquakes/search/ 4. Stewart, Kevin. Active fault zones in the Blue Ridge of western North Carolina (abstract).