Digital Persuasion:
Jane Austen’s
Persuasion
as a Test Case for Mapping,
Visualization, and Interpretation in the Digital Humanities
By
Ella Winthrop Koeze
Honors Thesis
Department of English and Comparative Literature
University of North Carolina-Chapel Hill
2015
Approved:
A Note to the Reader:
This essay constitutes only one significant part of the complete “Digital Persuasion”project.
Before continuing any further, I strongly recommend that you point your web browser to
http://ellakoeze.com/persuasion, where you will find the digital portion of “Digital Persuasion.”
Many of the figures referenced in this essay are only poor renderings of the live versions that can
be found online. For the fullest experience, therefore, take some time to orient yourself on the
site before you continue so that you can refer to the appropriate webpages.
Now that you have the online portion of “Digital Persuasion” in front of you, please read
Introduction
Digital methods and tools have become increasingly important to literary and humanistic
research. In fact, some technological advances, such as word processors, are practically
unavoidable. However, along with the increased possibilities of new methods and tools for
scholars, understandable tensions have developed around the relationships between literary
studies and technology. Automated processes and the quantitative nature of computing seem to
strip academics of their agency and control over the interpretation of texts. Stanley Fish, in his
essay “Mind Your P’s and B’s: The Digital Humanities and Interpretation,” summarizes this
negative view of technology in literary studies: “first you run the numbers, and then you see if
they prompt an interpretive hypothesis. The method, if it can be called that, is dictated by the
capability of the tool.” Fish is disdainful of “running the numbers” as a substitute for formal
literary interpretation. Digital humanists, he believes, “are asserting, without justification, a
correlation between a formal feature the computer program just happened to uncover and a
significance that has simply been declared, not argued for. (Frequency is not an argument)”
(Fish). Scholars of literature such as Fish see an increasingly digital future as one where the
natural flexibility and subtlety of human intellect will be at odds with the soulless determinism of
computer programs. Tanya Clement addresses this imagined conflict in the very beginning of her
essay, “Text Analysis, Data Mining, and Visualizations in Literary Scholarship,” when she
writes that “a rumor prevails that literary scholars should and do neglect using digital
applications that aid interpretation because most of these tools seems too objective or
deterministic.” Computers appear to remove the need for interpretation on the part of the scholar
and replace it with quantification, algorithms, and simplification—characteristics that, to many
gone when one need only assemble the necessary inputs and ask the computer to churn out the
results? Will scholarly interpretation and close reading disappear, to be replaced with
computational analysis?
Many digital humanists are eager to quell these fears in their own research by
emphasizing the role of human interpretation in their processes. Julia Flanders demonstrates her
desire to re-humanize digital methods in her essay, “The Literary, the Humanistic, the Digital:
Toward a Research Agenda for Digital Literary Studies,” when she writes that “the analytic
power we gain from algorithmic processes on the one hand and from carefully modeled data on
the other, arises from the ways in which those algorithms and models represent (more or less
successfully) a strong understanding of the text under examination.” Tanya Clement makes a
similar observation in her work with data mining, explaining that in her projects, “the metadata
represents rigorous close reading practices and analysis, subjective practices that dictate in what
way the machine learning must be tweaked” (Clement). For these scholars, it is important to
point out that creating models with literary data requires the same close reading and interpretive
behaviors as traditional scholarship. And if the interpretive work is the same, with simply more
computing power thrown in, then it must follow that the products of digital humanities research
are equally insightful and valid as those of traditional scholarship.
The impulse to emphasize the human role in digital studies of literature, however, has the
side effect of representing the digital humanities as simply “a technologically ramped up version
of what literary criticism has always been” (Fish). While acknowledging that the human role in
digital scholarship is important to explore and define, many digital humanists reject the framing
of their work as only an extension of previous scholarly patterns. In his essay, “The Digital
outsiders, the digital humanities qua humanities remains interesting but irrelevant . . . a means
but not an end.” Alvarado is concerned that digital humanists have not “successfully
demonstrated to the wider community of humanists that there are essential and irreplaceable
gains to be had by the application of digital tools to the project of interpreting (and
reinterpreting) the human record for the edification of society” (Alvarado). Johanna Drucker
also articulates this ambivalence about the value of the digital humanities when she writes that
“after several decades of digital work, the question remains whether humanists are actually doing
anything different or just extending the activities that have always been their core concerns”
(Drucker, “Humanistic Theory”). The question alluded to by Drucker therefore remains: does
digital humanities research offer anything new?
Despite the fact that digital humanities have become a recognized force in contemporary
academic studies, the potential of this force for transforming the nature of literary studies has yet
to be determined. Scholars like Kathleen Fitzpatrick express excitement for “the difference that
the digital can make to the kinds of work that we do as well as to the ways that we communicate
with one another” without necessarily articulating what that difference will be (Fitzpatrick).
Alvarado insists that digital humanists must be deeply interested in the reimagining and
reworking of knowledge.He sees digital humanists sharing “a common element of play, of
productively mapping and remapping the objects and categories of scholarship onto the rapidly
changing, intrinsically plastic but structurally constraining media of digital technology”
(Alvarado). Alvarado even goes so far as to say that “without this play—to the extent that the
scholar has a standoffish, do-this-for-me attitude toward the medium—then, no, she is not a
concerned with the interpretation of a text, but with the new, emergent ways that interpretations
are produced and represented.
So where does this project, “Digital Persuasion,” fit in? My initial goal was to simply see
what was possible, using Jane Austen’s Persuasion as a test case for mapping and visualizing a
novel. I wanted to discover what would happen if I applied digital methods to a close analysis of
a single text. As I progressed, however, I found myself constantly faced with unforeseen
questions of the human role in textual interpretation and analysis, despite my use of digital tools.
And when I finally created my visualizations, I was further faced with the question of the value
of my work. I had seen what I could accomplish, but had I discovered anything new or
transformative? “Digital Persuasion” is thus an attempt to enter the conversation on these topics,
using experiences in visualizing Persuasion as evidence for my positions.
Mapping a Novel: First Attempt
Narratives occur in space. Even when writers reject geographical realities or appear to
pass over them, there are nevertheless implicit spatial dimensions to any story. Nor are the
spaces that narratives inhabit just static backgrounds for plots and characters; they are, in fact,
important areas of literary study in their own right. Literary geographies, whether real or
fictional, shape and influence the narratives they contain. As Franco Moretti writes in the
opening of his book, Atlas of a European Novel, “geography is not an inert container, [it] is not a
box where cultural history ‘happens,’ but an active force, that pervades the literary field and
shapes its depth” (3). Thus, to understand any work of literature, space and geography cannot be
So, if we are to study the geography of a literary work, then the question changes from
“why map?” to “how best to map?” Maps are often thought of as a means of conveying
information, rather than examining it. A street map, for example, will tell you how to find what
you’re looking for or how to get where you’re going. To think about maps this way, however, is
to underestimate their power. First, the visual nature of maps itself enables insight. Even simple
visual representations can reveal patterns that were previously obscured. Furthermore, the
mapmaker must make decisions about what will be displayed on the map and how it will be
displayed, creating a decision-driven construction rather than an objective representation. Every
map “represent[s] (more or less successfully) a strong understanding of the [subject] under
examination” (Flanders). Scholars may run into dangerous territory if this distinction and their
decision-making process are not made explicit, but the choices the mapmaker must make provide
fertile ground for interpretive possibilities.
Geographic Information Systems (GIS), a catchall term for digital mapping methods that
store information as well as display it, have already been utilized in the humanities. William
Kretzschmar, in his essay “GIS for Language and Literary Study,” gives the example of an
interactive online exhibit about the Salem Witchcraft Trials, which uses a map of Salem at the
time of the trials to allow users to navigate curated information about the trial. When a user
clicks on a point on the map that represents the home of a historical figure, the user travels to a
webpage with more detailed information about that person (Kretzschmar). This kind of curatorial
application of GIS in the humanities is increasingly common, but its use is limited. Despite the
wealth of information that can be stored in digital archives and online museums with maps, these
representations only minimally interpret information. One can draw one’s own conclusions by
rather than processing information to generate new insights. Another example of these kind of
“representational maps” are the “Maps of the Novels” that can be found on the Jane Austen
Society of North America’s (JASNA) website (see fig. 1). These maps show all the locations in
Austen’s novels. They are interesting to look at, and helpful if one wants to ask basic questions
about locations in the work, but they do not process or analyze detailed information at those
locations.
Fig. 1. Map of locations in Persuasion. Source: Wilson, Patrick. "Persuasion." Where’s Where in Jane Austen’s Novels...and What Happens There. N.p.: Jane Austen Society of Australia, 2002. N. pag. Jane Austen Society of North America. Web. 11 Feb. 2015.
Franco Moretti’s maps in Atlas of a European Novel, on the other hand, use the tools of
GIS to map many novels at once. His goals in mapping literature are analytical rather than
curatorial, and his resulting maps visualize information not on a simple “one-to-one” basis, but
one does not see every location from a novel, but rather trends and patterns across novels. As
complexity and analysis increase, the types of conclusions one can draw grow in significance.
Thus, though Moretti’s maps are static rather than interactive, they mark a break from simple
representation. In using maps to process rather than simply display data, Moretti is able to draw
inferences about the cultural milieu in a particular era of literary history.
In setting out on this project, I decided that I wanted to explore such “processing”
applications of literary GIS and use them to closely analyze an individual work. Moretti
enhanced the processing ability of his maps by increasing the quantity of literature each map was
analyzing. Subsequently, he was able to draw over-arching conclusions about time periods when
novels were written, but he did not attempt to interpret individual works. While I wanted to
move beyond simple representational maps, I did not want to leave the individual text behind.
Combining the analytical power of GIS with the interactive and accessibility capabilities of
online web mapping applications, I wanted to see if I could use maps to effectively interpret
Persuasion—not simply represent it.
As a test case for spatial analysis, Jane Austen’s works are almost ideal subjects, not least
because Austen was remarkably precise in her geographic details. Even the fictional locations in
her novels can often be placed on a map because she meticulously provides necessary geographic
references. In Persuasion, for example, we know that Uppercross is seventeen miles from Lyme
and three miles from Kellynch, which is fifty miles from Bath. It is not a stretch of the
imagination to think that Jane Austen might have had a map beside her as she was writing. If not,
she certainly had an incredible capacity for remembering geographic details. It is therefore no
wonder that Franco Moretti uses Jane Austen as the first example in Atlas of a European Novel
Austen was also precise in her layout of urban areas, and in most cases, the details in her
novels are based on her own personal knowledge of places such as London and Bath. More
important, however, the geographic details Austen choses to include have been demonstrated to
be thematically significant in the novels. Janine Barchas, in her book Matters of Fact in Jane
Austen, makes a compelling argument that Austen’s geographic precision in Northanger Abbey
was deliberate and purposeful. Barchas uses evidence from the historical layout of Bath to show
that Austen knew exactly what she was doing when she included certain Bath locations in her
narrative1 (Barchas). Likewise, Laura Mooneyham White, in her essay on Austen’s use of
geography in Persuasion, also argues that place is centrally important to Austen’s work, even
describing Austen as a “cultural geographer.” For White, “social and physical space
in Persuasion . . . [are] calibrated and denoted to a precise and minute scale” and “offer a view of
a consciousness—Anne Elliot’s . . . acutely in touch with her placement in relation to others,
both literally and metaphorically” (White).
Despite all of Austen’s helpful geographic details, however, when I began visualizing
Persuasion, the enormity of what I had set myself to do became apparent. The first challenge
was the dearth of useful data. Most digital applications require datasets, or collections of
information broken into useful separate parts. Some digital humanities work, such as text mining,
uses automated algorithms to “mine” text for data by identifying individual words or phrases.
For most other applications, however, someone must assemble a dataset by hand from a given
text before a digital tool can be applied to it. It did not take me long to realize that there were no
1 Barchas argues that Austen uses geographic clues to allude to the well-‐known and wealthy Allen family of Bath and
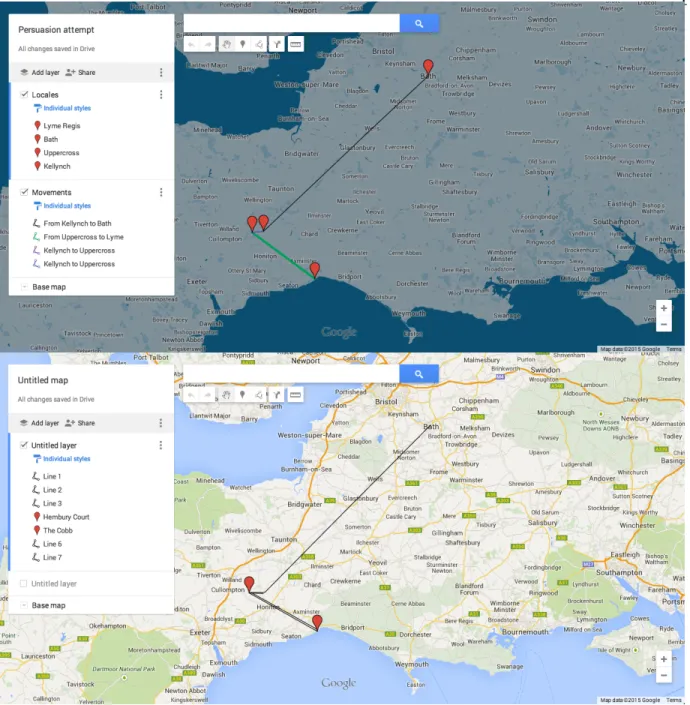
Fig. 2. My first attempts at mapping Persuasion using Google Maps Engine.
Persuasion-specific geospatial datasets already assembled. Without data that could be processed
by a GIS, I had nothing to visualize and nothing to interpret.
Rather than turn to automated data creation, which I worried would be too imprecise, I
started with the simplest solution. Many web-mapping applications allow one to place markers
on a map rather than importing datasets with associated longitude and latitude coordinates. One
Google Maps imagery. In my first attempts, I placed markers for each location in Persuasion and
used lines to represent characters moving between them (see fig. 2). Using Google Maps Engine,
however, proved to be tedious and frustrating. It is fairly evident from looking at figure 2 that
using this method to present information with any depth would be a challenge. Placing individual
lines and points precisely was mind-numbing and difficult. The most frustrating limitation,
however, was that in building this way I could not break out of the realm of the simple,
representational map. Without creating a much more complicated dataset outside of Google
Maps Engine, each point or line could represent only one thing. Each element could be clicked
on to reveal more details in a pop up window, but I could not use these maps to process
information in a way that would generate new insights or highlight previously unforeseen trends.
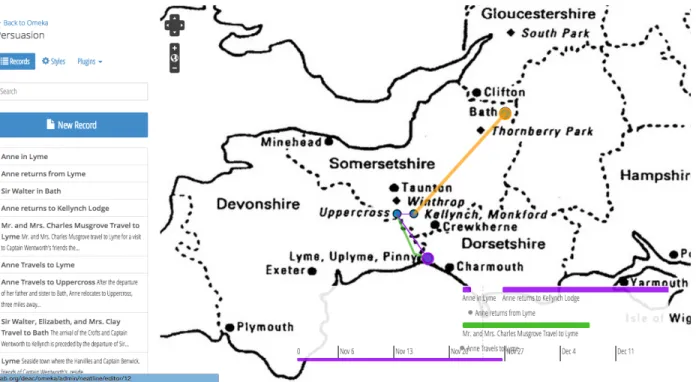
I next turned to Omeka’s Neatline visualizer, hoping that it would allow me to move
Fig 3. My attempts to map Persuasion using Neatline.
beyond simple representation into data processing and analysis. Unlike Google Maps Engine,
tool’s website, they make the case that Neatline is “more-than-usually sensitive to ambiguity and
nuance.” Designed to incorporate archival materials and historical maps, Neatline did allow me
to use JASNA’s map of Persuasion as my base map, precluding the need for me to find latitude
and longitude references for each location (see fig. 3).Neatline also has a built in timeline linked
to its map display that allows one to easily represent the temporal aspects of narratives. The
events on the timeline are connected to the points on the map, so as you scroll through the
timeline, the events will appear on the map in chronological order. This feature was appealing to
me because it allowed me to show that, as characters moved, such as during Anne’s journey from
Kellynch to Uppercross to Lyme to Bath, their journey occurred through space and over time.
Despite these benefits, however, I ran up against the same problem I had before: Neatline
could only help me represent the novel, not interpret it. This particular digital mapping tool was
built to curate materials—not to process data. The more I used it, the more I realized its
limitations: each record is entered separately and requires individual styling, the editing tools are
clumsy and lack precision, and the interfaces were frustrating. And despite the promise of the
timeline tool, it didn’t make up for the lack of spatial analytic power.
Next, in my search for a tool that would help me move from simple representation into
the realm of data processing, I turned to CartoDB. CartoDB is an online GIS application that
employs a dual interface for editing: in one window one can import or create data tables and in
another edit the style and location in a map view. It also has some tools for analysis that can
display data by category or quantity, including a simple time-lapse function to show certain
kinds of data over time. CartoDB combined the ease of editing on a map, like Google Maps
knew that using CartoDB would require me to pre-assemble some data, but I had come to realize
that collecting and curating my own data was going to be a necessary part of my project.
Now that I had found the tool I wanted to use, I was confronted by a second, though still
basic, consideration: what to map? In my initial attempts, I had tried to visualize the entire novel,
which I knew would be overwhelming in terms of data collection. Further, my first maps had
seemed cramped and overly busy, making it difficult to move beyond the problem of
representing the data clearly, before I could even begin to analyze it. I therefore decided to limit
my scope, and so I turned my attention to the city of Bath, which is the setting of the second half
of Persuasion. I hoped that on a smaller scale, my data would be manageable, and patterns
would be easier to see.
I began assembling data, which required a slow and detailed re-reading of Persuasion. I
created a dataset of every location mentioned in Bath and assigned various attributes to them
such as whether they were public or private, or had upper class or lower class associations using
historical information from Maggie Lane’s Jane Austen’s England as a reference. Then, in order
to place each location on a map with real-world coordinates, I used a map from John Feltham’s A
Guide to all the Watering and Sea-bathing Places, For 1813 (see fig. 4). It shows Bath as it
would have been in Austen’s day, just a few years before the action in Persuasion, which is set
Fig 4. “The City of Bath” Source:Feltham, John. Guide to All the Watering and Sea-bathing Places: With a Description of the Lakes, a Sketch of a Tour in Wales, and Various Itineraries, Illustrated with Maps and
Views. London: Printed for Longman, Hurst, Rees, Orme, and Brown. 1815. Google Books. Google Books. Web. 11 Oct. 2014.
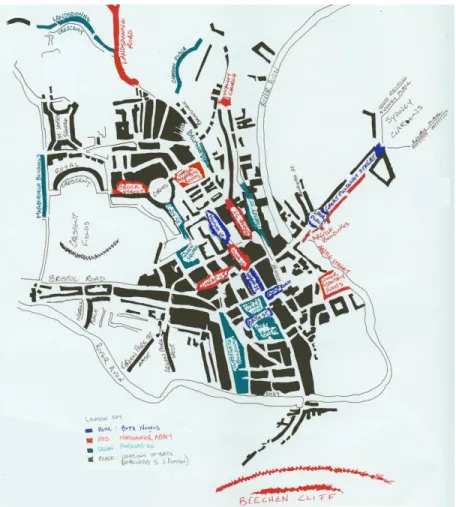
I also used a hand drawn map posted online by a member of JASNA that shows all the locations
in Bath that are mentioned in the two novels Austen set there, Persuasion and Northanger Abbey
(see fig. 5). Taken together, I was able to easily place each location on a base map in CartoDB.
I then decided to trace Anne’s movements through these locations to see what patterns
might be revealed. I had a general idea that it might be interesting to compare Anne’s
movements to those of other characters, such as Sir Walter or Elizabeth. Once again, I re-read
Persuasion, this time scanning for every instance that mentioned Anne being in a particular
location. The first time I did this, I assigned each location in my previous table a number based
on how many times Anne had been there. As I was sifting the text and recording Anne’s
get to Bath. Maybe it would be interesting, I thought, to see the kinds of places at which Anne
and Captain Wentworth negotiate their romance as they meet around Bath. I went back to the
novel and began tracking the appearances of Captain Wentworth. As I built a dataset for the
Fig. 5. Map of Bath. Source: Ezra, Nadine. Map of Bath. Digital image. Where's Where in Jane Austen's Novels. Jane Austen Society of North America, n.d. Web. 11 Sept. 2014.
meetings of Captain Wentworth and Anne, and compared it to my earlier list of locations visited
by Anne in the novel, a pattern began to appear. My map clearly showed that of all the places
that Anne visits, she almost exclusively meets with Captain Wentworth in public spaces (see fig.
Fig. 6. Screenshot of online map of Anne and Captain Wentworth interactions in Bath. Please visit http://ellakoeze.com/persuasion/bath-map/ to see the live version before continuing.
Clearly, the map in fig. 6 establishes that Anne and Captain Wentworth, when in Bath,
almost exclusively meet in public places. The only exception occurs at the very end of the novel,
when Captain Wentworth comes to an evening party at Camden Place after he and Anne are
engaged. The significance of this pattern for Austen becomes apparent when compared to her
of the public and private locations of Austen’s lovers across her novels. In no other Austen novel
do the hero and heroine fall in love in public places, or even in an urban setting2. In fact, Anne
and Captain Wentworth come to an “understanding” literally in the streets of Bath, fittingly in
Union Street, on their way from the White Hart Inn to Anne’s home in Camden Place. Clearly,
Persuasion marks a shift for Austen, where the landed estate and the homes of English gentry are
no longer the sites where the proper social order is negotiated and established via marriage.
Though Anne still dislikes Bath and “the littlenesses of a town,” it is nevertheless the place
where her dreams of happiness come true (Austen 99). Significantly, Anne is marrying a sailor,
not a member of landed gentry with property of his own. Even after she marries, her life will
remain connected to urban port cities, not country estates.
The significance of this shift in Persuasion from the primacy of private homes and estates
to public, urban spaces is articulated in Alistair Duckworth’s book on the estate in Jane Austen’s
works, The Improvement of the Estate. In his section on Persuasion, appropriately titled,
“Persuasion: The Estate Abandoned,” he writes that “the dissociation of the heroine from her
estate is, finally, the most significant of Persuasion’s departures from the norms of Jane Austen’s
previous fiction.” Duckworth goes on to describe the difficulties Anne and Captain Wentworth
face in their courtship:
The crucial question of the second volume—“How was the truth to reach him?” (191)—might be the question asked of other Austen protagonists, but, whereas
2 Much of Northanger Abbey takes place in Bath, but it is not until Catherine arrives at Northanger Abbey itself, that Henry
with Elizabeth, Emma, or Edmund Bertram ‘truth’ arrive rationally, either through retrospective analysis or sudden realization, here ‘truth’ is conveyed by means outside of reason, or indeed of language, the prime rational system.
Moreover, society, the arena of most previous éclaircissements, becomes in
Persuasion a bar to the truth being conveyed as crowded drawing rooms and public streets frustrate rather than permit communication. (204)
As my map shows, Anne and Captain Wentworth have moved their romance into the public
arena. But as Duckworth points out, this shift only makes their eventual engagement more
difficult to attain. The helpful social order of the earlier novels is broken down.
Evidently, by mapping a section of Persuasion, I gained some insight into the novel and
was able to construct an argument about Austen’s shifting values in Persuasion. How much of
that insight, then, came from human interpretation and how much was determined by
technological intervention? CartoDB certainly played a crucial role in my analysis of the second
half of Persuasion—not only in terms of my results, but also by guiding my choices along the
way. As I mapped, the process of working with CartoDB caused me to notice patterns that
subsequently guided me down a particular interpretive path. When collecting data, I was not
actively working towards the map in fig. 6 or any other final result as the goal of my mapping
efforts. Ultimately, it was not I, but rather CartoDB that actually processed and, in a sense,
interpreted the data I had assembled. My final conclusions were only drawn after CartoDB had
identified the pattern for me. Is this not a case then, one might argue, of a computer replacing a
scholar, as Stanley Fish would say, of “running the numbers” and seeing what resulted? Were
my insights and interpretation of Persuasion usurped by the churning of CartoDB’s algorithms?
My process, however, was not as simple as directly translating the text of the novel into
points on the map and then reading the results. As I have discovered in my work, the process of
data creation actually consists of a series of careful textual interpretations. Though this map
interpretive assumptions—not a direct translation of part of the novel to a visual medium. As
William Kretzschmar writes in his essay on GIS applications in the humanities, “the making of
any model is a deliberate act of the maker, in part a reflection of the maker’s theoretical
foundations and assumptions about what is represented” (Kretzschmar). While I certainly did
cede some of my interpretive control to a software application, even on a simple map like this, I
had to develop many interpretations and make assumptions in its creation. I find that I agree
wholeheartedly with Clement when she writes that her “metadata represents rigorous close
reading practices and analysis” and with Flanders’s assessment that successful digital models
must reflect “a strong understanding of the text under examination” on the part of the scholar
(Clement; Flanders).
In my case, I was required to make careful choices about what each point on the map in
fig. 6 represented. Each colored point represents a place Anne has visited, not each time she has
been there. It does not describe a narrative of Anne’s travels; it is rather a summation of all her
movements. I knew that the map as it is gives an unrepresentative view of Anne’s movements in
Bath by, for example, showing her spending equal time shopping in Milsom Street as in her own
home. However, I realized that I could never create a truly accurate representation of Anne’s
mobility. For all the times that Austen explicitly mentions Anne being somewhere, there are
numerous occasions where she is simply “out” with Lady Russell or “walking” through town,
doing errands. I could hypothesize where she would likely be in these instances, but that would
certainly be too great of an interpretive leap. And what then to do about representing her home in
Camden Place, where she presumably spends all the time she is not “out”? Simply representing
I also thought carefully about Anne’s interactions with Captain Wentworth—for
example, the question of whether or not to include the scene on Belmont Street, when Admiral
Croft discusses with Anne a letter he has had from Captain Wentworth. It is not an instance when
Anne and Captain Wentworth actually meet, and therefore might seem not relevant to this map,
even if it fits the general pattern. However, based on my reading, I felt that there were several
arguments for including it. This interview with Admiral Croft and the letter sent from Captain
Wentworth to Admiral Croft function as a preface to Captain Wentworth’s arrival in Bath.
Further, Admiral Croft almost serves as a proxy for Captain Wentworth, letting Anne know that
Captain Wentworth is not going to marry Louisa Musgrove, which makes Anne ready to
interpret Captain Wentworth’s arrival in Bath correctly as expressing his interest in her. Austen
herself links these two events by introducing Captain Wentworth’s arrival in Bath in the
following manner: “While Admiral Croft was taking this walk with Anne, and expressing his
wish of getting Captain Wentworth to Bath, Captain Wentworth was already on his way thither”
(125). Therefore, I decided to include this conversation on my map as the first instance where
Anne intersects with Captain Wentworth in Bath. Whether that was the correct interpretation is
certainly open to debate. Indeed, editorial commentary is as necessary to a map like this as the
longitude and latitude coordinates. No map tells a complete story without an explanation or
critiques of the mapmaker’s methods. Just as Tanya Clement points to the metadata in her work
as crucial for understanding the relationship between her technologically-aided process and the
texts she analyzes, my map would be incomplete without the explanation provided in this essay3.
By framing the role of human interpretation as necessary in my work, however, I seem to
be following in the same rhetorical steps as previous digital humanists, arguing that the digital
3 An ongoing challenge in digital humanities is the need for the production of “meta” materials that describe and qualify
humanities are only “extending the activities that have always been [humanist’s] core concerns”
and not transforming the study of literature in any significant way (Drucker, “Humanistic
Theory”). Questions remain: does my map represent information that could not have been
gathered in any other way? Was my digital method crucial to the conclusion I arrived at?
Arguably, the answers to these questions are no. If read by the right person looking for private
and public space in Austen, the novel might reveal the same insights, which could as easily be
described in an essay. My method, though made feasible with the application of digital tools,
arrived at destinations similar to those that might have been found through traditional
scholarship. In this instance, mapping provided a helpful way to verify a hypothesis, but hardly a
transformative look at Persuasion. This type of work does seem to fall into the “supporting role”
that many scholars cast for digital humanities.
Nevertheless, I still believe this map provides new perspectives for literary analysis.
While my imaginary scholar of space in Austen and I may come to similar conclusions, the
digital tools I utilized created a unique exploratory space for literary interpretation. As I
described earlier, I had no pre-determined objective when I set out to map Persuasion. My
method, and subsequently my mindset, was iterative and open to possibility. CartoDB not only
visualized patterns I may not have seen on my own, it also created opportunities for me to
generate interpretations and space in which to pursue them. In simply reading Persuasion, I
would not likely have noticed the consistent pattern in Captain Wentworth and Anne’s
interactions in Bath. But as I began assembling Anne’s movements into a dataset that could be
visualized, the pattern and its interpretive possibilities presented themselves to me. And once I
had assembled a variety of datasets about Bath in Persuasion, I was able to repurpose them and
to generate ideas for new versions. This process contains the “common element of play, of
productively mapping and remapping” that Rafael Alvarado describes as integral to research in
the digital humanities (Alvarado). In an essay version of my research, that iterative process
would be nearly impossible, or at least develop very differently.
Leaving the Real World Behind: Attempt Two
In creating my first map, I restricted my attention to the second half of Persuasion. As
most of the action in the last twelve chapters of the novel occurs in Bath, a neatly contained
urban area, it was relatively easy to display all the information I wanted to convey while still
staying in real geographic space. My analysis could be conveyed on one map, with one scale,
and with a fairly simple range of symbols. Though I had moved past the realm of simple
representation into spatial analysis, I was still relying on “real” locations with actual longitude
and latitude coordinates that anchored them on a geographically realistic map.
For my next attempt at visualization, however, I wanted to return to the first half of the
novel, which would be a greater challenge. The action in the first half of Persuasion takes place
on two different scales: first, on the level of characters’ movements between locales, e.g., Sir
Walter and Elizabeth moving from Kellynch to Bath or the Musgroves travelling to Lyme from
Uppercross; and second, on the level of characters’ actions within certain locales, e.g., characters
meeting and interacting between the Great House and Uppercross Cottage at Uppercross. I
wanted to show that each locale had different significances in the novel and that those
differences were constructed in part by the characters’ interactions at each place. How could I
convey the broad scope of movement and location in Persuasion, while still representing
dynamic that frustrated my initial attempts to visualize the entire novel. When I attempted to
create a small-scale map (counter-intuitively, “small-scale” refers to a map showing a larger total
land area) of characters’ movements between locations, I felt that I could not display the depth of
my data because I simply couldn’t fit all the information about a given location, such as Lyme,
into one small dot. These limitations were particularly felt when I tried to show interactions
between characters at each location.
I decided it was time to leave “real” geography behind. I had not abandoned the idea of
spatial analysis, but I saw that I would need to show spatial relationships differently. Instead of
thinking about the best way to put Persuasion on a map, I thought instead about how to best
show the information I wanted to analyze. I considered another common method for visualizing
relationships: a network. Networks consist of edges, usually represented by lines, that connect
nodes, which are usually represented by dots. I thought that if I created networks that visualized
relationships between characters, and created a different network for each location, it might show
something interesting about the dynamics between characters in different places in the novel. I
decided to look at conversations between characters as a proxy for character relationships
because, in order for conversations to occur between characters, those characters would
necessarily have to be in the same location (at least they would have been in the 19th century). In
a network of conversations, then, the connections that would be displayed between characters
would also represent moments of physical proximity.
To create my network graph, I decided to use Google Fusion Tables, an experimental
online tool from Google Labs that allows datasets to be easily visualized in a variety of ways,
one of which is an interactive network. The Google Fusion Tables version of a network can give
also allows researchers to dynamically alter a visualization based on variables in the dataset. In
my case, the nodes would represent characters and the edges would represent conversations
between them. If each conversation was assigned a location, I would also be able to filter the
visualization by that location, allowing me to see all the characters and conversations that
occurred in that place over the course of the first half of the novel. I would not see the
conversations in sequence, as the visualization would show me every conversation that occurred
at each location. However, since Anne moves from Kellynch to Uppercross to Lyme in a neat
chronological order, sorting by location would also give me a rough way to sort chronologically.
In using conversation networks as a means of examining literary works, I was following
the path of previous scholars. In “Network Theory, Plot Analysis,” Franco Moretti discusses his
attempts to examine Shakespeare’s Hamlet by creating a network of conversations. He begins by
asking, “What about plot—how can that be quantified?” and suggests that networks are the
beginning of the answer (Moretti). In a similar study done by Elson, Dames, and McKeown at
Columbia University, researchers used an algorithm to create “social networks” from sixty
nineteenth century novels in order to compare the social structures represented by the works.
Neither of these networking attempts, however, used a standard methodology. Moretti created a
connection between two characters if they addressed each other; he also describes a different
study, also of Hamlet, that connected two characters if they merely stood on stage together.
Elson, Dames, and McKeown defined conversations between characters as sections of narrative
when two characters were in the same location, took turns speaking, and were aware of each
other and spoke intending for the other to listen. These decisions represent different
interpretations of what constitutes a relationship between characters on the part of different
I used neither Moretti’s nor Elson, Dames, and McKeown’s methodologies, but rather
developed my own, partially due to my choice of tool. The features of Google Fusion Tables that
I listed earlier provided potential solutions to problems that Moretti identified in his work on
Hamlet, such as not being able to “weight” edges or give them direction (3). However, like any
tool, Fusion Tables comes with restrictions and limitations. Fusion Tables does not allow
two-way connections; in other words, when connecting one column in a data table to another, if any
items in the second column already appeared in the first column, their connections will not show
up in the network. Therefore, I developed my own conversation criteria. Each character in the
first half of the novel has two nodes: a “from” or “speaker” node and a “to” or “addressee” node.
I created a connection between a “speaker” and an “addressee” each time one of the following
criteria was met: a character addressed another character without being first addressed by the
other character; a person entered a conversation without first being addressed; a character
addressed someone who was not previously addressed. The speaker was designated as, naturally,
the person speaking, and the addressee as either the other character explicitly addressed, or if the
speaker was not talking to anyone in particular, the addressees were the other people already
engaged in the conversation. My network therefore is slightly unorthodox, because each edge
represents not simply a conversation between characters, but rather an instance of speaking, an
initiation of a conversation.
Austen’s writing style also presented challenges for me in my efforts to translate
conversations into data. Fragments of dialogue float through passages of Persuasion as though
uttered by consensus, and opinions are attributed to characters as though they are utterances. In
many cases, I simply could not make a place in my data for such vague communication. In other
narrator explicitly tells me that Lady Russell spoke to Anne, I chose to believe her even if I
didn’t personally hear the words myself.4 My resulting network graph, then, is the product of
both my ongoing struggle to knit together Austen’s words with the structure inherent in Google
Fusion Tables (see fig. 7).
Nevertheless, I believe that the resulting network provides useful insights into the
underlying patterns governing characters’ interactions in the novel. One pattern is
immediately apparent. Anne is spoken to much more often than she initiates conversation. In
fact, she is the most spoken to person in the novel, connecting to nearly every other
character, much like the character of Hamlet in Moretti’s analysis (Moretti 4). Her position in
the Uppercross family, seemingly so peripheral on the page, is actually integral, it seems, to
the social dynamics of the novel.
On its own, however, this visualization does not convey as much subtlety or insight as
one might hope. It is too crowded, too overlapped. Online, one can hover and click on nodes
to see what they are, and move the positions of the nodes around for a clearer picture, but it
doesn’t get much better than the image above. However, this network is only the beginning
of what Fusion Tables will allow. As I described earlier, Fusion Tables allows one to apply
filters to a network. The first half of Persuasion occurs in three locations—Kellynch,
Uppercross, and Lyme—that Anne moves through in a sequential order, in each case moving
further from her familial home, Kellynch Hall. I assigned each instance of conversation to
one of the three locations, depending on the location of Anne’s residence when the
conversation took place. I then filtered the network three times—once by each location. I
Fig. 7. Screenshot of my conversation network of the first half of Persuasion. Please visit http://ellakoeze.com/persuasion/conversation-network/ to see the live version before continuing.
wanted to see if Anne’s conversational relationships would change depending on her location
(see figs. 8-10).
Figures 8-10 reveal that Anne’s importance increases the further she gets from
Kellynch. At Kellynch, Anne is relatively peripheral to the prevailing concerns about Sir
Walter’s liquidity and future plans. In Uppercross, she is talked to much more, but the vast
majority of those conversations are the result of Anne “being treated with too much
confidence by all parties, and being too much in the secret of the complaints of each house”
(Austen 32). By the time we get to Lyme, however, an interesting dynamic has been created.
Fig. 8. Screenshot of conversation network in Kellynch. Please visit
http://ellakoeze.com/persuasion/conversation-network/ to see the live version before continuing.
Fig. 9. Screenshot of conversation network in Uppercross. Please visit
http://ellakoeze.com/persuasion/conversation-network/ to see the live version before continuing.
though in most cases they do not address each other, the social dynamics have nevertheless
organized themselves around these two characters, like spokes on a wheel. The story has
shifted subtly to create a balance between Anne and Captain Wentworth—a balance that was
formerly lacking while Anne was merely witness to the Miss Musgroves’ slavish attentions
to Captain Wentworth: they “seemed hardly to have any eyes but for him” (Austen 46). For
the first time, we can see that Captain Wentworth addresses Anne more than he addresses
any other character.
The events at Lyme are often pointed to as the turning point for Anne and Captain
Wentworth’s relationship. As Alistair Duckworth writes, “[Captain Wentworth’s] journey of
education is from a mistaken approval of Louisa’s false fortitude to a recognition of Anne’s
true fortitude . . . Wentworth, effectively, has made this journey by the end of the first
volume” (199). Two separate moments are seen to contribute to this realization. The first
occurs when Captain Wentworth witnesses Mr. Elliot’s admiration of Anne: “It was evident
that the gentleman . . . admired her exceedingly. Captain Wentworth looked round at her
instantly . . . which seemed to say, ‘That man is struck with you, and even I, at this moment,
see something like Anne Elliot again’” (Austen 76). The other contributing moment is the
aftermath of Louisa’s fall from the Cobb; in the crisis, Anne’s resiliency and Louisa’s
foolishness are equally on display. However, while this summary is certainly a valid
explanation of the events at Lyme, the network graph shows that Anne’s character takes on
significance in Lyme beyond simply the crisis moment on the Cobb or Mr. Elliot’s admiring
glance. Anne’s “fortitude” after Louisa’s fall is captured in the graph in the small cluster that
represents her giving orders to Captain Benwick and Captain Wentworth. But even excluding
Anne may seem to still be regarded as peripheral, the graph reveals that Anne’s social
position in Lyme has shifted into a central role. Not only does Captain Wentworth show her
more attention, but Captain Harville and Captain Benwick also affirm her value and
importance by speaking to her. One can imagine that Captain Wentworth would have noticed
the respect shown to Anne by his friends.
Clearly, with the help of filtering by location, my conversation network is effective in
revealing overarching patterns in the novel. However, I wanted to see if filters could enhance
the complexity of the network by allowing me to integrate more textual evidence into it. I
wanted to show not just which characters were having conversations, but also what qualities
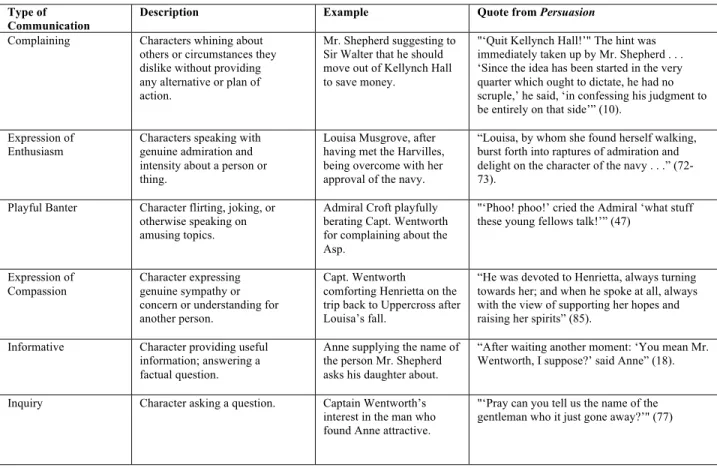
those conversations possessed. To incorporate such information into my dataset, I decided to
code each conversation as one of eleven “types of communication” (see table 1).
Table 1. “Type of communication” labels assigned to conversations with descriptions and supporting examples.
Type of Communication
Description Example Quote from Persuasion
Complaining Characters whining about others or circumstances they dislike without providing any alternative or plan of action.
Mr. Shepherd suggesting to Sir Walter that he should move out of Kellynch Hall to save money.
"‘Quit Kellynch Hall!’" The hint was immediately taken up by Mr. Shepherd . . . ‘Since the idea has been started in the very quarter which ought to dictate, he had no scruple,’ he said, ‘in confessing his judgment to be entirely on that side’” (10).
Expression of Enthusiasm
Characters speaking with genuine admiration and intensity about a person or thing.
Louisa Musgrove, after having met the Harvilles, being overcome with her approval of the navy.
“Louisa, by whom she found herself walking, burst forth into raptures of admiration and delight on the character of the navy . . .” (72-73).
Playful Banter Character flirting, joking, or otherwise speaking on amusing topics.
Admiral Croft playfully berating Capt. Wentworth for complaining about the Asp.
"‘Phoo! phoo!’ cried the Admiral ‘what stuff these young fellows talk!’” (47)
Expression of Compassion
Character expressing genuine sympathy or concern or understanding for another person.
Capt. Wentworth
comforting Henrietta on the trip back to Uppercross after Louisa’s fall.
“He was devoted to Henrietta, always turning towards her; and when he spoke at all, always with the view of supporting her hopes and raising her spirits” (85).
Informative Character providing useful information; answering a factual question.
Anne supplying the name of the person Mr. Shepherd asks his daughter about.
“After waiting another moment: ‘You mean Mr. Wentworth, I suppose?’ said Anne” (18).
Inquiry Character asking a question. Captain Wentworth’s interest in the man who found Anne attractive.
Type of Communication
Description Example Quote from Persuasion
Expression of
Panic Character exclaiming without premeditation due to distress or extreme circumstances.
Mary panicking after
Louisa's fall. "‘She is dead! She is dead!’" (80)
Polite Talk Character exchanging everyday small talk; making chitchat.
Capt. Wentworth coldly moving away from the piano when Anne gets close.
“. . . he saw her, and instantly rising, said, with studied politeness: ‘I beg your pardon, madam, this is your seat’” (53).
Purposeful Character speaking with intent; commanding others or desiring a certain outcome.
Anne trying to get young Walter Musgrove off her back (who Captain Wentworth subsequently silently removes).
“‘Walter,’ said she, ‘get down this moment...’" (58).
Self-interested Character speaking with the specific purpose of furthering their own position or aims without thought or care for others.
Mary Musgrove not wanting Henrietta Musgrove to go to Winthrop and make up with Charles Hayter.
"‘Bless me! here is Winthrop. I declare I had no idea! Well, now, I think we had better turn back; I am excessively tired’" (62).
Self-pitying Characters speaking to elicit sympathy in others for themselves.
Mary lamenting her mistreatment and illness.
“‘So you are come at last! I began to think I should never see you. I am so ill I can hardly speak. I have not seen a creature the whole morning!’" (27).
These “types of communication” may seem arbitrary at first glance, but they were the
result of an iterative process of interpretation. I first wrote down the beginning of every quote
I was documenting. I then returned and described the context of the conversation, including
the characters’ motivations. I later returned and classified each conversation as a type. I then
returned again and re-evaluated my classifications to see if they could be reduced or clarified.
I was left with the list in table 1. My process is documented in my spreadsheet, as I created a
new column for each subsequent simplification (see fig. 11).
These categories cover the span of conversation types in the first twelve chapters of
Persuasion without too much overlap. Some conversations fall into multiple categories;
unfortunately, due to the restrictions of Fusion Tables, I could only choose one, again forcing
me to make further interpretive decisions. As before, when I created my map of Bath, the
digital tool I used both enabled and limited the interpretive possibilities available to me,
shaped in its creation both by the limitations of Google Fusion Tables as well my own
subjective reading of Persuasion.
We can now filter my network by a certain type of conversation as well as location,
for instance by the “purposeful” type of communication. I chose “purposeful” as the type of
communication to use in this example because it roughly represents authority and control by
identifying conversations in which speakers are trying to accomplish specific outcomes with
their speech. Characters who speak purposefully, I am assuming, are asserting more control
and authority over the action in the novel. If we keep our focus on Anne, using these filters
should allow us to see if she becomes more closely involved with the action of the novel as
she changes location (see figs. 12-14).
Fig. 12. Screenshot of conversation network filtered by “purposeful” conversations that take place in Kellynch. Please visit http://ellakoeze.com/persuasion/conversation-network/ to see the live version before continuing.
Fig. 13. Screenshot of conversation network filtered by “purposeful” conversations that take place in Uppercross. Please visit http://ellakoeze.com/persuasion/conversation-network/ to see the live version before continuing.
These three networks visualize authority and activity moving between characters at each
location. In Kellynch, Mr. Shepherd is the prime motivator for Sir Walter’s move to Bath. In
Uppercross, Louisa takes on an active role in her sister’s romance. And in Lyme, Anne and
Captain Wentworth deal with the crisis of Louisa’s fall. Certainly, Anne’s role has changed
dramatically. In Kellynch, she makes a suggestion to her sister that Mrs. Clay might have
dubious intentions regarding Sir Walter. In Uppercross, she speaks purposefully, but
ineffectually to three-year-old Walter Musgrove. In Lyme, however, Anne is the only one
who keeps her head after Louisa’s fall, and she speaks purposefully to Captain Wentworth
and Captain Benwick, both military men who one would normally assume to be accustomed
to issuing orders under pressure. In fact, Anne and Captain Wentworth are the only two
characters who command any authority. The hub and spoke configuration from figure 10 is
still evident and Anne’s position in Lyme as the equal counterpart to Captain Wentworth is
again reflected in the conversational structure of the narrative.
These examples give some insight into how Fusion Tables and network mapping can help
investigate a narrative. But, just as in creating the map of Anne and Captain Wentworth’s
movements in Bath, building such a network graph is not as simple as plugging parts of a text
into a digital tool and seeing what results. As I have described, creating the data behind this
network graph, though much concerned with the practical limitations of Fusion Tables, was also
an act of complex interpretative decision-making on my part. Just as Moretti’s or Elson, Dames,
and McKeown’s methodologies created different kinds of data that resulted in different
visualizations, so my network graph, before I even knew what it would look like, had
accumulated a substantial set of subjective, human-made assumptions. Though Google Fusion
nevertheless “using practices that [were] not inherently empirical but situated—practices that
account for the plausible instead of the truth in literary research” (Clement). My graph is thus not
an exhaustive, empirical network of every conversation in the novel; rather, it is one visual
representation of conversation initiations and interjections. It would look different if each
character were only represented by one node instead of two, or if I had recorded every individual
instance of speaking on the part of every character. Most importantly, it visualizes my reading of
Persuasion, and without my interpretive lens, it could not have been created.
However, though I have just restated my belief in the importance of human interpretation
in the application of digital methods to the study of literature, I must also acknowledge that the
use of technology does indeed profoundly shape the kind of insights that can be made into a
given work. I allowed Google Fusion Tables to eliminate complexity and nuance when it turned
characters into nodes and communications into connections. On one hand, this generalizing can
be helpful, revealing hidden complexities of structure and pattern. As Moretti puts it:
. . . this process of reduction and abstraction makes the model obviously much less than
the original object–just think of this: I am discussing Hamlet, and saying nothing about
Shakespeare’s words–but also, in another sense, much more than it, because a model
allows you to see the underlying structures of a complex object. (“Network Theory, Plot Analysis” 4)
On the other hand, however, there is a danger of losing too much context, ceding too much
control to technology, and therefore losing the ability to make useful interpretive claims. I have
attempted to confront this danger by combining close reading and data-crunching iteratively in
my methods. While many scholars have and will continue to use data mining algorithms that do
not require reading, my approach, because it required close reading, allows me to better
contextualize my results as well as convey more qualitative and subjective analysis in my
it and re-categorize or re-organize it to show information more clearly or to better respond to the
limitations of the tool. My relationship with Google Fusion Tables, therefore, “reflects more
complex, iterative interactions between human- and machine-mediated methods . . . than being a
combination of fixed, clearly defined entities” (Clement). The human-technology relationship in
the digital study of literature is a balancing act, a constant negotiation and interplay between
competing demands.
This is especially true, I believe, when applying digital methods to the close
interpretation of individual texts. In a study using the tool Search Visualizer, Daniel Allington
and Gordon Rugg searched for the names of lead characters in Jane Austen and Arthur Conan
Doyle’s works, and then created simple visualizations showing the frequency with which those
names appeared. The goal was to provide “a purely graphical representation of texts” that would
help with the study of plot structure (Allington and Rugg). The researchers found that “the major
advantage of a tool like Search Visualizer is that it enables texts to be compared at a glance,
permitting the analyst to investigate the content and structure of those texts in an intuitive but
non-evaluative way” (Allington and Rugg). These researchers were practicing “distant reading”
in which they extrapolate interpretations about a text without reading it, instead merely observing
patterns of language within it. I believe, however, that visualizations have the capacity to do
more than allow texts to be “compared at a glance.” I do not believe that close reading and
understanding of texts can be done away with. Like Tanya Clement, I believe research in the
digital humanities requires “a combination of close and distant reading, of subjective and
objective reading” to reach a more complete understanding of any text (Clement). I required both
At this point, I can quote many lines of dialogue from Persuasion, and yet Fusion Tables allowed
me to see things about it I would never have recognized on my own.
Though my work with creating a network of Persuasion has reinforced the importance of
the human-technology relationship in digital humanities, we are still left wondering about the
overall value of digital visualizations in the study of literature. In some ways, visualizations such
as those in figures 7-14 can allow scholars to test familiar hypothesis and support interpretive
work. Such an application of digital methods places the digital humanities, once again, in a
supporting role to traditional scholarship. I believe, however, my network graph also provides an
entirely new framework for exploration and discovery. As I experienced earlier during my forays
into mapping, it would be nearly impossible to recognize some of the patterns presented by
figures 7-14 without seeing them first. The very use of tools like CartoDB and Google Fusion
Tables allows for flexibility and inventiveness that are not available in traditional scholarship.
I further found that the process of using Google Fusion Tables allowed for even greater
exploration and inventive possibilities than working with CartoDB. While creating the map of
Bath, I saw patterns in Persuasion that I might have overlooked before; in developing a flexible
dataset for manipulation in my network graph, I created the potential for connections that I could
not have even imagined beforehand. The flexibility Google Fusion Tables provides as a digital
tool allowed me to venture into unknown territory. Though I knew the assumptions I was making
beforehand in data collection, I could not predict all the patterns that would be revealed by the
visualization. The examples I provided in this essay, furthermore, are only the tip of the iceberg.
There are numerous ways that this visualization can be manipulated and used. One of the reasons
I used Fusion Tables, despite its limitations, is its collaborative nature. Online, anyone can access
example, one might choose to show different combinations of who is spoken to and the type of
communication that is being said. Suddenly, one network graph can become a framework for the
endless realignment of data into new and interesting patterns.
Google Fusion Tables also allows for more generative exploration than CartoDB because,
on the spectrum from simple representational maps to visualizations that process and create
meaning out of data, the conversation network is closer to the latter while my first attempts are
far closer to the former. In terms of complexity and capacity for analytical and procedural work,
my network visualization is a far cry from the representational maps I struggled with initially.
While both types of visualization are useful, and any given research might employ aspects of
both, my experiences demonstrate the clear differences in the kinds of insight they produce.
While maps closer to the representational end of the spectrum can be a helpful extension of
traditional scholarship, transformative methods that generate new knowledge are closer to the
processing end. In the end, the question of whether digital humanities will fill a supporting role
or a lead one in literary research returns us to the choices and methods of each scholar.
Final Thoughts
Both in mapping and in creating a conversation network of Jane Austen’s Persuasion, I
have found, in agreement with scholars such as Tanya Clement and Julia Flanders, among others,
that the human-technology relationship in digital humanities is more complex than a scholar
simply “running the numbers” on a text and reading out the results. Human interpretation of a
text, though applied to data creation rather than formal arguments, is still crucial in the
production of insightful and useful research with digital methods. I have also found that when
thorough understanding of the work being analyzed cannot be neglected. Scholars and the
technology they utilize must exist in a flexible, carefully balanced ecosystem to use digital
methods in the most effective manner.
Despite the importance of the human role in digital humanities research, however, I also
gained an appreciation for the transformative capacity that digital tools offer in the study of
literature. Scholars working with digital tools must operate in a generative mode and maintain
flexibility—what Rafael Alvarado calls “an element of play.” Digital methods will not usurp the
role of human intellect in literary analysis, but they do have the potential to open human intellect
to new ways of seeing texts, to unearth new interpretive paths that may have been overlooked,
and to create new spaces of invention and exploration for literary scholars.
It should not be surprising, then, to learn that the tools available to digital humanists have
a profound impact on the kinds of interpretations and assumptions that scholars can make.
Johanna Drucker sees “such graphical tools [as] a kind of intellectual Trojan horse, a vehicle
through which assumptions about what constitutes information swarm with potent force”
(“Humanities Approaches”). By repurposing pre-existing tools instead of building my own, I was
folding into my work the assumptions and possibilities that had previously been made by the
creators of the software. In the most glaring example, the one-way structure of Google Fusion
Tables led to me creating “to” and “from” nodes in my network graph. There were, however,
countless other small limitations that I encountered, and probably some that escaped my notice.
Digital humanists who employ these methods must, therefore, attempt to be as “literate” in these
tools as possible and to realize their inherent limitations. Scholars must also realize that using an
“off-the-shelf” tool designed for another purpose will have different implications for their work
Thus, if visualizations have the capacity to provide transformative applications of digital
methods in interpreting texts, then effort must be put into not only using existing tools, but also
creating new ones whose built in assumptions are compatible with humanist perspectives. I
vehemently agree with Drucker when she issues her “call to imaginative action and intellectual
engagement with the challenge of rethinking digital tools for visualization on basic principles of
the humanities” (“Humanities Approaches”). Instead of being limited by digital humanities tools
that are designed primarily to create exhibits, such as Neatline, or struggling with tools that were
designed for other fields altogether, digital humanists should have at their fingertips a wide range
of tools that are designed to process and explore data, but in a manner that suits the ambiguity of
literary studies and foregrounds the interpretive assumptions that its users must make.
New tools, made available to a wider range of scholars, however, are not enough.
Believing, as I do, that the digital humanities have the capacity to be transformative for the study
of literature, I contend that digital humanities cannot be ignored by a majority of scholars or
relegated to a small group of enthusiasts. As the digital and the traditional begin to meld, we will
need new kinds of academics—scholars who can both understand datasets and explicate poems.
While collaboration between humanists and those with digital skills is beneficial and might
suffice for the present, true collaboration cannot happen without both sides understanding the
other. The literary scholar of the future might be more interested in visualization or might be
more interested in a strict close reading of a text. But in either case, that scholar will have to be
informed by and understand the research of scholars of different stripes. In short, just as “there
was nothing less for Lady Russell to do,” at the end of Persuasion “than admit she had been