Sharif University of Technology
Scientia IranicaTransactions E: Industrial Engineering http://scientiairanica.sharif.edu
A new nondominated sorting genetic algorithm based
on the regression line for fuzzy trac signal
optimization problem
H. Asadi
a, R. Tavakkoli Moghaddam
b, N. Shahsavari Pour
c, and E. Naja
a; a. Department of Industrial Engineering, Science and Research Branch, Islamic Azad University, Tehran, Iran. b. School of Industrial Engineering, College of Engineering, University of Tehran, Tehran, Iran.c. Department of Industrial Technology and Management, Vali-e-Asr University of Rafsanjan Iran. Received 2 December 2015; received in revised form 20 December 2016; accepted 7 January 2017
KEYWORDS Trac signal systems; Genetic algorithm; Vehicle and pedestrian delays;
ANOVA.
Abstract. Trac jam is a daily problem in nearly all major cities in the world and continues to increase with population and economic growth of urban areas. Trac lights, as one of the key components at intersections, play an important role in control of trac ow. Hence, study and research on phase synchronization and time optimization of the trac lights could be an important step to avoid creating congestion and rejection queues in a urban network. Here, we describe the application of NSGA-II, a multi-objective evolutionary algorithm, to optimize both vehicle and pedestrian delays in an individual intersection. In this paper, we improve NSGA-II algorithm based on the regression line to nd a Pareto-optimal solution or a restrictive set of Pareto-optimal solutions based on our solution approaches to the problem, named PDNSGA (Non-dominated Sorting Genetic Algorithm based on Perpendicular Distance). The high speed of the proposed algorithm and its quick convergence makes it desirable for large scheduling with a large number of phases. It is demonstrated that our proposed algorithm (PDNSGA) gives better outputs than those of MOGA, NSGA-II, and WBGA in trac signal optimization problem, statistically . © 2018 Sharif University of Technology. All rights reserved.
1. Introduction
Trac congestion is a daily problem in nearly all major cities in the world and continues to increase with population and economic growth of urban areas. The increasing trac demand strains the existing transportation system, especially when the network is oversaturated during peak hours. Oversaturation occurs when the queues of vehicles on a receiving street interfere with the performance of the respective adjacent upstream streets, and though these conditions
*. Corresponding author.
E-mail address: [email protected] (E. Naja) doi: 10.24200/sci.2017.4442
may last for only a short time, the time to clear the network may be signicant. Costs of infrastructure renewal and expansion may be cost-prohibitive, and under limited budgets, viable strategies are required to enhance the mobility and eciency of the existing trac without investing in new infrastructure.
There are two objectives for this research. We develop an eective procedure to optimize signal timing of an individual intersection by minimizing both vehicle and pedestrian delays. Trac signals aim generally to minimize average vehicle delay, but pedestrian delay is not taken into account. Such a strategy is reasonable for rural areas or highways where very few pedestrians interfere with vehicular trac. However, in a central business district with a lot of pedestrians walking around, the strategy that only optimizes vehicle ows
would not be suitable, because the pedestrian delay is ignored. Ignoring pedestrian delay might even result in people choosing to use vehicles more frequently than walking. Therefore, when pedestrian ows start to have inuence on vehicle ows, pedestrian signal plans should be optimized considering delays for both groups. Trac signal plan optimization should be a trade-o between vehicle and pedestrian delays by minimizing travel delay for all the travelers.
Ishaque and Noland [1] analyzed the eect of signal cycle timing on both vehicle and pedestrian delays in a hypothesized network by a VISSIM mi-crosimulation model. Aiming to minimize the multi-modal travel delay and travel costs, they found that optimal cycle lengths under light trac conditions (60 to 72 seconds) were shorter than optimal cycle lengths under heavy trac conditions (90 seconds). However, they only discussed eight xed-time non-coordinated signal plans with single or double exclusive pedestrian phases. In addition, pedestrian compliance eect was not considered in the research. Based on their research in 2005, Ishaque and Noland [2] studied trade-os between pedestrian and vehicle tracs in the same hypothetical network by a VISSIM microsimulation model. Aiming to optimize average travel cost per person in all modes of the network, they found that shorter cycle lengths were benecial for pedestrians, and that signal plans advantageous to vehicles might be disadvantageous to pedestrians. Based on dier-ent proportions of pedestrians to vehicle users and dierent pedestrian time values, suitability of three dierent pedestrian phase types was analyzed so that the optimal network performance could be achieved for all road users. Compared with their previous research, pedestrian compliance eect was considered in the research, and a variety of signal plans were improved. However, the variety was still limited to two-phase vehicle signal plans with single exclusive or double exclusive, or staggered pedestrian crossing phase(s). A deterministic model [3,4] was proposed that incorporated both pedestrian and vehicle delays into a signal coordination plan. The author(s) analyzed the running results of the model on a hypothesized ve-intersection arterial with various osets, and found that the best osets for vehicles and pedestrians along the arterial were not necessarily the same. In order to minimize total pedestrian and vehicle user cost, an optimal signal coordination plan could be achieved by balancing between pedestrian and vehicular delays. Li et al. [5] developed a trac signal optimization strategy, programmed in Matlab, for an individual intersection to minimize weighted total vehicle and pedestrian delays. The total vehicle and pedestrian delays on sidewalk were calculated based on their deterministic queuing model, respectively. Total pedes-trian delay on crosswalk was calculated based on an
empirical pedestrian speed model, which considered interactions between pedestrian platoons. Mehan [6] and Barzegar [7] worked on trac signal control for an isolated intersection signal (adjacent intersection) with fuzzy controller methods.
Gokulan and Srinivasan [8] adopted a type-2 fuzzy set and designed a distributed multi-agent trac-responsive signal control system. This system was tested on virtual road networks with several scenar-ios. Results showed the superior performance of the approach in handling unplanned and planned incidents and obstructions.
Recently, metaheuristic algorithms [9] have be-come very popular as optimization methods for solving trac light scheduling problems. A rst attempt corresponds to the study of Rouphail et al. where a Genetic Algorithm (GA) was coupled with the COR-SIM [10] microsimulator for the timing optimization of nine intersections in the city of Chicago (USA). The results, in terms of total queue size, were limited due to the delayed convergence behavior of the GA. Turky et al. [11] used a GA to improve the performance of trac lights and pedestrians crossing control in a unique intersection with a four-way two-lane junction. The algorithm solved the limitations of traditional xed-time control for passing vehicles and pedestrians, and it employed a dynamic control system to monitor two sets of parameters.
Odeh et al. [12] presented a hybrid algorithm that combines Fuzzy Logic Controller (FLC) and Genetic Algorithms (GAs) and its application on a trac signal system. It has been used to adopt the decision rules of FLCs that dene an intelligent trac signal system, obtaining a higher performance compared to that of a classical FLC-based control. The simu-lation results yielded by the hybrid algorithm show an improvement of up to 34% in the performance with respect to a standard trac signal controller. Another signal control methodology is formulated as a quadratic programming problem to minimize and balance the link queues, thus minimizing the risk of queue spillback [13]. Gottlich et al. [14] presented a numerical approach to the optimization of switching points as a function of time based upon the macroscopic trac ow model. The numerical discussion relies on an equivalent reformulation of the original problem as well as a mixed-integer discretization of the ow dynamics. The large-scale optimization problem is solved using derived heuristics within the optimization process. Collotta et al. [15] proposed a novel approach to managing dynamically the trac lights cycles and phases in an isolated intersection. The target of the work is a system that, compared with previous solu-tions, oers improved performance, which is exible and can be implemented on o-the-shelf components. The proposed system combines the advantages of the
WSN, such as easy deployment and maintenance, exibility, low cost, noninvasiveness, and scalability, with the benets of using four parallel fuzzy controllers, i.e. better performance, fault-tolerance, and support for phase-specic management.
Shahsavari Pour et al. [16] presented a new fuzzy multi-objective mathematical model to minimize the length of trac queue and pedestrian delays to opti-mize the control of uctuating trac volumes such as oversaturated or unusual load conditions. The problem is solved by genetic algorithm, and a new defuzzica-tion method is introduced. Duerr [17] used a GA with a microscopic trac simulator as the tness evaluator to minimize the Performance Index (PI) which considered vehicle behavior at intersections and transit stops. The optimization results of a seven-node arterial in Wurzburg (Germany) and temporal deviation of each phase duration from the standard setting at each node showed that travel time dropped 25% and 5% for buses and cars, respectively. Furthermore, so as to optimize signal control under oversaturated trac condition, Girianna and Benekohal [18,19] applied a GA to a grid network of arterials. The optimization results of a hypothesized twenty-node network and green time of each phase at an intersection showed that queues were successfully distributed spatially over dierent intersec-tions and temporarily over dierent signal cycles.
In this paper, we apply a new multi-objective genetic algorithm to nd a Pareto-optimal solution or a restrictive set of Pareto-optimal solutions based on our solution approaches to the problem. In this paper, our purpose is to present a solution methodology to obtain all Pareto-optimal solutions to optimize signal timing and enable the decision-makers to evaluate a greater number of alternative solutions. The purpose of this study is to extend this methodology to reach a solution to multi-objective optimal control problems under the framework of NSGA-II.
This paper is organized as follows. In Section 2, we present the problem denition and formulation. In Section 3, a solution procedure is introduced. We develop an algorithm, namely PDNSGA. To illustrate the proposed approach, a number of examples are presented in Section 4. The related results of this algorithm are analyzed by the analysis of variance (ANOVA) method in Section 5. Finally, conclusion is given in Section 6.
2. Multi-objective mathematical model
Trac signal timing planning is a typical multi-objective optimization problem; for a signalized sys-tem, an optimal timing plan is usually required to meet four typical objectives (minimizing delay, minimizing stops, minimizing fuel consumption, and maximizing progression). The problem discussed in this paper
is minimizing the queue length on each side of an intersection during peak hours with fuzzy entrance and exit rates on each side of the intersection. Generally, trac signals aim to minimize average vehicle delay, but pedestrian delay is not taken into account. Such a strategy is reasonable for rural areas or highways where very few pedestrians interfere with vehicular trac. However, in a central business district with a lot of pedestrians walking around, the strategy that only optimizes vehicle ows would not be suitable because the pedestrian delay is ignored. Ignoring pedestrian delay might even result in people choosing to use vehicles more frequently than walking. Trac signal plan optimization should be a trade-o between vehicle and pedestrian delays by minimizing travel delay for all the travelers. Therefore, when pedestrian ows start to have an inuence on vehicle ows, pedestrian signal plans should be optimized considering delays for both groups.
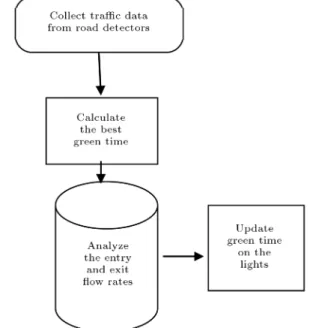
Fuzzy logic is a powerful tool for processing nondeterministic and non-linear problems. It can represent fuzzy and qualitative knowledge; therefore, it can imitate human's reason. As we know, a seasoned trac police can handle trac quickly and eectively. Actually, the reasons and decisions are made merely by the use of interrelated qualitative knowledge. The process of reasoning and decision-making can be described as follows: For a lane, if there are many vehicles arriving in, more green time is allocated. Otherwise, less green time is allocated or the phase turns to the next one. Of cause, it is necessary to simultaneously consider trac demands in other lanes when changing the phase. The control process is shown in Figure 1. The trac intensity can be denoted by
Figure 1. Scheme of trac optimization process using data collected from road detectors.
queue length before stop line or trac density on the approaches in the current or next phase.
Trac signal timing changes at dierent hours of day, and the amount of trac on each street and the intersection is used to help increase the eciency of lights. Although this method has improved the controlling process of intersections, in a very busy intersection and in cities that have particular trac treatment, the control of intersection will face this problems. So, we need to have a system that responds to variations of the trac patterns quickly. This study is made to optimize green time duration in order to minimize trac jam length. Prior to the optimization process, road-detector should gather data related to intersection trac. These data are required to make decisions if current conditions are sucient, or they have to be improved (see Figure 1).
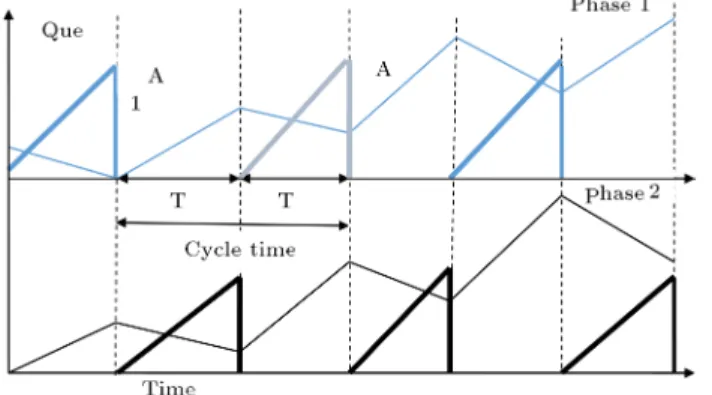
For the sake of clarication, we have conducted a sensitivity analysis on the trac light at a two-phase intersection, and then it has been developed for a four-phase trac problem. When four-phase I has red time (T1), trac jam length in this phase has an increasing rate. On the contrary, trac jam length of phase II with green time has a decreasing rate. Red time (WALK time) in each phase is the sum of green time in other phases which increases as the green time devoted to each phase increases; therefore, jam length in other phases may also increase.
The pedestrian's queue length has an incremental rate and reaches its highest level at the end of green time (points A1, and A2). As soon as intersection's red time starts, all the pedestrians cross the intersection immediately (WALK time). As a result, pedestrians' queue is equal to zero (see Figure 2). In addition, the model considers the compliance eect of pedestrians. In order to avoid waiting for the next WALK inter-val, certain pedestrians increase their waking speed and begin their crossing without a WALK indication. The majority of these phenomena happen during the ashing DONT WALK time. The aim of this research is to obtain the optimal trac light green and red time to minimize the fuzzy queue length of vehicles
Figure 2. Sensitivity analysis for two-phase intersection.
and pedestrians. The notations used for the problem formulation are as follows:
i The number of phases in an intersection.
Li The lower bound of the green time in
phase i.
Ui The upper bound of the green time in
phase i. ]
T IRi The fuzzy entrance ow rate of cars in
red time duration in phase i. ]
T IGi The fuzzy entrance ow rate of cars in
green time duration in phase i. T ~OGi The fuzzy exit ow rate in green time
duration in phase i.
N fT IRi The fuzzy entrance cars in red time
duration in phase i.
N fT IGi The fuzzy entrance cars in green time
duration in phase i.
N gT OGi The fuzzy exit cars in green time
duration in phase i. ]
T IPi The fuzzy entrance rate of pedestrians
in red time duration (DONT WALK) in phase i.
N fT IPi The fuzzy entrance pedestrians in red
time duration in phase i. T S Duration of the analysis period. T Ri The red time duration in phase i.
T Gi The green time duration in phase i.
CTi The cycle time duration in phase i.
NCTi Number of cycles time in the TS.
g
QR(i;j) The fuzzy queue length when red time duration in phase i and the jth cycle time is ended.
~
QG(i;j) The fuzzy queue length when green time duration in phase i and the jth cycle time is ended.
The problem is formulated as in the following model presented by Asadi and Shahsavari [16]:
MinQ1 =
n
X
i=1
N ~T IRi+ (N ~CTi 1)
(N ~T IRi+ N ~T IGi NT OG^ i); (1)
MinQ2 =
n
X
i=1
~
T IPi T Ri
: (2)
Li T Gi Ui; (3)
T Ri n
X
i=1
T Gi
!
T Gi 8i; i = 1; 2; :::; n; (4)
N ~T IRi T IR~ i T Ri 8i; i = 1; 2; :::; n; (5)
N fT IGi= fT IGi T Gi 8i; i = 1; 2; :::; n; (6)
N gT OGi= gT OGi T Gi 8i; i = 1; 2; :::; n; (7)
CTi= T Ri+ T Gi 8i; i = 1; 2; :::; n; (8)
NCTi= T S=CTi 8i; i = 1; 2; :::; n; (9)
g
QR(i;j)= gQG(i;j 1)+N fT IRi 8i; i = 1; 2; :::; n: (10)
Eq. (1) minimizes the total queue length of vehicles in all phases of the intersection; Eq. (2) minimizes the total queue length of pedestrians in all phases of the intersection. Eq. (3) restricts green time per phase to take a value within a lower bound Li and an upper
bound Ui. Eq. (4) represents the red time duration in
phase i; Eq. (5) represents the fuzzy entrance cars in red time duration in phase i.
Eq. (6) represents the fuzzy entry cars in green time duration in phase i. Eq. (7) represents the fuzzy exit cars in green time duration in phase i. Eq. (8) shows that the cycle time duration in per phases is equal to the total green and red time. Eq. (9) represents the number of cycle time per phases. When green time duration in phase i and jth cycle time is ended, the fuzzy queue length is calculated by Eq. (9). If the last cycle time duration is equal to m in the Time period Studied (TS), the objective function in Eq. (1) will minimize gQR(i;m).
There are various solution approaches to solve the multi-objective problem. Among the most widely used techniques are sequential optimization, e-constraint method, weighting method, goal programming, goal attainment, and distance-based and direction-based methods. In this study, we also proposed a novel genetic algorithm to obtain Pareto-optimal solutions based on the distance to the regression line (GADRL) for this problem.
3. Novel genetic algorithm
Evolutionary algorithms for Multi-Objective (MO) op-timization are currently gaining signicant attentions from researchers in various elds due to their eective-ness and robusteective-ness in searching for a set of global trade-o solutions. This growing interest is reected by the signicantly increasing number of dierent evolutionary-based approaches and variations of the
existing method published in technical literatures. The purpose of this study is to extend this methodology to obtain the solution to multi-objective optimal con-trol problems under the framework of NSGA-II. The Non-Dominated Sorting Genetic Algorithm (NSGA) proposed by Srinivas and Deb [20] was one of the rst evolutionary algorithms for solving multi-objective optimization problems. Although NSGA has been successfully applied to solving many problems, the main criticisms of this approach have been its high calculation's volume of nondominated sorting, lack of elitism, and the need for specifying a tunable parameter called sharing parameter. Recently, Deb et al. [21] reported an improved version of NSGA, called NSGA-II, to address all the above issues.
3.1. Multi-objective optimization and genetic algorithms
Being a population-based approach, GA is well suited to solve multi-objective optimization problems. A generic single-objective GA can be modied to nd a set of multiple non-dominated solutions in a single run. The ability of GA to simultaneously search through dierent regions of a solution space makes it possible to nd a diverse set of solutions to dicult problems with non-convex, discontinuous, and multi-modal solutions spaces. The crossover operator of GA may exploit structures of good solutions with respect to dierent objectives to create new non-dominated solutions in unexplored parts of the Pareto front. In addition, most multi-objective GAs do not require the user to prioritize, scale, or weigh objectives. Therefore, GAs have been the most popular heuristic approaches to multi-objective design and optimization problems. Jones et al. [22] reported that 90% of the approaches to multi-objective optimization aimed to approximate the true Pareto front for the underlying problem. A majority of these used a meta-heuristic technique, and 70% of all metaheuristics approaches were based on evolutionary approaches. The rst multi-objective GA, called Vector Evaluated GA (or VEGA), was proposed by Schaer [23].
Over the years, numerous techniques have been developed. Some of the well-known and credible algorithms used in many applications and their per-formances tested in several comparative studies in-clude Vector Evaluated Genetic Algorithm (VEGA), Multi-Objective Genetic Algorithm (MOGA), Weight-Based Genetic Algorithm (WBGA), Random Weight Genetic Algorithm (RWGA), Niched Pareto Genetic Algorithm (NPGA), Pareto envelop-based selection algorithm PESA, Pareto Archived Evolution Strategy (PAES), Non-dominated Sorting Genetic Algorithm (NSGA), fast Non-dominated Sorting Genetic rithm (NSGA-II), Strength Pareto Evolutionary Algo-rithm (SPEA), improved Strength Pareto
Evolution-ary Algorithm (SPEA-2), rankdensity-based genetic algorithm (RDGA), and Dynamic Multi-Objective Evolutionary Algorithm (DMOEA). Generally, multi-objective genetic algorithms dier based on their t-ness assignment procedure, elitism, or diversication approaches. Santa Chavez [24] presented a multi-objective ant colony algorithm for the Multi-Depot Vehicle Routing Problem with Backhauls (MDVRPB), where three objectives of traveled distance, traveling times, and total consumption of energy are minimized. An ant colony algorithm is proposed to solve the MDVRPB. The solution scheme allows one to nd a set of ordered solutions in Pareto fronts by considering the concept of dominance.
Zhao et al. [25] proposed a multi-objective opti-mization approach to quality and eciency in Mixed-Model Assembly Line (MMAL) by selecting the cycle time at each station. Zhu et al. [26] presented an early attempt to solve one-to-many-to-one Dynamic Pickup-and-Delivery Problem (DPDP) by proposing a multi-objective memetic algorithm called LSH-MOMA, which is a synergy of multi-objective evolutionary algorithm and Locality-Sensitive Hashing-based (LSH) local search. Hajipour et al. [27] presented a Vi-bration Damping Optimization (VDO) algorithm to solve multi-objective optimization problems for the rst time. To do this, fast non-dominated sorting and crowding distance concepts were used in order to nd and manage the Pareto-optimal solution.
3.1.1. NSGA-II: A brief overview
The notion of Non-dominated Sorting Genetic Algo-rithm (NSGA) was rst suggested by Horn et al. [28]. The main idea behind the non-dominated sorting pro-cedure is that a ranking selection method is used to emphasize the good points, and a niching method is used to maintain a stable subpopulation of the good points. NSGA diers from a simple genetic algorithm only in the way the selection operator works. The crossover and mutation operators remain as usual. The eciency of NSGA lies in the way that multiple objectives are reduced to a single tness measure by the creation of number of fronts, sorted according to non-domination. Although NSGA approach has been successfully applied to a number of multi-objective optimization problems, the main criticisms of the NSGA approach have been: (i) its high computational complexity of non-dominated sorting, O(MN3) where M is the number of objectives and N is the popu-lation size; (ii) the lack of elitism; (iii) the need for specifying the tunable sharing parameter. Recently, Deb et al. [21] reported an improved version of NSGA, which they called NSGA-II, to address all of these issues. Specically, NSGA-II alleviates all the above diculties by introducing a fast non-dominated sorting procedure with O(MN 2) computational complexity,
an elitist-preserving approach, and a parameterless niching operator for diversity preservation (crowded comparison operator). NSGA-II also incorporates a simple, yet ecient, penalty parameterless approach to solving constrained multi-objective optimization prob-lems. The constraint-handling approach in NSGA-II uses the binary selection operator, where two solutions are picked up from the population, and the better solution is chosen as follows:
1. If both of the solutions are feasible, choose the solution with a better no-dominated rank;
2. If one is feasible and the other is not, choose the feasible solution;
3. If both of the solutions are infeasible, choose the solution with a smaller overall constraint violation. In the context of constrained multi-objective opti-mization, Deb modied the denition of domination between two solutions i and j as follows. A solution i is said to constrained-dominate a solution j if any of the following conditions is true.
a) Solution i is feasible and solution j is not.
b) Solutions i and j are both infeasible, but solu-tion i has a smaller overall constraint violasolu-tion.
c) Solutions i and j are feasible and solution i dominates solution j.
The eect of using this constrained-domination principle is that any feasible solution has a better non-domination rank than any infeasible solution. All feasible solutions are ranked according to their non-domination level based on the objective function val-ues. However, between two infeasible solutions, the solution with a smaller constraint violation has a better rank. In fact, when an evolutionary algorithm is applied to multi-objective optimization, two major problems should be considered. The rst is how to maintain various populations to prevent premature convergence and achieve a well-distributed trade-o front; the second is how to achieve tness assignment and selection, separately, to guide the search towards the Pareto-optimal front.
3.2. Implementation details of the proposed algorithm for multi-objective optimal control problems
In GA terminology, solution vector x 2 X is called an individual or a chromosome. Chromosomes are made of discrete units called genes. Each gene controls one or more features of the chromosome. In the original implementation of GA by Holland, genes are assumed to be binary digits. In later implementations, more varied gene types have been introduced. Normally, a chromosome corresponds to a unique solution x in the solution space. This requires a mapping mechanism between the solution space and chromosomes.
This mapping is called an encoding. In fact, GA works on the encoding of a problem, not on the problem itself.
In this paper, the chromosomes show the sum of green time duration of the trac light system. Chromosome length depends on a number of lighting groups inside each intersection.
GA operates with a collection of chromosomes, called a population. The population is normally and randomly initialized. The number of chromosomes inside the population also needs to be decided, because the number of the solutions determines the speed of the optimization and accuracy of the solution found. If too many solutions are generated in the population, then longer duration of time is needed to nd the ttest optimization. However, if the number of the solutions is too few or small, the genetic algorithm may face the problem of nding the ttest optimizations.
The key feature of our GA-based optimization strategy is the formulation of regression line, named PDNSGA (Non-Dominated Sorting Genetic Algorithm base on Perpendicular Distance). Linear regression at-tempts to model the relationship between two variables by tting a linear equation to observed data. One variable is considered to be an explanatory variable, and the other is considered to be a dependent variable. For example, a modeler might want to relate the weights of individuals to their heights using a linear regression model. The formula for the best-tting line (or regression line) is y = mx + b, where m is the slope of the line, and b is the y-intercept. This equation itself is the same one used to nd a line in algebra; however, it should be noted that in statistics, the points do not lie perfectly on a line{the line is a model around which the data lie if a strong linear pattern exists.
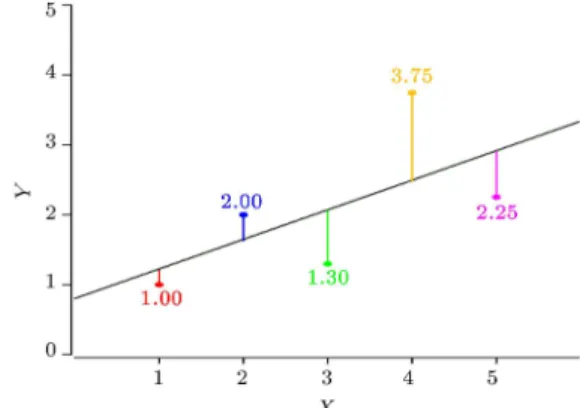
Linear regression consists of nding the best-tting straight line through the points. The best-best-tting line is called a regression line. The black diagonal line in Figure 3 is the regression line which consists of the predicted score on Y for each possible value of X. The vertical lines from the points to the regression line represent the errors of prediction. As we can see, the red point is very close to the regression line; its error of prediction is small. By contrast, the yellow point is much higher than the regression line; therefore, its error of prediction is large.
we may have noticed that we have not specied what is meant by \best-tting line." By far, the most commonly-used criterion for the best-tting line is the line that minimizes the sum of the squared errors of prediction. That is the criterion that was used to nd the line in Figure 4. The last column in Table 1 shows the squared errors of prediction. The sum of the squared errors of prediction shown in Table 1 is lower than it would be for any other regression line. No-tice that error column sums (Y Y0) equal zero.
Figure 3. A scatter plot of the example data. The black line consists of the predictions, the points are the actual data, and the vertical lines between the points and the black line represent errors of prediction.
Figure 4. A \two-phase intersection". Table 1. Example data.
X Y Y0 Y Y0 (Y Y0)2
1 1 1.21 -0.21 0.044
2 2 1.635 0.365 0.133
3 1.3 2.06 -0.76 0.578
4 3.75 2.485 1.265 1.6 5 2.25 2.91 -0.66 0.436
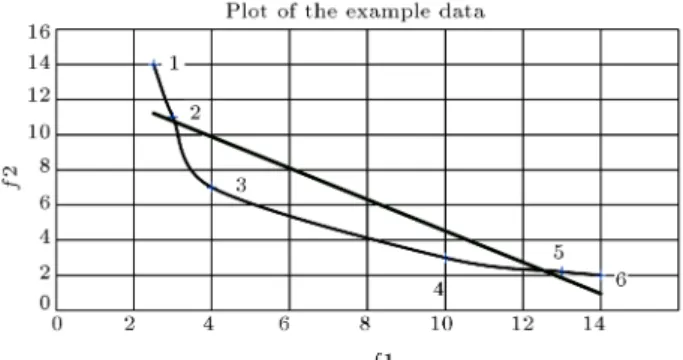
In this study, we use the specications of re-gression line to improve the performance of NSGA-II algorithm according to density estimation. To get an estimate of the density of solutions surrounding a particular solution in the population, we calculate the perpendicular distance from the perpendicular line to the regression line passing through the point (f1; f2; f3; :::; fn) where n is the number of objectives. In NSGA-II algorithms, the crowded-comparison oper-ator guides the selection process at various stages of the algorithm toward a uniformly spread-out Pareto optimal front. In this study, we use a new crowded-comparison operator described below. Although Fig-ure 5 illustrates the crowding-distance computation for two objectives, the procedure is applicable to more than two objectives as well:
Figure 5. Non-dominated solutions for example data. Table 2. Mean value.
Example data Mean
f1 14 13 10 4 3 2.5 7.8
f2 2 2.2 3 7 11 14 6.5
Determine the mean value (f1; f2) for each objec-tive in each non-dominated sorting front;
Calculate the regression line for each non-dominated sorting by the following equation:
b =
N
P
i=1(F 1i
F 1)(F 2i F 2) N
P
i=1(F 1i
F 1)
; (11)
a = F 2 b: F 1; (12) F 2 = b:F 1 + a: (13)
Find the equation of a line passing through the mean point (f1; f2) and perpendicular to the regression line (red line in Figure 3) using the following equation; two lines are per-pendicular if b1:b2 = 1. In other words, the slopes of the two lines (b1:b2)
must be negative reciprocals of each other:
y = 1 b x +
f2 +1
bf1
: (14)
Calculate the distance (blue line in Figure 3) be-tween each solution in the non-dominated sorting (f1i; f2i) and perpendicular to the regression line
passing through point (ui; vi), reached in Eq. (14)
using the following equation:
di=
q
(f1i Ui)2+ (f2i Vi)2: (15)
For example, we obtained the regression line and perpendicular to the regression line passing through mean point (f1; f2) and crowding-distance (di)
accord-ing to Table 2.
If we use the crowded-comparison operator ac-cording to NSGA-II algorithm, we choose point 4 that has lesser crowding distance than point 5, that is, between two solutions with diering non-domination ranks, we prefer the solution with the lower (better) rank. Otherwise, if both solutions belong to the same front, then we prefer the solution that is located in a lesser crowded region. In the proposed approach, we replace the crowding distance approach with a new approach that eliminates the above diculties to some extent. The new approach does not require any user-dened parameter for maintaining diversity among population members. The new approach chooses point 5 because it has a greater distance compared to point 4 that is located in a lesser crowded region. Globally, point 5 is better than point 4 as it leads to divergence and extends in non-dominated solutions; it enables decision-makers to evaluate a greater number of alternative solutions.
The details of the algorithm can be outlined as follows:
Step 1. Initially, a random parent population, P 0, is created. The population is sorted based on the nondomination.
Each solution is assigned a tness (or rank) equal to its no-domination level. The usual binary tournament selection, recombination, and mutation operators are used to create an ospring population Q0 of size N. Let t = 0;
Step 2. A combined population Rt = P t [ Qt is formed. Population Rt is of size 2N. Then, population Rt is sorted according to nondomination. The best non-dominated set F i is formed;
Step 3. The perpendicular distance operator n is chosen to sort the non-dominated set F i in descending order. The best N members of the set are chosen for the new population P t + 1;
Step 4. The new population P t + 1 is now used for selection, crossover, and mutation to create a new population t + 1.
Step 5. When the termination condition meets, the loop stops; otherwise, t = t + 1, then turn back to Step 2.
4. Illustrative example
The site of our case study chosen for this study is a major arterial in Central Tehran, regularly crossed by cars, trucks, public transportation buses and mopeds. By adopting the formalism introduced in Section 3, the signalized area in Figure 6 is modelled with 8 links, including 4 input and 4 output links.
The model is programmed in the Microsoft Ex-cel 2007 software using the Visual Basic Application
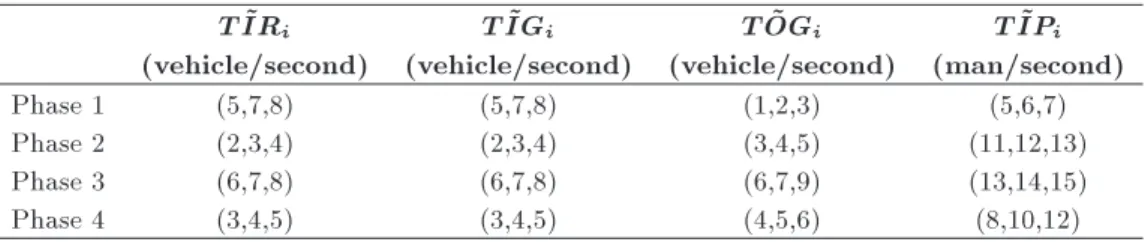
(VBA). Problem's data given in Table 3 are entered into the application software. We assume the time period studied (AT) to be equal to 30 minute. In other words, in every 30 minutes, road detectors send the trac data for optimization process. Also, assume that the lower bound of the green time duration per phase, Li, is equal to 10 seconds, and the upper bound of
the green time duration per phase, Ui, is equal to 138
seconds.
In this example, there are 268, 435, and 456 solutions. The presented model is solved in order to obtain the optimal solution. The GA parameters are set as follows: G = 100, N = 70, one-point crossover rate = 0.85, and mutation rate = 0.2. The program is run on a Pentium 4 PC with CPU 2.8 GHz; T G1= 10,
T G2= 15, T G3 = 110, T G4= 34, and its best Pareto
solution is obtained according to Figure 2.
5. Experimental evaluation
In order to test the convergence of the algorithm, the optimization results (see Figure 7) of the proposed algorithm after 50 and 100 generations are compared. As illustrated in Figure 8, the converged speed of the proposed algorithm is relatively fast. After 50 gener-ations, the optimization results have already obtained a relatively good convergence, which is similar to the optimization results after 100 generations. In this way, the evaluation generation can be reduced when it is necessary to consider the calculation time. Although the accuracy of the solution may be lower, it can still be acceptable based on the experimental results.
Figure 6. An intersection in trac network with four phases.
This section evaluates the performances of our proposed GADRL and WBGA [29]. These algorithms are coded and implemented in Excel 2007 by the VBA and are run on a Pentium 4. This section evaluates the performances of the proposed PDNSGA, NSGA-II, MOGA, and WBGA. These algorithms are coded and implemented in Excel 2007 by the VBA and are run on a Pentium 4 PC with CPU 2.8 GHz and 512 MB of RAM memory. We use the mean deviation from the ideal point (MDI) as a common performance measure to compare these algorithms computed by:
MDIi= k
P
i=1
q
(F 1i F 1i)2+ (F 2i F 2i)2
k ; (16) where F 1 and F 2are the best solutions obtained by
each algorithm for a given instance. F1 and F2 are
Figure 7. The best Pareto solution of the proposed algorithm.
Figure 8. Distribution of optimal solutions after various generations: (a) Initial distribution and (b) distribution of optimal solutions after 50 and 100 generations.
Table 3. The fuzzy entry and exit rate per phase of intersection. T ~IRi
(vehicle/second)
T ~IGi (vehicle/second)
T ~OGi (vehicle/second)
T ~IPi (man/second)
Phase 1 (5,7,8) (5,7,8) (1,2,3) (5,6,7)
Phase 2 (2,3,4) (2,3,4) (3,4,5) (11,12,13)
Phase 3 (6,7,8) (6,7,8) (6,7,9) (13,14,15)
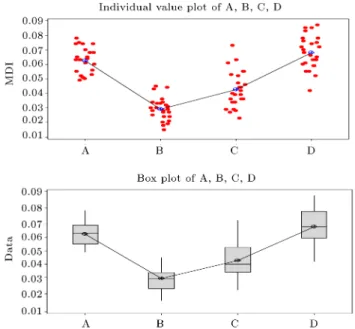
Figure 9. Means plot and LSD intervals for the MOGA (A), PDNSGA (B), NSGA-II (C), and WBGA (D).
the total queue length of vehicles and pedestrians for a given algorithm, respectively, and k is the number of point in each Pareto solution. The PDNSGA, NSGA-II, MOGA, and WBGA are implemented with the same parameters for twenty-ve times. Their results are analyzed via the analysis of variance (ANOVA) method. The means plot and the Least Signicant Dierent (LSD) interval for the MOGA, PDNSGA, NSGA-II, and WBGA are shown as in Figure 9. It is demonstrated that our proposed algorithm (PDNSGA) gives better outputs than MOGA, NSGA-II, and WBGA do for this problem, statistically.
The proposed PDNSGA procedure has several advantages in speed, exibility, and accuracy, which would be prominent during its application. Firstly, the proposed PDNSGA procedure runs eciently. It takes less than half a minute for the proposed PDNSGA procedure to run 50 generations with 5 dierent ran-dom seeds in VBA, while it takes NSGA-II around 3.5 minutes to run 50 generations with only one random seed. Secondly, the proposed GA procedure is exible, thus can be used in dierent intersections under dif-ferent circumstances. The variation includes geometric design of the intersection, vehicle and pedestrian vol-umes, initial queues, and other trac relevant param-eters. Thus, the signal plan selected by the PDNSGA procedure would be a suitable solution, particularly for that intersection with those trac characteristics. Moreover, although the analysis period is set as 30 minutes in the tests, it can be set as any positive values, such as 10, 5, or 2 minutes. The shorter the analysis period is, the faster the signal plan responds to the change of trac demands. With a cycle-length-long analysis period, the PDNSGA procedure can realize a
real-time signal plan optimization. However, frequent switches between two pedestrian crossing patterns and big signal timing dierence between adjacent cycles should be avoided. Otherwise, either one of them can cause confusion for both drivers and pedestrians, which might bring severe safety issues. In addition, if an object-oriented platform can be set up, the application of the proposed procedure would be even more user-friendly and easier to use. The proposed GA procedure considers pedestrian and vehicle delays in the total user time. However, there are other transportation users as well, e.g. cyclists and buses. Therefore, including the delays of other transportation users into the total user time could be one of the areas for further research.
6. Conclusion
A GA optimization procedure was developed in this paper to optimize signal timing of an individual inter-section by minimizing total user time, which considers both vehicle and pedestrian delays. In order to verify the proposed optimization procedure, the impact of vehicle and pedestrian volumes on signal plans was tested in a hypothesized intersection. Signal plans selected by the GA procedure are reasonable. Phase lengths increased with the growth of the corresponding critical vehicle or pedestrian volumes.
The main contribution of this paper is presen-tation of a multi-objective optimization algorithm to optimize trac signal timing at oversaturated intersec-tion. In the proposed algorithm, maximum throughput and minimum average queue ratio were selected as the optimization objectives to meet the characteristics of oversaturated trac ow. A problem-solving algo-rithm, which found an optimal solution, considered the total queue length of vehicles and pedestrians. To solve the given problem, a new genetic algorithm (PDNSGA) was also developed. The model was programmed in the Microsoft Excel 2007 software using the Visual Basic Application (VBA). The proposed algorithm has the capability of searching Pareto front of the multi-objective problem domain. Further jobs should be concerned with the signal timing optimization method for oversaturated coordinated intersections or small-scale road network and real-eld applications with the trac signal controller. The high speed of the proposed algorithm and its quick convergence make it desirable for large scheduling with a large number of phases. Fur-thermore, we used the mean deviation from the ideal point (MDI) measure to compare the performances of the MOGA, PDNSGA, NSGA-II, and WBGA by the ANOVA method. By considering uncertainty in processing time, this model can be extended to the cases, which can be more realistic.
The proposed GA procedure is only capable of optimizing signal plans for an individual intersection.
However, there might be several intersections that need to be optimized by minimizing the total user time of both vehicles and pedestrians, especially in a central business district. Therefore, expanding the object of the GA procedure from an individual intersection to a network or arterial could be one of the areas for further research.
References
1. Ishaque, M.M. and Noland, R.B. \Multimodal mi-crosimulation of vehicle and pedestrian signal tim-ings", In Transportation Research Record 1939, TRB, National Research Council, Washington, D.C, pp. 107-114 (2005).
2. Ishaque, M.M. and Noland, R.B. \Trade-os between vehicular and pedestrian trac using micro-simulation methods", In Transportation Policy, 14, pp. 124-138 (2007).
3. Bhattacharya, P. \Methodology to optimize for pedes-trian delay and vehicular delay in a signal network", M.S. Thesis, University of Missouri-Columbia (2004).
4. Bhattacharya, P. and Virkler, M.R. \Optimization for pedestrian and vehicular delay in a signal network", In Transportation Research Record 1939, TRB, Na-tional Research Council, Washington, D.C, pp. 115-122 (2005).
5. Li, M., Alhajyassen, W.K.M., and Nakamura, H. \A trac signal optimization strategy considering both vehicular and pedestrian ows", Presented at the 89th Annual Meeting of the Transportation Research Board, Washington, D.C. (2009).
6. Mehan, S. \Introduction of trac light controller with fuzzy control system", International Journal of Electronics & Communication Technology, 2(3), pp. 119-122 (2011).
7. Barzegar, B. \Fuzzy logic controller for trac signal controller unit system and modelling with colored petri net", Indian Journal of Science and Technology, 4(11), pp. 1420-1428 (2011).
8. Gokulan, B.P. and Srinivasan, D. \Distributed geo-metric fuzzy multiagent urban trac signal control", IEEE Trans. Intell. Transp. Syst., 11(3), pp. 714-727 (September 2010).
9. Blum, C. and Roli, A. \Metaheuristics in combinato-rial optimization: overview and conceptual compari-son", ACM Comput. Surveys (CSUR), 35(3), pp. 268-308 (2003)
10. Holm, P., Tomich, D., Sloboden, J., and Lowrance, C. \Trac analysis toolbox volume iv: guide-lines for applying corsim microsimulation modeling soft-ware", Technical Report, National Technical Informa-tion Service-5285 Port Royal Road Springeld, VA 22161, USA-Final Report (2007)
11. Turky, A.M., Ahmad, M.S., Yuso, M.Z., and Ham-mad, B.T. \Using genetic algorithm for trac light control system with a pedestrian crossing", RSKT '09:
Proceedings of the Fourth International Conference on Rough Sets and Knowledge Technology, Berlin, Heidelberg, pp. 512-519 (2009).
12. Odeh, S.M., Mora, A.M., Moreno, M.M., and Merelo, J.J., A Hybrid Fuzzy Genetic Algorithm for an Adap-tive Trac Signal System, Hindawi Publishing Corpo-ration Advances in Fuzzy Sys-tems, Article ID 378156 (2015).
13. Aboudolas, K., Papageorgiou, M., Kouvelas, A., and Kosmatopoulos, E. \A rolling-horizon quadratic-programming approach to the signal control problem in large-scale congested urban road networks", Trans-portation Research. Part C: Emerging Technologies, 18, pp. 680-9(2010).
14. Gottlich, S., Herty, M., and Ziegler, U. \Modeling and o timing trac light settings in road networks", Computers & Operations Research, 55, pp. 36-51 (2015).
15. Collotta, M., Bellb, L., and Pau, G. \A novel ap-proach for dynamic trac lights management based on wireless sensor networks and multiple fuzzy logic controllers", Expert Systems with Applications, 42, 13, pp. 5403-5415 (2015).
16. Shahsavari Pour, N., Asadi, H., and Pour Kherad-mand, M. \Fuzzy multiobjective trac light signal optimization", Journal of Applied Mathematics, 7, pp. 01-07 (2013).
17. Duerr, P. \Dynamic right-of-way for transit vehicles: integrated modeling approach for optimizing signal control on mixed trac arterials. In transportation re-search broad", Journal of the Transportation Rere-search Board, 1731, pp. 31-39 (2000).
18. Girianna, M. and Benekohal, R.F. \Dynamic signal coordination for networks with oversaturated intersec-tions", In Transportation Research Record 1811, TRB, National Research Council, Washington, D.C., pp. 122-132 (2002).
19. Girianna, M. and Benekohal, R.F. \Using genetic algo-rithms to design signal coordination for oversaturated networks", In Journal of ITS: Technology, Planning, and Operations, 8(2), pp. 117-129 (2004).
20. Srinivas, N. and Deb, K. \Multiobjective optimization using nondominated sorting in genetic algorithms", J Evol Comput, 2(3), pp. 221-48 (1994).
21. Deb, K., Pratap, A., Agarwal, S., and Meyarivan, T. \A fast and elitist multiobjective genetic algorithm", NSGA-II. IEEE Trans. Evol. Comput., 6(2), pp. 182-97 (2002).
22. Jones, D.F., Mirrazavi, S.K., and Tamiz, M. \Mul-tiobjective metaheuristics an overview of the current state-of-the-art", Eur. J. Oper. Res., 137(1), pp. 1-9 (2002).
23. Schaer, J.D. \Multiple objective optimization with vector evaluated genetic algorithms", In: Proceedings
of the International Conference on Genetic Algorithm and Their Applications (1985).
24. Chavez, S., Willmer, J., and Echeverri, E.M.G. \A multi-objective Pareto ant colony algorithm for the multi-depot vehicle routing problem with backhauls", International Journal of Industrial Engineering Com-putations, 7, pp. 35-48 (2016).
25. Zhao, X., Hsu, Y.C., ChangB, P.C., and Li, L. \A genetic algorithm for the multi-objective optimization of mixed-model assembly line based on the mental workload", Engineering Applications of Articial In-telligence, 47, pp. 140-146 (2016).
26. Zhu, Z., Xiao, J., He, S., Zhen, J., and Sun, Y. \A multi-objective memetic algorithm based on locality-sensitive hashing for one-to-many-to-one dy-namic pickup-and-delivery problem", Information Sci-ences, 329, pp. 73-89 (2016).
27. Hajipour, V., Mehdizadeh, E., and
Tavakkoli-Moghaddam, R. \A novel Pareto-based multi-objective vibration damping optimization algorithm to solve multi-objective optimization problems", Scientia Iran-ica E, 21(6), pp. 2368-2378 (2014).
28. Horn, J., Nafpliotis, N., and Goldberg, D.E. \A niched Pareto genetic algorithm for multiobjective optimiza-tion", In: Proceedings of the First IEEE Conference on Evolutionary Computation. IEEE World Congress on Computational Intelligence, pp. 27-29 June, 1994. Orlando, FL, USA: IEEE (1994).
29. Spieksma, F.C.R. and Woeginger, G.J. \The no-wait ow-shop paradox", Operation Research Letter, 33, pp. 603-608 (2005).
Biographies
Hamed Asadi received his BSc in industrial engi-neering from the Islamic Azad University of Abhar in 2003, then he applied for Science and research
branch of Islamic Azad University to study MSc in Industrial Engineering in 2010. He published several research in fuzzy number ranking, ow shop scheduling, trac signal optimization problem, balance score card, strategic management and multi objective decision making. He received his PhD degree from Tehran Science and Research University in Iran.
Reza Tavakkoli-Moghaddam received his MS de-gree in Industrial Engineering from Melbourne Univer-sity, Australia, and his PhD degree from Swinburne University of Technology, UK. He is currently a Pro-fessor of Industrial Engineering at Tehran University, Iran. His research interests include facility layouts and location design, cellular manufacturing systems, sequencing and scheduling, and using meta-heuristics for combinatorial optimization problems. He is the author of over 100 journal papers and 150 papers in conference proceedings.
Nasser Shahsavari Pour is an Assistant Professor of Industrial Engineering at the University of Vali-e-Asr, Rafsanjan, Iran. He received his MS degree and PhD degrees from Sharif University of Technology and Tehran Science and Research University in Iran, respectively. He has published more than 40 papers in reputable academic journals (JCR and ISI) and conferences.
Esmail Naja is an Assistant Professor of Industrial Engineering at the University in Islamic Azad Univer-sity, Science and Research branch, Iran. He received his PhD degree from Tehran Science and Research University in Iran, respectively. He has published more than 40 papers in reputable academic journals (JCR and ISI) and conferences.