Sharif University of Technology
Scientia IranicaTransactions A: Civil Engineering www.scientiairanica.com
Uncertainty analysis using fuzzy randomness method
towards development of fragility curves for
moment-resisting steel structures
M.R. Zolfaghari, S.B. Beheshti Aval
and E. Khojastehfar
Faculty of Civil Engineering, K.N. Toosi University of Technology, Tehran, Iran.Received 9 December 2013; received in revised form 7 May 2014; accepted 22 June 2014
KEYWORDS Seismic fragility curves;
Fuzzy randomness method;
First order second moment method; Uncertainty treatment;
Monte Carlo method.
Abstract. Seismic fragility analysis is one of the main steps of consequence based earthquake engineering process. Accurate uncertainties modeling involved in this method-ology, aects the nal results of seismic fragility analysis and hence assessment of decision variables which are the nal products of performance-based seismic analysis. One aspect of such eorts is to incorporate the sources of uncertainties associated with various factors controlling seismic loads on the buildings as well as structural responses to such excitations. Probabilistic approach is usually used to model quantitative sources of such uncertainties, however, there are other factors with descriptive nature which probabilistic approach may not well incorporate them. In this paper a fuzzy randomness approach is used to model epistemic uncertainties as an alternative to the conventional probabilistic method. The approach is used to model those uncertainties which have not been addressed by the others, in particular the denition of the collapse limit state. To illustrate the eciency of the proposed approach, fragility curves for a sample moment-resisting steel frame are developed. The results demonstrate the superiority of fuzzy solution in comparison with excising probabilistic methods to incorporate epistemic uncertainty in view of much less computational eort.
© 2015 Sharif University of Technology. All rights reserved.
1. Introduction
There are four major components and sources of uncer-tainties involved in the consequence-based evaluation of structural seismic performance. Such evaluation of building performance should be able to incorporate variability associated with seismic hazard, structural performance, structural damage, and decision vari-ables. These uncertainties should be taken into account
*. Corresponding author. Tel.: +98 21 88786215; Fax: +98 21 88779476
E-mail addresses: [email protected] and [email protected] (M.R. Zolfaghari); [email protected] and sb [email protected] (S.B. Beheshti Aval); [email protected] (E. Khojastehfar)
in order to provide solutions which could assist all stakeholders to make reasonable decision with regard to desired performance of new buildings or those under retrotting process. PEER [1] summarizes the decision variables as number of casualties, down time and economic loss, and presents a consistent probabilistic framework to incorporate sources of uncertainties to-wards assessment of these decision variables [2].
Variability in the Intensity Measure (IM) is usu-ally expressed by probabilistic strong ground motion values with various return periods or probability of exceedance. As intensity measure various parameters, such as Peak Ground Acceleration (PGA), Spectral Acceleration of rst-mode natural period (SA) [3], or vector valued SA and epsilon may be used [4]. The variability in the estimated ground motion proposed
by conventional seismic hazard methods project the likelihood of seismic events, as well as variability of induced ground motions modeled by empirical at-tenuation functions. Seismic hazard variability may also address other sources of uncertainties associated with earthquake source mechanism, ground motion frequency content and duration and even record-to-record variability [5].
The results of performing multiple nonlinear dy-namic analyses of structural model subjected to a selected set of ground motion records (each scaled to increasing level of intensity) can be presented in terms of IDA curves. Each curve represents intensity measure (scalar/vector) versus Engineering Demand Parameter (EDP). The EDPs are commonly measured in terms of maximum story drift, oor acceleration or plastic hinge rotation. The contribution of EDP given IM (EDPjIM), in PEER probabilistic framework, is calcu-lated based on results of IDA curves [3]. Probabilistic damage analysis, which relates the EDP to Damage Measurements (DMs), is the next step in DV assess-ment. The DMs quantitate descriptions of damage to components of a building which aects DVs, and may be categorized damages to structural elements, nonstructural elements and contents. Probabilistic aspect of DM given EDP (DMjEDP) is another contri-bution to DVs uncertainties. Successful evaluation of assumed DVs, in terms of necessary repairs, downtime estimation or number of casualties, requires DMs to be estimated relevantly. The seismic fragility functions, dened as the probability of a structural system or element reaching or exceeding a damage state, given a seismic intensity measure or EDP for equal seismic hazard, constitute probability context of damage. The convolution of these conditional probabilities is pre-sented in the following form by PEER [6]:
(DV)= ZZZ
G(GVjDM)dG(DMjEDP)
dG(EDPjIM)d(IM); (1) where, (DV) is the annual rate of exceeding a de-cision variable(s), G(DVjDM) is the complimentary cumulative distribution function of DV conditioned on the engineering damage measure(s), G(DMjEDP) is the complimentary cumulative distribution function of DM conditioned on engineering demand parame-ter(s), G(EDPjIM) is the complimentary cumulative distribution function of EDP conditioned on intensity measure(s), and d(IM) is the mean annual frequency of intensity measure(s). In this paper, uncertainties of a sideway collapse damage measure in moment-resisting steel structures are investigated. Sideway collapse is the consequence of successive reduction of load-carrying capacity of structural components that are part of building's lateral load-resisting system to
the extent that second-order (P ) eects, accel-erated by component deterioration, overcome gravity load resistance [7]. Two distinct uncertainty sources, entitled as aleatory, due to randomness, and epistemic, due to lack of knowledge or inaccuracy of analytical model, aect the characteristics of collapse fragility curves [5,8].
Probability theory has been applied to involve eects of these uncertainty sources and their com-binations by several researches [5]. A Monte Carlo simulation, based on several realizations of probable parameters according to their probability distributions as input data for dynamic analyses, has been applied to structures resulted in variation of collapse performance of buildings, presented by lognormal probability distri-butions [9,10].
Variations associated with some parameters, such as construction quality and human errors, may not well be presented by probability distributions. On the other hand, the limit states, which are dened linguistically as EDP or IM thresholds, corresponds to initiation of various damage states [11]. Probabilistic methods must be enhanced to involve these sources of uncertainties. In this paper, the fuzzy randomness method is proposed to consider epistemic uncertainties eects on collapse fragility curves of steel moment-resisting frames. Variability of applied strong ground motions is considered as aleatory uncertainty, while connection moment-rotation modeling parameters, en-titled as plastic hinge rotation capacity (P), post
capping rotation capacity (pc), and rate of cyclic
deterioration (), of steel connections based on the mo-ment rotation model proposed by Ibarra and Krawin-kler [9], are considered as epistemic uncertainties. In previous researches, eects of these parameters on col-lapse performance of structures have been considered by First Order Second Moment (FOSM) and Monte Carlo simulation Methods [12]. In this paper, fuzzy randomness method is applied to involve modeling parameters uncertainties. Further application of the proposed method may be involving uncertainties of parameters which may not be presented by probability distributions.
Fuzzy numbers and fuzzy logic, introduced by Zadeh in 1965 [13], are powerful tools to incorporate epistemic uncertainties eects of linguistic variables in various problems [14]. Fuzzy numbers are represented by a membership function, which shows the member-ship degree of the variable belonging to a set. Since the experimental results, used by Lignos [15], have large values of dispersion, as the rst step, in this study the modeling parameters are considered fuzzily and the results are veried by previous probabilistic method-ologies. Further application of proposed formulation may be used similarly for the sources of uncertainties, which may not be represented by probability
distribu-tions such as human errors and construction quality. Non-probabilistic method of uncertainty treatment, applying fuzzy randomness method, has been used in structural analysis and optimization [16], damage detection, seismic risk analysis [17], safety assessment of structures [18] and structural reliability [19]. This method has not yet been applied to seismic fragility curves derivation, applicable in probabilistic framework of PEER. In this research, considering modeling uncer-tainties as fuzzy numbers, fuzzy randomness method-ology is proposed to consider epistemic uncertainties and to derive 3-dimentional collapse fragility curves, presenting epistemic and aleatory uncertainties, sepa-rately.
2. Probabilistic formulation of collapse fragility curve
Based on key variable selection, formulation of collapse fragility curve may be written in IM-based or EDP-based formats [7]. IM-EDP-based formulation, which applies IM as controlling variable, is written as:
P (CollapsejIM = imi)=P (imi> IMLS)=FIMLS(imi);
(2) where, FIMLS(imi) is the cumulative probability
dis-tribution, expressed by intensity measure of imposed strong ground motion, which is extracted through application of IDA to considered structure. Derivation of parameters of this probability distribution requires a denition of IMLS and a procedure to propagate
the epistemic and aleatory uncertainties involved in IMc[7]. Applying EDP as intermediate variable,
EDP-Based formulation is written as:
P (CollapsejIM=imi)=edpcP (EDPd>EDPcjEDPc
= edpci; IM=imi):P (EDPc=edpci):
(3) The collapse limit state, considered in this study, is dened as the IM of strong ground motion in which the structure undergoes the dynamic instability. In other words, IMcis dened as the last-converged result on an
IDA curve at which the nonlinear response history anal-ysis has converged [7]. Estimation of collapse capacity of structures by EDP-based formulation results in underestimation of EDPc, since the remaining capacity
left after IDA curve passes the collapse criterion of 20% of initial slope; furthermore EDPc is a function of
IM, which adds another approximation of EDP-based method [12]. In this paper, IM-based formulation is applied to evaluate collapse fragility curve of struc-tures. Applying this approach, for each IDA curve a point will be the representative of IMCollapse and
the exceedance probability distribution of collapse limit
state will be achieved [12]. If xed values of modeling parameters are considered, only aleatory uncertainties will be involved.
The collapse fragility curves are represented by lognormal probability distributions [9]. The fragility curves obtained from IDA analysis is:
P (CjIM = imi) =
Ln(imi)
; (4)
in which (:) is the standard Gaussian distribution function and and are mean and standard deviation of collapse fragility curve, respectively.
3. Epistemic uncertainty treatment
There are varieties of methods for considering epistemic uncertainties eects, such as sensitivity analysis, First-Order-Second-Moment Method (FOSM) and Monte Carlo simulation methods. In sensitivity analysis, the eect of each random variable on structural response is determined by varying a single modeling parameter and re-evaluating the structure's performance. This method has been applied to select the most important parameter in performance assessment of structures [20-23].
In FOSM method, collapse capacity limit state g(x) is linearized applying a Taylor series expansion about the mean values of modeling parameters at x = . So that, mean of collapse fragility function is unchanged, that is g= g(x = ), while variance of
collapse fragility function is computed from gradients of g(x). Gradients of g(x) are calculated by perturba-tion of modeling parameters in a series of sensitivity analysis, which can be done by one-side or two-side methods [4,9]. Calculation of g(x) derivatives by one-side and two-one-side methods, respectively, are given by:
@g @Q=
g(Q) g(Q nQ)
nQ ; (5)
@g @Q=
g(Q nQ) g(Q+ nQ)
2nQ : (6)
Changes in mean values of collapse fragility curves cannot be predicted applying FOSM method. In Monte Carlo methods, thousands of input random variable realizations and collapse capacity calculation for each realization results in probability distribution of collapse capacity of assumed structure [24-27]. The crude Monte Carlo method is very elaborate in imple-mentation and is not practical for collapse prediction of structures with probable modeling parameters [5]. Response surface based Monte Carlo method has been applied to reduce computational eorts by several researches [5,24].
The methods for combination of epistemic and aleatory uncertainties are categorized into mean estimate method [28] and Condence Interval Method [29,30]. Applying mean estimate method, mean value of collapse fragility curve is remained unchanged, and epistemic uncertainties aect standard deviation of collapse fragility curve. On the other hand, in Condence Interval Method, epistemic uncertainties aect mean value of collapse fragility curves and stan-dard deviation remains unchanged.
Applying hysteretic models which are capable of modeling deterioration of components is important aspect of accurate estimation of collapse limit state in structures and has been investigated in a numerous studies [7,9,31-33]. According to advantages, such as capability of modeling various modes of compo-nent deterioration, renement of parameters denition and consistency with experimental tests of steel and concrete components [15], modied Ibarra-Krawinkelr model is applied here [5]. Modeling parameters of steel moment resisting connections are considered as epistemic uncertainties, and their eects on collapse fragility curves are investigated in this paper. The backbone curve of considered moment-rotation model, referred to as modied Ibarra-Krawinkler model is shown in Figure 1.
Denition of modeling parameters (Figure 1) is as follows:
c: Cap rotation
My : Eective yield moment
y: Eective yield rotation
c: Ultimate rotation Capacity
p: Plastic rotation Capacity
pc: Post-Capping rotation Capacity.
The hysteretic behavior of the connection is de-ned based on deterioration rules which are dede-ned according to hysteretic energy dissipated in each
hys-Figure 1. Back-bone curve of moment rotation model based on modied Ibarra-Krawinkler model (Ibarra et al., 2005 [9]).
Figure 2. Eects of cyclic deterioration modeling on M-backbone curves (Zareian et al., 2009 [12]).
teretic cycle. The deterioration of basic strength, post capping strength, unloading stiness and reloading stiness can be considered in this model [22]. Compar-ison of considering and neglecting cyclic deterioration of component behavior is shown in Figure 2 [12].
Capacity of energy dissipation of the component is dened by:
Et= My; (7)
where is rate of cyclic deterioration and is evaluated according to calibration of experimental results, which is considered as a modeling parameter in this study. It has been shown that P, pc and have the
most appreciable eects compared to other modeling parameters on collapse performance of structures [34]. In this study these three parameters have been chosen as modeling parameters including inherent epistemic uncertainty.
4. Proposed method to propagate epistemic uncertainties
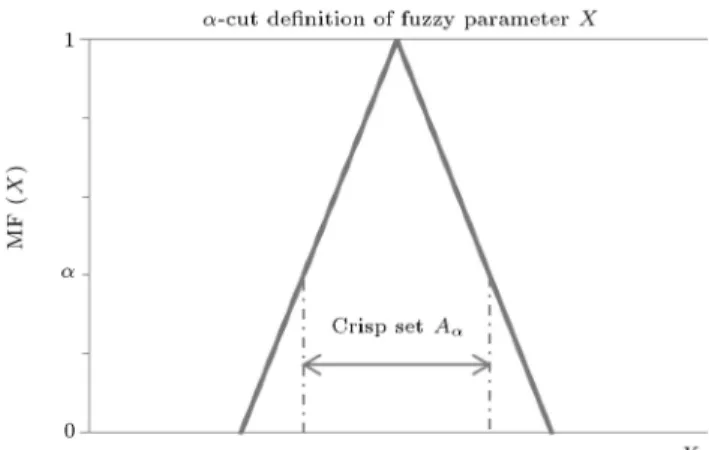
In this paper, the fuzzy randomness approach is proposed for propagation of epistemic uncertainties. Application of fuzzy randomness method, in treatment of epistemic uncertainty, is summarized in [18]. In this method, the parameters with epistemic uncertainties are presented by fuzzy numbers, dened by Zadeh in 1965 [13]. For a given membership function value, , a crisp set, A, is obtained as shown in Figure 3. This is referred to as a \-cut" set and expressed by:
A= fXjMF(X) g ; (8)
in which MF(X) is membership function value of pa-rameter X. A range of values for and implementing interval analysis methods developed by Rao and Berke, in 1969 [35] of input variables provides fragility curves with fuzzy means and standard deviations.
The owchart of the proposed method is shown in Figure 4. The rst step of the proposed approach is to
Figure 3. -cut denition of X.
consider limited numbers of values for input random variables. In this study, mean minus one standard deviation, mean plus one standard deviation and mean values are considered for each variable (totally 27 values). Firstly, mean and standard deviation of equivalent uncorrelated variable are calculated, and the perturbation of input variables is done based on achieved means and standard deviations. The transformation of uncorrelated realization to correlated values is implemented later in the following. Means and standard deviations of collapse fragility curves are calculated based on Incremental Dynamic Analysis of structure considering modeling parameters as per-turbed values. Quadratic surfaces are applied to derive analytical relationship between predictor variables (p,
pc and ) and response parameters (collapse fragility
curve mean and standard deviation). Formulations of applied quadratic functions are also discussed later.
In the next step, to involve epistemic uncer-tainties, the modeling variables are considered as fuzzy numbers with triangular membership functions,
between mean minus and mean plus one standard deviation; the same interval in which the perturba-tion of variables is implemented. Several intervals of variables are considered by taking various vales for -cuts of membership functions. For each inter-val, minimum and maximum of mean and standard deviation of collapse fragility curves are calculated considering constructed response surfaces, and then solving constrained nonlinear optimization problem. Extreme values of mean and standard deviation are correspondent to -cut values of derived membership functions of mean and standard deviation of collapse fragility curves, which involve the eects of epistemic uncertainties. Presentation of mean and standard deviation of collapse fragility curves by fuzzy numbers may be interpreted as the bounds of validity for collapse fragility curves.
Having Fuzzy input variables and resultant fuzzy probability distribution of collapse allows us to calcu-late the intervals of collapse probability. The interval of the probability of collapse between IM1and IM2values
is calculated based on fuzzy probability theory [14]. The interval of the probability, or possibility according to fuzzy randomness method, shows the eects of epistemic uncertainties (modeling parameters), and the probability itself shows the eects of aleatory uncertainties. Probability density function of collapse limit state, evaluated based on fuzzy input variables, has a fuzzy mean and standard deviation. The PDF is written as:
fIMc(im) =
1
(im)~p2exp
(Ln(im) ~) 2^2
; (9) in which ~ and ~ are the fuzzy mean and fuzzy standard deviation of collapse probability distribution. If z1 = IM1~ ~ and z2 = IM2~ ~, collapse probability
in the interval [IM1; IM2] is calculated based on fuzzy
probability theory [14], and is written as: ~
P [IM1; IM2][]=
Z z2
z1
fIMc(IM)d(im)j 2 ~; 2 ~)
: (10) It is proved that the probability, which is presented by Eq. (7), is a fuzzy number itself. The -cut values of this fuzzy number are presented by [36]:
~
P [IM1; IM2][] = [P1(); P2()]; (11)
in which P1() and P2() are calculated based on:
P1()=Min
Z z2
z1
fIMc(im)d(im)j 2 ~; 2 ~
;
(12)
P2()=Max
Z z2
z1
fIMc(im)d(im)j 2 ~; 2 ~
:
(13) While the intervals of probability for dierent values of IM1 and IM2 are calculated, defuzzication of
fuzzy probabilities may be done by center of mass method. The collapse probability involving both eects of aleatory and epistemic uncertainties, which is based on most common used center of gravity defuzzication method [14], is given by:
=MF(iMF(i)
i) ; =
iMF(i)
MF(i) : (14)
5. Correlation of input variables
To generate realizations of correlated variables fXg, we have to rst generate samples of uncorrelated variables fY g. Then fXg values are calculated based on the variable transformation:
fXg = [T ]fY g: (15) Consideration of correlation between input variables necessitates solving an eigenvalue problem of covari-ance matrix of input variables [X] [37]. For n input
variables, covariance matrix is dened in Eq. (14). Eigenvalues of covariance matrix are calculated by the determinant equation:
det ([X] [I]) = 0; (16)
in which [I] is the unit matrix; det(.) shows the determinant; and [X] is covariance matrix for input
variables fXg given by:
[X]=
2 6 6 4
COV(X1; X1) COV(X1; XN)
: :
: :
COV(XN; XN) COV(XN; XN)
3 7 7 5 :
(17)
Solving Eq. (15) produces n values for , each being an eigenvalue of covariance matrix. Covariance matrix and mean values of new variables, named fY g, which are uncorrelated can be calculated by [37]:
[Y] = [T ]T[X] [T ] =
2 4
2
Y1 0 0
0 2 Y2 0
0 0 2 Y3
3
5 ; (18) fYg = [T ]TfXg: (19)
where [Y] and fYg are covariance matrix and mean
vector of variables fY g, respectively. Superscript T denotes transpose. Transformation matrix consists of the eigenvectors corresponding to eigenvalues and is calculated based on:
[T ] = [X] [I]: (20)
While sample values of variables fY g are obtained, main-values fXg, is calculated based on the transfor-mation (Eq. (15)).
6. Sample structure
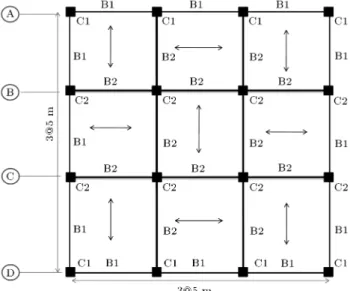
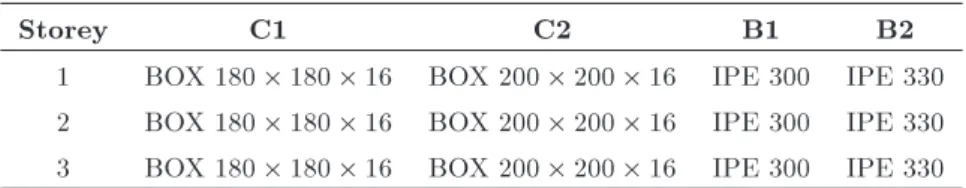
To evaluate the proposed method, one 3-storey steel moment resisting frames in two ways is considered (Figure 5). The structure is designed based on Iranian Seismic Code 2800 [38]. The soil type is considered as type B. The story height and bay width are assumed to be 3.2 and 5 meters, respectively. A rigid diaphragm is supposed based on usual oor systems existing in common structures. The value of response modication factor is considered as R = 10, adopted from [38], corresponding to special moment resisting structures. The designed member sections are depicted in Table 1. Non-structural and content vulnerability of the building is not considered in this research. Eects of
Table 1. Design sections for considered structure.
Storey C1 C2 B1 B2
1 BOX 180 180 16 BOX 200 200 16 IPE 300 IPE 330 2 BOX 180 180 16 BOX 200 200 16 IPE 300 IPE 330 3 BOX 180 180 16 BOX 200 200 16 IPE 300 IPE 330
construction quality and human errors in construction are not considered in deriving seismic fragility curves. The assumed structure is symmetric in plan and eleva-tion, which allows two dimensional structural analyses. To assess the proposed method, a two-dimensional frame (frame NO.B or NO.C) is considered. Mo-ment resisting connections are considered as rotational springs whose behaviors are based on modied Ibarra-Krawinkler model [9]. M2-WO panel zone model is considered since yielding in the beams, columns and panel zones is represented well by this model (Figure 6). Fundamental parameters which are considered as epistemic uncertainties in this study are p, pc and
. Estimation of modeling parameters, based on laboratory tests, is shown in Table 2. The correlation coecients of input variables depicted in this table were presented by Lignos [15].
The 5% linear elastic spectral acceleration at the rst-mode period of the structure is considered as intensity measure of strong ground motions. The advantage of this IM is that the seismic hazard data for Sa(T1) is available. Maximum inter-storey drift is
considered as EDP, since this EDP is the main source
Figure 6. Panel zone model M2-WO (Douglas et al., 2002 [40]).
of sideway instability which causes the sideway collapse of the structure [9]. A set of 40 strong ground motions according to Medina [39] entitled as LMSR records, is considered for investigation of global collapse limit state of the structure.
Covariance matrix of these input variables is: 1;2;3= 0:0407; 0:103; 0:3937;
[] = 2
40:691 0:69 0:441 0:67 0:44 0:67 1
3
5 : (21)
Three values of input parameters are considered corre-sponding to ; ; +. Considering the correlation between variables, the realization matrix of input variables is transformed by Eq. (15). The eigenvalues and transformation matrix for input variables are calculated based on Eq. (17).
The input variables considering the correlation are obtained according to:
2
4((PCP))11 ((PCP))22 ((PCP))33 ()1 ()2 ()3
3 5
= 2
40:0239 0:025 0:01610:0941 0:16 0:2721 0:6041 1:000 1:6555 3
5 : (22) The tree diagram of realizations for input variables is shown in Figure 7. Each branch of the tree shows a value for one of input variables. For each set of values, the IDA analysis of the building is done and collapse fragility curve is derived based on Eq. (2), considering Sa(T1) as intensity measure and maximum
inter-storey drift as engineering demand parameter. The sample IDA and collapse fragility curves are shown in Figures 8 and 9. Eqs. (21) and (22) show the function forms, and Table 3 shows the derived constant coecients based on nonlinear regression analysis. The geometric representation of response surfaces for mean and standard deviation of collapse capacity is shown
Table 2. Modeling parameters of mean and dispersion and correlation calibration based on experimental results (Lignos, 2008 [15]).
Median p (rad) p(rad) Median pc (rad) pc (rad) Median p;pc p; pc;
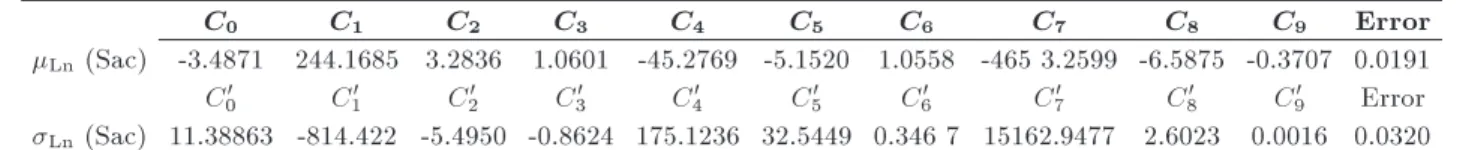
Table 3. Constant coecients of response surface functions for mean and standard deviation.
C0 C1 C2 C3 C4 C5 C6 C7 C8 C9 Error
Ln(Sac) -3.4871 244.1685 3.2836 1.0601 -45.2769 -5.1520 1.0558 -465 3.2599 -6.5875 -0.3707 0.0191
C0
0 C10 C20 C30 C40 C50 C60 C70 C80 C90 Error
Ln(Sac) 11.38863 -814.422 -5.4950 -0.8624 175.1236 32.5449 0.346 7 15162.9477 2.6023 0.0016 0.0320
Figure 7. Tree diagram for preassumed values of modelling parameters.
in Figure 10 in which x1 is p, x2 is pc and x3 is .
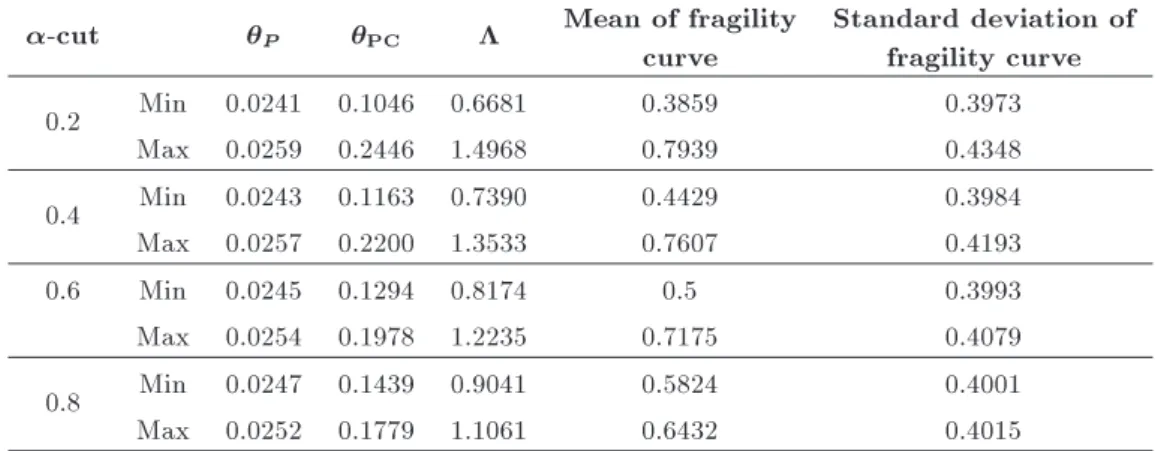
The response surface functions are used for estimation of minimum and maximum values of collapse fragility curve mean and standard deviation. Membership functions considered for modeling variables are shown in Figure 11. Four cases for -cut values are considered, = 0:2, 0.4, 0.6, 0.8. For values of , bounds of input variables are calculated. Maximum and minimum values for mean and standard deviation of collapse capacities are presented in Table 4. These values are
Figure 9. Sample IDA curves, and collapse fragility curves for 27 cases.
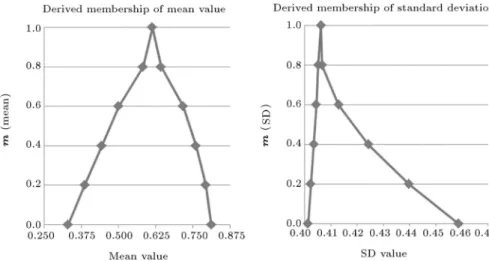
corresponding to -cut of moments of collapse fragility curves. The derived membership functions for mean and standard deviation of collapse capacity are shown in Figure 12 and fuzzy collapse fragility curves are presented in Figure 13. In Figures 14 and 15 the results of FOSM method, the proposed method and Monte Carlo simulation based on quadratic response surface are shown.
The perspective view of three-dimensional fragility curves resulted from fuzzy randomness method can be seen in Figure 13. In this gure, the
Table 4. Values of modeling and collapse fragility curves parameters for several values of -cuts.
-cut P PC Mean of fragility
curve
Standard deviation of fragility curve
0.2 Min 0.0241 0.1046 0.6681 0.3859 0.3973
Max 0.0259 0.2446 1.4968 0.7939 0.4348
0.4 Min 0.0243 0.1163 0.7390 0.4429 0.3984
Max 0.0257 0.2200 1.3533 0.7607 0.4193
0.6 Min 0.0245 0.1294 0.8174 0.5 0.3993
Max 0.0254 0.1978 1.2235 0.7175 0.4079
0.8 Min 0.0247 0.1439 0.9041 0.5824 0.4001
Max 0.0252 0.1779 1.1061 0.6432 0.4015
Figure 10. Response surface tted to calculated means and standard deviations.
Figure 11. Membership functions considered for modeling parameters.
probability of reaching or exceeding collapse capacity as a function of both IM and membership values of mean and standard deviation of collapse fragility curves are shown.
The membership function of achieved fuzzy mean and standard deviation show the variation of response
parameters due to uncertainty of modeling parameters. These membership functions may be interpreted as eects of epistemic uncertainties of modeling param-eters on response paramparam-eters. These eects both make changes to mean and standard deviation of collapse fragility curves. To compare the proposed method with
Figure 12. Fuzzy results for mean and standard deviation of collapse capacity.
Figure 13. Fuzzy collapse fragility curves; mean and SD membership value spectrum.
other probabilistic methods, defuzzication of fuzzy parameters is implemented by Eq. (16). Comparison of achieved collapse fragility curves, applying various methods, is shown in Figures 14 and 15. Further application of proposed method is to consider eects of parameters which cannot be presented by probability distributions such as human errors and construction quality.
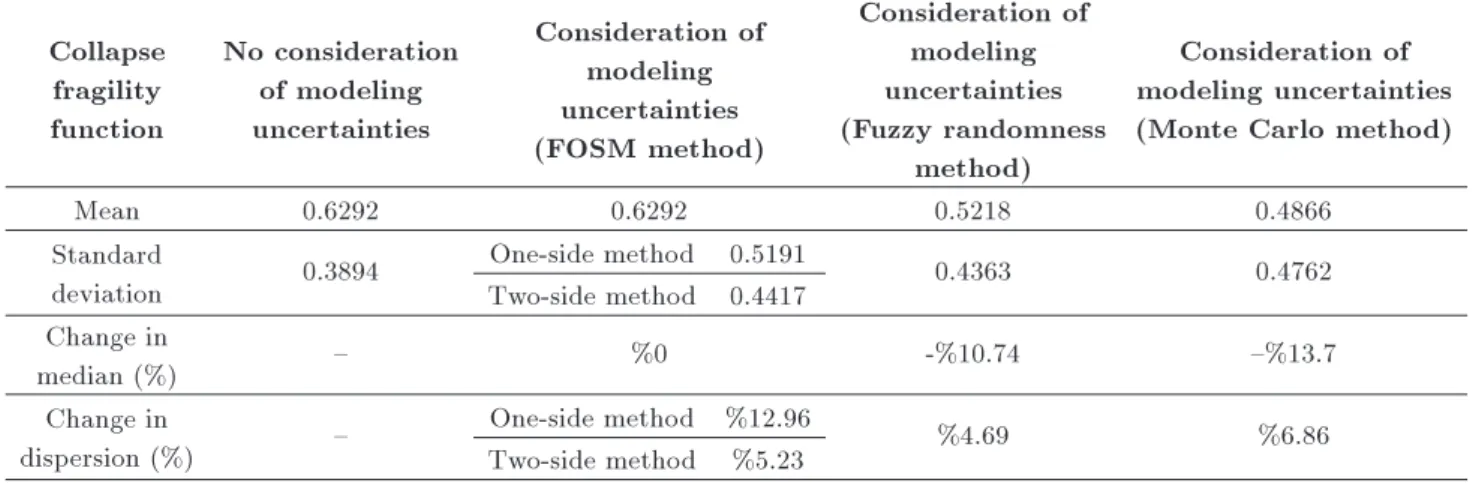
Appling FOSM approximation results in change in standard deviation of collapse fragility curves com-pared with fragility curve neglecting modeling uncer-tainties. The mean value does not change applying FOSM approximation. As shown in Table 5, mean and standard deviation of collapse fragility curve of sample structure are 0.6292 and 0.3894, respectively. Application of FOSM method to involve modeling un-certainty remains mean value unchanged, and standard deviation is changed to 0.5191 and 0.4417, for one-side and two-side formulations presented by Eqs. (5) and (6), respectively.
Application of Monte Carlo simulation shows both mean and standard deviation values change,
Figure 14. Defuzzication results; comparison of methods.
Figure 15. Defuzzication results; fuzzy randomness method eciency.
involving eects of modeling uncertainties. As shown in Table 5, mean and standard deviation values are 0.4866 and 0.4762, utilizing Monte Carlo method, respectively. The proposed method, entitled as fuzzy randomness method, predicts changes in mean and standard de-viation values. Mean and standard dede-viation values are 0.5218 and 0.4363, respectively. Figures 14 and 15 show the eciency of the fuzzy randomness method. The proposed method shows good correlation to Monte
Table 5. Modeling uncertainty eects by FOSM, fuzzy randomness and Monte Carlo method on collapse fragility curves. Collapse
fragility function
No consideration of modeling uncertainties
Consideration of modeling uncertainties (FOSM method)
Consideration of modeling uncertainties (Fuzzy randomness
method)
Consideration of modeling uncertainties (Monte Carlo method)
Mean 0.6292 0.6292 0.5218 0.4866
Standard
deviation 0.3894
One-side method 0.5191 0.4363 0.4762
Two-side method 0.4417 Change in
median (%) { %0 -%10.74 {%13.7
Change in
dispersion (%) {
One-side method %12.96 %4.69 %6.86
Two-side method %5.23
Carlo simulation method as more accurate results in comparison with others, while this method takes much less computation eorts than Monte Carlo simulation method.
We nally have made use of the following rela-tionships:
Ln(Sac)=C0+ Ni=1Cixi+ Ni<jCijxixj
+ N
i=1Ciix2i = C0+ C1P+ C2PC
+ C3 + C4PPC+ C5P + C6PC
+ C7P2 + C82PC+ C92; (23)
Ln(Sac)=C00 + Ni=1Ci0xi+ Ni<jCij0 xixj
+ N
i=1Cii0x2i = C00 + C10P + C20PC
+ C0
3 + C40PPC+ C50P + C60PC
+ C0
72P+ C80PC2 + C902: (24)
7. Conclusion
In this paper, fuzzy randomness formulation is pre-sented to involve modeling uncertainties eects on collapse fragility curves. The eciency of the proposed method compared with other existing approaches re-spected to Monte Carlo simulation results. It is also noteworthy that the proposed method keeps accurate results, regardless of much less computation eorts in comparison with Monte Carlo simulation method. Involvement of modeling uncertainties decreases mean value and increases the standard deviation value, as shown applying probabilistic-based methods. To this end, collapse fragility curves of special moment resist-ing frame are derived through FOSM, Monte Carlo and fuzzy randomness methods. Moment-rotation modeling parameters of connections, entitled as p, pc
and are considered as epistemic uncertainties. The eects of epistemic uncertainties, on collapse fragility curves, are evaluated by aforementioned methods. One of the more advantages of the proposed method is that the possibility of involving eects of parameters cannot be presented by probability distributions, or expressed descriptively, such as construction quality and human errors.
References
1. ATC-58-1. \Guidelines for seismic performance assess-ment of buildings", Volume 1- Methodology, avail-able from: https://www.atcouncil.org/Projects/atc-58-project.html (2012).
2. Deierlein, G.G. \Overview of a comprehensive frame-work for earthquake performance assessment", Inter-national Workshop on Performance-Based Seismic De-sign Concepts and Implementation: Bled, Slovenia. p. 12, available from: http://peer.berkeley.edu/Products /PEERReports/reports-2004/reports04.html (2004). 3. Vamvatsikos, D. and Cornell, C.A. \Incremental
dy-namic analysis", Earthquake Engineering and Struc-tural Dynamics, 31(3), pp. 491-514 (2002).
4. Baker, J.W. and Cornell, C.A. \A vector-valued ground motion intensity measure consisting of spectral acceleration and epsilon", Earthquake Engr. & Struc-tural Dynamics, 34(10), pp. 1193-1217 (2005). 5. Liel, A.B., Haselton, C.B., Deierlein, G.G. and Baker,
J.W. \Incorporating modeling uncertainties in the assessment of seismic collapse risk of buildings", Struc-tural Safety, 31, pp. 197-211 (2009).
6. Cornell, C.A. and Krawinkler, H. \Progress and challenges in seismic performance assessment", PEER Center News, http://peer.berkeley.edu/news /2000spring/performance.html (2000).
7. Zareian, F., Krawinkler, H., Ibarra, L. and Lignos, D. \Basic concepts and performance measures in predic-tion of collapse of buildings under earthquake ground motions", Struct. Design Tall Spec. Build., 19, pp. 167-181 (2010).
8. DerKiureghian, A. and Ditlevsen, O. \Aleatory or epistemic? Does it matter?", Structural Safety, DOI: 10.1016/j.strusafe.2008.06.020 (2008).
9. Ibarra, L.F. and Krawinkler, H. \Global collapse of frame structures under seismic excitations", Report No. 152, Pacic Earthquake Engineering Research Center, University of California at Berkeley, Berkeley, California (2005).
10. Krawinkler, H., Zareian, F, Dimitrios, G., Lignos, and Ibarra, F. \Prediction of collapse of structures under earthquake excitations", ECCOMAS Thematic Con-ference on Computational Methods in Structural Dy-namics and Earthquake Engineering., Rhodes, Greece (2009).
11. FEMA., \Pre-standard and commentary for the seis-mic rehabilitation of buildings", FEMA 356, Wash-ington, D.C., Federal Emergency Management Agency (2000).
12. Zareian, F., Lignos, D.G. and Krawinkler, H. \Quan-tication of modeling uncertainties for collapse assess-ment of structural systems under seismic excitations", ECCOMAS Thematic Conference on Computational Methods in Structural Dynamics and Earthquake En-gineering, Rhodes, Greece (2009).
13. Zadeh, L.A. \Fuzzy sets", Information Control, 8, pp. 338-353 (1965).
14. Celikyilmaz, A. and Burhan Turksen, I., Modeling Uncertainty with Fuzzy Logic, Springer-Verlag, Berlin Heidelberg (2009).
15. Lignos, D. \Sideway collapse of deteriorating struc-tural systems under seismic excitations", PhD Dis-sertation, Department of Civil Engineering, Stanford University (2008).
16. Moller, B., Graf, W. and Beer, M. \Fuzzy structural analysis using -level optimization computational me-chanics", 26(6), pp. 547-565 (2000).
17. Karimi, I. \Risk management of natural disasters: A fuzzy-probabilistic methodology and its applica-tion to seismic hazard", PhD dissertaapplica-tion, Depart-ment of Civil and EnvironDepart-mental Engineering, Univer-sitatsbibliothek (2006).
18. Moller, B. and Beer, M., Fuzzy Randomness: Uncer-tainty in Civil Engineering and Computational Me-chanics, Springer, Berlin, New York (2004).
19. Phani, R., Adduri Ravi, C. and Penmetsa, M. \Sys-tem reliability analysis for mixed uncertain variables", Structural Safety, 31, pp. 375-382 (2009).
20. Esteva, L. and Ruiz, S.E. \Seismic failure rates of multistory frames", J. Struct. Eng., 115(2), pp. 268-83 (1989).
21. Porter, K.A., Beck, J.L. and Shaikhutdinov, R.V. \Sensitivity of building loss estimates to major un-certain variables", Earthq Spectra, 18(4), pp. 719-743 (2002).
22. Ibarra, L.F., Medina, R.A. and Krawinkler, H. \Hys-teretic models that incorporate strength and stiness
deterioration", Earthquake Engineering and Structural Dynamics, 34(12), pp. 1489-1511 (2005).
23. Aslani, H. \Probabilistic earthquake loss estimation and loss disaggregation in buildings", PhD Thesis, Stanford University (2005).
24. Helton, J.C. and, Davis, F.J., Latin Hypercube Sam-pling and the Propagation of Uncertainty in Analyses of Complex Systems, Sandia National Laboratories, pp. 75-95 (2001).
25. Rubinstein, R.Y., Simulation and the Monte Carlo Method, New York, John Wiley and Sons (1981). 26. Porter, K.A., Cornell, C.A. and Baker, J.
\Propaga-tion of uncertainties from IM to DV", In: Krawinkler H. Editor Van Nuys Hotel Building Test Bed Report: Exercising Seismic Performance Assessment, Pacic Earthquake Engineering Research Center (2005). 27. Zhang, J. and Ellingwood, B. \Eects of uncertain
material properties on structural stability", J. Struct. Eng., 121(4), pp. 705-16 (1995).
28. Benjamin, J.R. and Cornell, C.A., Probability, Statis-tics and Decision for Civil Engineers, New York, McGraw-Hill (1970).
29. Ellingwood, B. \Quantifying and communicating un-certainty in seismic risk assessment", Structural Safety, 31, pp. 179-18 (2009).
30. Cornell, C.A., Jalayer, F., Hamburger, R. and Foutch, D.A. \Probabilistic basis for 2000 SAC federal emer-gency management aemer-gency steel moment frame guide-lines", J. Struct. Eng., 128(4), pp. 526-533 (2002). 31. Rahnama, M. and Krawinkler, H. \Eects of soft soil
and hysteresis model on seismic demands", Report No. 108, John A. Blume Earthquake Engineering Center, Department of Civil Engineering, Stanford University, Stanford, CA (1993).
32. Sivaselvan, M.V. and Reinhorn, A.M. \Lagrangian approach to structural collapse simulation", ASCE /Journal of Engineering Mechanics, 132(8), pp. 795-805 (2006).
33. Song, J.K. and Pincheira, J.A. \Spectral displacement demands of stiness and strength degrading systems", Earthquake Spectra, 16(4), pp. 817-851 (2000). 34. Zareian, F. and Krawinkler, H. \Simplied
perfor-mance based earthquake engineering", Report No. 169, The John A. Blume Earthquake engineering center, (2009).
35. Rao, S.S. and Berke, L. \Analysis of uncertain structural systems using interval analysis:, 37th AIAA/ASME/ASCE/AHS/ASC Structures", Struc-tural Dynamics, and Materials Conference: A Collec-tion of Technical Papers, Salt Lake City, Utah (1996). 36. Buckley, J.J. and Eslami, E. \Uncertain probabilities II: The continuous case", Soft Computing, 8, pp. 193-199 (2004).
37. Nowak, A.S. and Collins, K.R., Reliability of Struc-tures, New York, McGraw Hill (2000).
38. Iranian code of practice for seismic resistant design of buildings, Standard No. 2800, 3rd Edition, Building and Housing Research Center (2004).
39. Medina, R. \Seismic demands for nondeteriorating frame structures and their dependence on ground motions", PhD Dissertation, Department of Civil En-gineering, Stanford University (2002).
40. Foutch, D.A. and Yun, S.Y. \Modeling of steel moment frames for seismic loads", Journal of Constructional Steel Research, 58(5), pp. 529-564 (2002)
Biographies
Mohammad R. Zolfaghari is an Associate Professor of Civil Engineering at the KN Toosi University of Technology. He received his BSc in Civil Engineering, MSc in Geotechnical Engineering, and PhD in Earth-quake Engineering from Imperial College of London. Prior to Joining KNTU, he had been working for six years as a senior project manager at EQECAT and for ve years as a catastrophe modeler at Applied Insurance Research Inc (AIR). Dr. Zolfaghari has more than 23 years of experience in natural catastrophe and in particular earthquake hazard and risk modeling. He has developed earthquake risk models for more than 55 countries in Europe, Asia, Africa, Middle East and Latin America and also been involved in many other ood and hurricane models for Europe and Asia. He has been working at KNTU for more than 9 years.
Seyed Bahram Beheshti Aval is an Associate
Pro-fessor of Civil Engineering at the KN Toosi University of Technology. He received his PhD degree from the Sharif University of Technology (SUT) in 1999. He spent one year as post-doctoral student at North Carolina State University in USA. Before he joined the faculty of civil engineering at KN Toosi University of Technology in 2006 where he has served as research and development deputy (2006-2012), he commenced his career at Shahid Beheshti University in 2002. He is responsible for teaching courses in design of reinforced concrete structures, energy methods in nite element analysis, seismic rehabilitation of existing buildings, structural reliability, and probabilistic seismic analysis of structures. His research activities have included studies of seismic reliability analysis of structures, composite structures, and various problems in seismic design of structures. He has authored more than 50 published papers and two textbooks entitled Energy Principles and Variational Methods in Finite Element Analysis and Seismic Rehabilitation of Existing Build-ings.
Ehsan Khojastehfar was born in 1981. He ob-tained his BS degree in Civil Engineering from Shahid Bahonar University of Kerman, Iran, in 2004, and MSc degree in Earthquake Engineering from KN Toosi University of technology, Tehran, Iran in 2006. He is currently a PhD candidate in Structural Engineer-ing of KN Toosi University of technology, Tehran, Iran. His research interests include Performance-based Earthquake Engineering, Consequence-Performance-based Earthquake Engineering, and Seismic Risk Analy-sis.