Neurosensory Assessments of Concussion
Mark Tommerdahl, PhD*
†
; Robert G. Dennis, PhD*
†
; Eric M. Francisco, PhD
†
;
Jameson K. Holden, PhD
†
; Richard Nguyen, PhD
†
; Oleg V. Favorov, PhD*
ABSTRACT The purpose of this research was to determine if cortical metrics—a unique set of sensory-based assess-ment tools—could be used to characterize and differentiate concussed individuals from nonconcussed individuals. Corti-cal metrics take advantage of the somatotopic relationship between skin and cortex, and the protocols are designed to evoke interactions between adjacent cortical regions to investigate fundamental mechanisms that mediate cortical–cortical interactions. Student athletes, aged 18 to 22 years, were recruited into the study through an athletic training center that made determinations of postconcussion return-to-play status. Sensory-based performance tasks utilizing vibrotactile stimuli applied to tips of the index and middlefingers were administered to test an individual’s amplitude discrimination, tempo-ral order judgment, and duration discrimination capacity in the presence and absence of illusion-inducing conditioning stimuli. Comparison of the performances in the presence and absence of conditioning stimuli demonstrated differences between concussed and nonconcussed individuals. Additionally, mathematically combining results from the measures yields a unique central nervous system (CNS) profile that describes an individual’s information processing capacity. A comparison was made of CNS profiles of concussed vs. nonconcussed individuals and demonstrated with 99% confidence that the two populations are statistically distinct. The study established solid proof-of-concept that cortical metrics have significant potential as a quantitative biomarker of CNS status.
INTRODUCTION
Currently, there is no standard, reliable, cost-effective para-digm or methodology for assessing the degree to which the central nervous system (CNS) is impacted by neurological disorders. One of these disorders or systemic central alter-ations due to trauma is concussion, or mild traumatic brain injury (mTBI). Although awareness of concussion and mTBI is significantly growing in the general public, there is still no standardized, quantitative, biologically based methodology that is effective for assessing the impact of mild neuro-trauma. Current existing methods and products for this need are expen-sive, extremely slow, and in many cases fail to definitively and quantitatively diagnose the problem. For example, medi-cal imaging technologies—though they are able to discern differences in subjects with traumatic brain injury —show few or no differences for mTBI or concussion, are costly (about $1K per scan), are not portable, and are not practical for getting a quick assessment. No modern medical imag-ing techniques are as sensitive to subtle alterations in cortical information processing as those detected by sensory percept. While it is unlikely that there will be any medical imaging technologies able to provide such high resolution in the near future, it is even more improbable that such a technology could be widely distributed.
One of the greatest issues with concussion, or mTBI, is determination of to-duty status for the military or return-to-play status for athletes at multiple levels of competition
(secondary school, college/university, and professional level). Because injury from secondary concussions can be much more serious, if not fatal, during the critical postconcussion recovery period, it is imperative that methods for this determination be developed. Several years ago, we proposed to design and fab-ricate a noninvasive, portable, sensory-based diagnostic system using state-of-the-art technology to investigate cortical informa-tion processing. Sensory perceptual protocols were designed based on ourfindings from in vivo studies of cerebral cortical dynamics in nonhuman primates (and thus called cortical dynamic metrics or “cortical metrics”). These proved suc-cessful in that a number of specific protocols appeared to be very sensitive to detecting differences between subjects with compromised neurological conditions and healthy controls. Multiple proof-of-concept studies have independently dem-onstrated that a number of these newly developed metrics are sensitive to systemic cortical alterations.1–16
The somatosensory system is uniquely suited for the design of a diagnostic system for overall cortical health for a number of reasons. First, the somatotopic organization of the somatosensory system provides an ideal template for evoking cortical–cortical interactions in adjacent or near-adjacent cortical regions. Second, ambient environmental noise in the system can be easily controlled (i.e., it is less likely that a patient will be exposed to distracting tactile input than auditory or visual input). Third, the somatosensory system is the only sensory system that is highly integrated with the pain system, and this is often an important aspect of a patient’s diagnosis. Fourth, a key concept in the model is that alter-ations in sensory percept occur in parallel with alteralter-ations in systemic cortical alterations, and “sampling”from the center of the brain (where the somatosensory cortex is located) is more analogous to obtaining a noninvasive biopsy of the cerebral cortex than any other sensory modality.
*Department of Biomedical Engineering, University of North Carolina at Chapel Hill, CB No. 7575, Chapel Hill, NC 27599.
†Cortical Metrics, LLC, 87 Possum Trot, Semora, NC 27343.
This work was presented at the 2014 Military Health System Research Symposium, Fort Lauderdale, FL, August 20, 2014.
In this study, we obtained cortical metrics from both con-cussed and nonconcon-cussed individuals, and subsequently, com-parisons of the results were obtained that demonstrated that concussion had impacted the metrics significantly.
METHODS
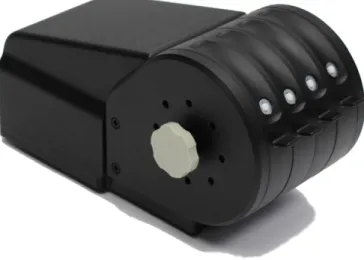
A portable, noninvasive tactile stimulator was designed and fabricated to deliver stimuli to adjacentfinger tips (previously described in Holden et al17[Fig. 1]). Taking advantage of the somatotopic relationship between skin and cortex, biologi-cally based hypothesis-driven protocols were designed to evoke interactions between adjacent cortical regions and inves-tigate fundamental mechanistic changes that occur in cortical– cortical interactions. The measured changes in sensory percept can be easily and rapidly obtained (1 to 3 minutes per test) in a manner similar to reading an eye chart, and the battery of tests described below takes approximately 20 minutes to administer. In this report, we describe three sets of paired metrics, which are relatively simple sensory perceptual mea-sures obtained in the presence and absence of a conditioning stimulus. Because the conditioning stimuli result in healthy controls performing worse, we define these conditioning stimuli as confounding or illusion-inducing. Descriptions of the paired tests administered are described in the section below after the general procedure section.
Subjects
Data were collected from 89 college students (67 male, 22 female, mean age = 20.1 years, and SD = 1.2 years), of which 31 experienced a sports-related concussion (15 played football, 7 basketball, 7 soccer, and 2 lacrosse). All concussed athletes were diagnosed with mTBI in the form of a con-cussion by a certified athletic trainer and the team physician with the help of the Sport Concussion Assessment Tool 2
(SCAT-2) and had no prior history of concussion or any other diagnosed medical conditions. The assessments reported were obtained in 1 to 3 days postconcussion. The experimental pro-cedures were reviewed and approved in advance by an institu-tional review board.
General Procedure
During the experimental session, the subjects were situated with the left arm on an armrest attached to the head unit of a portable four-site vibrotactile stimulator. Mechanical stimula-tion was applied on the glabrous tips of the second (index, D2) and/or the third (middle, D3)fingers of the left hand. An auto-mated procedure guided subjects through a series of questions (answered via computer mouse) related to what the sub-jects perceived on D2 and D3. In each of the procedures described below, a simple tracking procedure that utilized a two-alternative forced choice (2AFC) paradigm was used to determine an individual’s difference limen (DL). The tracking procedures for each of the protocols queried the individual as to which of two stimuli were larger (amplitude discrimina-tion), which of two stimuli camefirst (temporal order judgment [TOJ]), or which of two stimuli lasted longer (duration dis-crimination), and differences between the two stimuli deliv-ered were made smaller when subjects answdeliv-ered correctly.
Visual cueing was provided via a computer monitor during the experimental runs. Specifically, an on-screen light panel indicated when the subject was to respond. An audiometer was used to make sure that no auditory cues were emitted from the stimulator during delivery of the stimuli. Practice trials were performed before each test to allow the subjects to become familiar with the test, and correct responses on three consecutive training trials were required before com-mencing with the data acquisition portion of the test. The subject was not given performance feedback or knowledge of the results during data acquisition.
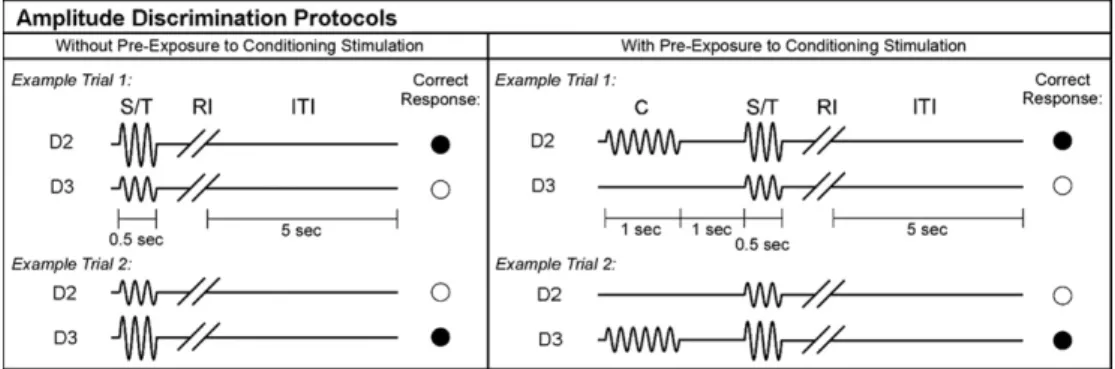
Paired Cortical Metrics No. 1: Amplitude Discrimination Capacity in the Presence and Absence of Confounding Conditioning Stimuli
Baseline Metric
Amplitude discriminative capacity is defined as the minimal difference in amplitudes of two mechanical sinusoidal vibra-tory stimuli at which an individual can successfully identify the stimulus of larger magnitude. Two stimuli were delivered simultaneously to D2 and D3, and discrimination capacity was assessed using a previously described 2AFC tracking protocol.1,11,12,14–16,18,19 The standard stimulus was set at 200 μm and the test stimulus was initially 400 μm. This dif-ference was subsequently decreased or increased as a result of subject response (decreased for correct answers and increased for incorrect responses). Which of the twofingers received the standard stimulus and which finger received the test stimulus was chosen randomly on each trial.
Illusory Conditioning
The amplitude discrimination procedure described above was repeated in the presence of a vibrotactile conditioning stimu-lus delivered 1 second before the presentation of the pair of tests and standard stimuli (Fig. 2). The result of such a protocol modification is that the DL is typically signifi -cantly elevated due to a healthy subject’s ability to adapt to the stimulus.1,7,10,11,14,16
Paired Cortical Metrics No. 2: TOJ in the Presence and Absence of Confounding Stimulation
Baseline Test
To evaluate TOJ, two sequential taps were delivered, one to each digit tip, with an initial interstimulus interval of 150 ms. The interstimulus interval was subsequently reduced as a result of subject response as defined by a 2AFC protocol. The finger that received the first of the two pulses was chosen randomly on each trial. Subjects were queried as to whichfinger was tappedfirst.
Illusion-inducing Conditioning
TOJ was assessed in the presence of simultaneously deliv-ered synchronized 25 Hz conditioning stimulation before the TOJ task. In healthy controls, this synchronized conditioning typically significantly impacts TOJ, but it does not impact TOJ in some neurologically compromised individuals.3,13,20
Paired Cortical Metrics No. 3: Duration Discrimination Capacity in the Presence and Absence of an Illusory Confound
Baseline Metric
Duration discriminative capacity is the minimal difference in durations of two stimuli at which an individual can suc-cessfully identify the stimulus of larger duration. Sequen-tial stimuli were delivered to D2 and D3. Discrimination capacity was assessed using a 2AFC tracking protocol, and subjects were queried as to which of the two digits received the longer stimulus duration. The standard stimulus lasted 500 ms and the initial test stimulus lasted 750 ms. Thefinger
and order of the stimuli were chosen at random on each trial. The duration of the test stimulus was reduced when subject responses were correct and increased when responses were incorrect.
Illusion-Inducing Confound
Duration discrimination capacity was assessed in the presence of an increased standard amplitude. Increasing the ampli-tude results in a neurophysiological response that is longer in duration21,22and would predictably make it more difficult for healthy controls to correctly discriminate duration.
Data Analysis
Statistical significance of the difference of the means between the concussed and healthy control samples was assessed sepa-rately for each of the six cortical metrics using a pairedttest. In addition, using the approach of quantitative sensory testing—which treats the performance of a human subject on a battery of psychophysical tests as a multidimensional
“sensory profile” of that subject, potentially reflecting the functional status of his/her CNS23,24—quantitative performance of each subject in this study on six cortical metrics tests was treated as the“CNS profile”of that subject, localizing him/her in a 6-dimensional cortical metrics space. The cortical metrics space is an abstract space in which each coordinate axis corre-sponds to one of the cortical metrics. Since different metrics vary on different scales, to make different axes of the cortical metrics space comparable to each other, each metric contrib-uting to the CNS profile was autoscaled by subtracting its mean (measured over the entire studied subject population) and dividing by its standard deviation. Hotelling’s T-squared test of the difference between the multivariate means of dif-ferent populations25 was used to compute the statistical sig-nificance of the difference in the locations in the cortical metrics space of the centers of the concussed and healthy control samples. Finally, to graphically visualize the spatial relationship between the clusterings of the concussed and healthy control subjects in the cortical metrics space, the 6-dimensional space and all the subject-representing data points in it were projected, using the Partial Least Squares Discriminant Analysis
(PLS-DA) algorithm,26onto a 2-dimensional plane oriented such as to maximize the separation between the concussed and healthy control distributions.
RESULTS
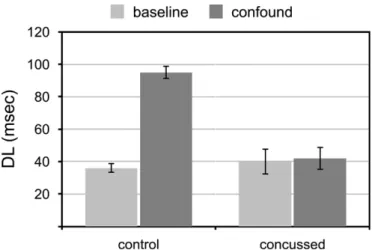
Paired Cortical Metrics No. 1: Amplitude Discrimination Capacity in the Presence and Absence of Confounding Conditioning Stimuli Demonstrates That Concussed Individuals Adapt Less Than Nonconcussed Individuals
Control data were consistent with amplitude discriminative capacity measures that previously demonstrated robustness across the age spectrum.16 Figure 3 shows that concussed subjects performed worse on the amplitude discrimination task than did healthy controls (DL of controls 30.1 ± 1.3μm vs. concussed 42.1 ± 5.9μm for a 200μm standard).
With the addition of a confounding conditioning stimulus, amplitude discriminative capacity is typically worse across the age spectrum16 and the results in Figure 3 are consistent with that previous finding for control values (DL increased from 30.1 ± 1.3 μm to 63 ± 2.2 μm with confound). How-ever, concussed subjects did not perform significantly differ-ently postconditioning (DL increased from 42.1 ± 5.9 μm to 46 ± 5.4μm).
Paired Cortical Metrics No. 2
Typically, healthy individuals have a TOJ capacity on the order of 30 to 40 ms, and in the presence of an illusory con-ditioning stimulus healthy controls perform significantly worse on the same TOJ task.13,20 Figure 4 shows that healthy control data in this study are consistent with that finding (DL increases from 36.4 ± 2.8 ms to 95.2 ± 4.3 ms), and concussed subjects do not appear to deviate significantly
from healthy controls on the baseline TOJ metric. However, concussed subjects did not perform worse in the presence of the “illusion-inducing confound” (DL for concussed subjects was 40.1 ± 7.6 ms without conditioning vs. 42.5 ± 7.3 ms with conditioning).
Paired Cortical Metrics No. 3
Comparison of healthy controls and concussed subjects (Fig. 5) suggests that while there is little or no difference between duration discriminative capacity of the two subject groups (DL for controls 64.6 ± 3.7 ms vs. 75.2 ± 5.4 ms for con-cussed individuals), the discriminative capacity of healthy controls is impacted by the illusion-inducing confound (DL for controls increased to 124.7 ± 15.2 ms) while the confound does not appear to impact the discriminative
FIGURE 3. Amplitude discriminative capacity in absence (baseline) and presence (confound) of an illusory conditioning stimulus. Performance decreases significantly with the confound in controls (t(57) = 3.74,p< 0.0005) but is not impacted by the confound in concussed subjects (t(30) = 0.19,
p= 0.85).
FIGURE 4. Temporal order judgment in absence (baseline) and presence (confound) of an illusory conditioning stimulus. Performance decreases significantly (t(57) = 3.53, p < 0.001) with the confound in controls but is not impacted by the confound in concussed subjects (t(30) = 0.05,
p= 0.96).
capacity of concussed subjects significantly (DL increased to 77.7 ± 10.3 ms).
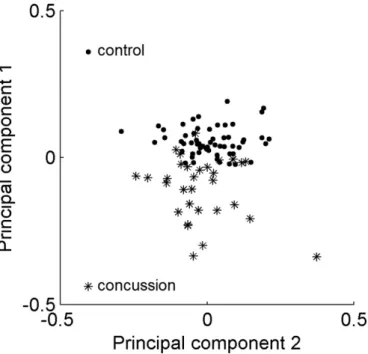
Multivariate Analysis Demonstrates Different Profiles for Concussed vs. Nonconcussed Individuals
Treating the performance of any given subject on multiple cortical metrics tests as a multidimensional metrics vector (or CNS profile) in an abstract space, each axis of which corre-sponds to one of the test metrics, we can compare the spatial distributions of such vectors in the concussed vs. healthy con-trol groups. To visualize these two group distributions, they were projected onto a 2-dimensional plane, shown in Figure 6, using PLS-DA algorithm. In Figure 6, control individuals are shown as black dots and concussed individuals are shown as asterisks, revealing that these two groups form distinct, only partially overlapping clusters. While a few concussed individ-uals are mixed in among the control individindivid-uals—thus indi-cating that their performance on the cortical metrics tests was indistinguishable, as a whole, from the control population— the majority of concussed subjects were clearly displaced rela-tive to the control distribution. Hotelling’s T-squared statistic indicates with greater than 99% confidence that these two populations have different centers.
Figure 7 suggests that the distance between the perfor-mance vector of a given individual and the center of the healthy control distribution might be indicative of the con-cussion impact. The plot in Figure 7 was constructed by com-puting the average concussion symptom score SCAT-2 for 9 different subsets of concussed subjects, each subset farther away from the center of the control distribution. This plot
shows that concussed subjects with more distant performance vectors tended to have higher SCAT-2 scores.
DISCUSSION
For the past several years, we have been developing proto-cols that utilize illusion-inducing confounds that alter the perception of a sensory stimulus. For example, delivery of a repetitive vibrotactile conditioning stimulus to one of two skin sites before an amplitude discrimination task results in degradation of performance in healthy controls.10,11,14–16 However, a number of neurologically compromised subjects have demonstrated that this conditioning stimulus—or the illusion-inducing confound—does not impact their perfor-mance. In other words, some subject populations (e.g., indi-viduals with autism, alcoholism, multiple types of chronic pain, and concussion) do not adapt to the conditioning stimu-lus, and because the illusion-inducing conditioning stimulus has little or no impact, they actually “outperform” healthy controls on the postconditioning amplitude discriminative task.1,11,16 Another example of an illusion-inducing condi-tioning stimulus is one in which healthy controls perform worse (but neurologically compromised subjects do not) on a TOJ task in the presence of synchronized, but not asynchronized, conditioning stimuli.12,13Duration discrimi-nation, or the ability to accurately determine which of two stimuli has a longer temporal duration, is impacted in an illusory manner by increasing the intensity of one of the stimuli. This illusory condition apparently has less of an impact on individuals who are concussed.
It should be emphasized that the measures described in this report do not simply reflect alterations in tactile percep-tion, but rather differences in cortical information processing capacity. The lack of a difference in amplitude discrimination FIGURE 6. PLS-DA plot of locations of the concussed (asterisks) and
healthy control (black dots) subjects in the cortical metrics space.
with vs. without the illusion-inducing confound reflects a systemic cortical alteration and a decrease in the individual’s capacity to adapt. In other words, plasticity has been reduced, and the alteration in the somatosensory-based task is a refl ec-tion of a systemic cortical alteraec-tion. The lack of a change in the TOJ metric in the presence of the confound also reflects a systemic cortical alteration—cortical ensembles are no longer coordinated in their response to the tactile conditioning, and the TOJ cortical metric reflects an alteration in functional connectivity. Similarly, the lack of an impact of the confound on duration discrimination reflects a systemic alteration in neuron-glial interactions, possibly due to neuroinflammation that occurs with concussion.
The potential utility of this work is highly significant. A simple, fast, noninvasive, and cost-effective means for assess-ing the impact of concussion on CNS health that could be utilized by health care providers would have a far-reaching impact. To date, there are no standardized, quantitative mea-sures that are biologically based for assessing concussion. The advantage of the proposed methodology is that it will be low-cost, easy to use, and effective at both providing infor-mation about a patient that would enable a diagnostician to make a more informed decision about diagnosis or treatment, and providing a means for assessing treatment efficacy.
ACKNOWLEDGMENT
This work was partially supported by the Office of Naval Research and through an award made to Cortical Metrics, LLC as one of the winners of the General Electric Company/National Football League Head Health Challenge.
REFERENCES
1. Folger SE, Tannan V, Zhang Z, Holden JK, Tommerdahl M: Effects of the N-methyl-D-aspartate receptor antagonist dextromethorphan on vibrotactile adaptation. BMC Neurosci 2008; 9: 87.
2. Francisco E, Holden J, Zhang Z, Favorov O, Tommerdahl M: Rate dependency of vibrotactile stimulus modulation. Brain Res 2011; 1415: 76–83.
3. Lee K, Jacobs MF, Asmussen MJ, Zapallow CM, Tommerdahl M, Nelson AJ: Continuous theta-burst stimulation modulates tactile syn-chronization. BMC Neurosci 2013; 14: 89.
4. Nelson A, Premji A, Rai N, Hoque T, Tommerdahl M, Chen R: Dopamine alters tactile perception in Parkinson’s disease. Can J Neurol Sci 2012; 39: 52–7.
5. Nguyen R, Ford S, Calhoun AH, Holden J, Gracely RH, Tommerdahl M: Neurosensory assessments of migraine. Brain Res 2013; 1498: 50–8.
6. Nguyen R, Forshey T, Holden J, et al: Vibrotactile discriminative capacity is impacted in a digit-specific manner with concurrent unattended hand stimulation. Exp Brain Res 2014; 232(11): 3601–12.
7. Puts NA, Edden RA, Wodka EL, Mostofsky SH, Tommerdahl M: A vibrotactile behavioral battery for investigating somatosensory process-ing in children and adults. J Neurosci Methods 2013; 218: 39–47. 8. Puts N, Wodka E, Tommerdahl M, Mostofsky S, Edden R: Impaired
tac-tile processing in children with autism spectrum disorder. J Neurophysiol 2014; 111: 1803–11.
9. Tannan V, Whitsel BL, Tommerdahl M: Vibrotactile adaptation enhances spatial localization. Brain Res 2006; 1102: 109–16.
10. Tannan V, Simons S, Dennis RG, Tommerdahl M: Effects of adapta-tion on the capacity to differentiate simultaneously delivered dual-site vibrotactile stimuli. Brain Res 2007; 1186: 164–70.
11. Tannan V, Holden JK, Zhang Z, Baranek G, Tommerdahl M: Percep-tual metrics of individuals with autism provide evidence for disinhibition. Autism Res 2008; 1: 223–30.
12. Tommerdahl M, Tannan V, Cascio CJ, Baranek GT, Whitsel BL: Vibrotactile adaptation fails to enhance spatial localization in adults with autism. Brain Res 2007; 1154: 116–23.
13. Tommerdahl M, Tannan V, Holden JK, Baranek GT: Absence of stimulus-driven synchronization effects on sensory perception in autism: Evidence for local underconnectivity? Behav Brain Funct 2008; 4: 19. 14. Zhang Z, Francisco E, Holden JK, Dennis RG, Tommerdahl M: The
impact of non-noxious heat on tactile information processing. Brain Res 2009; 1302: 97–105.
15. Zhang Z, Zolnoun DA, Francisco EM, Holden JK, Dennis RG, Tommerdahl M: Altered central sensitization in subgroups of women with vulvodynia. Clin J Pain 2011; 27: 755–63.
16. Zhang Z, Francisco E, Holden JK, Dennis RG, Tommerdahl M: Sensory information processing in the aging population. Front Aging Neurosci 2011; 3: 18.
17. Holden JK, Nguyen RH, Francisco EM, Zhang Z, Dennis RG, Tommerdahl M: A novel device for the study of somatosensory infor-mation processing. J Neurosci Methods 2012; 204: 215–20.
18. Francisco E, Tannan V, Zhang Z, Holden J, Tommerdahl M: Vibrotactile amplitude discrimination capacity parallels magnitude changes in somato-sensory cortex and follows Weber’s Law. Exp Brain Res 2008; 191: 49–56.
19. Tannan V, Dennis RG, Zhang Z, Tommerdahl M: A portable tactile sensory diagnostic device. J Neurosci Methods 2007; 164: 131–8. 20. Tommerdahl M, Tannan V, Zachek M, Holden JK, Favorov OV: Effects
of stimulus-driven synchronization on sensory perception. Behav Brain Funct 2007; 3: 61.
21. Simons SB, Tannan V, Chiu J, Favorov OV, Whitsel BL, Tommerdahl M: Amplitude-dependency of response of SI cortex to flutter stimula-tion. BMC Neurosci 2005; 6: 43.
22. Simons SB, Chiu J, Favorov OV, Whitsel BL, Tommerdahl M: Duration-dependent response of SI to vibrotactile stimulation in squirrel mon-key. J Neurophysiol 2007; 97: 2121–9.
23. Rolke R, Baron R, Maier C, et al: Quantitative sensory testing in the German Research Network on Neuropathic Pain (DFNS): standardized protocol and reference values. Pain 2006; 123(3): 231–43.
24. Arning K, Baron R: Evaluation of symptom heterogeneity in neuropathic pain using assessments of sensory functions. Neurotherapeutics 2009; 6: 738–48.
25. Mardia KV, Kent JT, Bibby JM: Multivariate Analysis. San Diego, CA, Academic Press, 1980.