Quantitative Transcriptomics Reveals the Growth- and
Nutrient-Dependent Response of a Streamlined Marine Methylotroph to
Methanol and Naturally Occurring Dissolved Organic Matter
Scott M. Gifford,a,b Jamie W. Becker,bOscar A. Sosa,b,cDaniel J. Repeta,dEdward F. DeLongb,c
Department of Marine Sciences, University of North Carolina at Chapel Hill, Chapel Hill, North Carolina, USAa; Department of Civil and Environmental Engineering, Massachusetts Institute of Technology, Cambridge, Massachusetts, USAb; Daniel K. Inouye Center for Microbial Oceanography: Research and Education (C-MORE), University of Hawaii, Honolulu, Hawaii, USAc; Department of Marine Chemistry and Geochemistry, Woods Hole Oceanographic Institution, Woods Hole, Massachusetts, USAd
ABSTRACT The members of the OM43 clade ofBetaproteobacteriaare abundant coastal methylotrophs with a range of carbon-utilizing capabilities. However, their underlying transcriptional and metabolic responses to shifting conditions or different car-bon substrates remain poorly understood. We examined the transcriptional dynamics of OM43 isolate NB0046 subjected to vari-ous inorganic nutrient, vitamin, and carbon substrate regimes over different growth phases to (i) develop a quantitative model of its mRNA content; (ii) identify transcriptional markers of physiological activity, nutritional state, and carbon and energy utili-zation; and (iii) identify pathways involved in methanol or naturally occurring dissolved organic matter (DOM) metabolism. Quantitative transcriptomics, achieved through addition of internal RNA standards, allowed for analyses on a transcripts-per-cell scale. This streamlined bacterium exhibited substantial shifts in total mRNA content (ranging from 1,800 to 17 transcripts cellⴚ1in the exponential and deep stationary phases, respectively) and gene-specific transcript abundances (>1,000-fold
in-creases in some cases), depending on the growth phase and nutrient conditions. Carbon metabolism genes exhibited substantial dynamics, including those for ribulose monophosphate, tricarboxylic acid (TCA), and proteorhodopsin, as well as methanol dehydrogenase (xoxF), which, while always the most abundant transcript, increased from 5 to 120 transcripts cellⴚ1when
cul-tures were nutrient and vitamin amended. In the DOM treatment, upregulation of TCA cycle, methylcitrate cycle, vitamin, and organic phosphorus genes suggested a metabolic route for this complex mixture of carbon substrates. The genome-wide inven-tory of transcript abundances produced here provides insight into a streamlined marine bacterium’s regulation of carbon me-tabolism and energy flow, providing benchmarks for evaluating the activity of OM43 populationsin situ.
IMPORTANCE Bacteria exert a substantial influence on marine organic matter flux, yet the carbon components targeted by spe-cific bacterial groups, as well as how those groups’ metabolic activities change under different conditions, are not well under-stood. Gene expression studies of model organisms can identify these responses under defined conditions, which can then be compared to environmental transcriptomes to elucidatein situactivities. This integration, however, is limited by the data’s rela-tive nature. Here, we report the fully quantitarela-tive transcriptome of a marine bacterium, providing a genome-wide survey of cel-lular transcript abundances and how they change with different states of growth, nutrient conditions, and carbon substrates. The results revealed the dynamic metabolic strategies this methylotroph has for processing both simple one-carbon compounds and the complex multicarbon substrates of naturally derived marine organic matter and provide baseline quantitative data for identifying theirin situactivities and impact on the marine carbon cycle.
Received17 July 2016Accepted17 October 2016Published22 November 2016
CitationGifford SM, Becker JW, Sosa OA, Repeta DJ, DeLong EF. 2016. Quantitative transcriptomics reveals the growth- and nutrient-dependent response of a streamlined marine methylotroph to methanol and naturally occurring dissolved organic matter. mBio 7(6):e01279-16. doi:10.1128/mBio.01279-16.
Invited EditorFrank Stewart, Georgia Institute of TechnologyEditorColleen M. Cavanaugh, Harvard University
Copyright© 2016 Gifford et al. This is an open-access article distributed under the terms of theCreative Commons Attribution 4.0 International license. Address correspondence to Scott M. Gifford, [email protected], or Edward F. DeLong, [email protected].
M
icrobial activities are major drivers of nutrient cycles and energy transfer in marine ecosystems, and the ability to monitor these activitiesin situhas been enhanced by recently de-veloped genome-enabled technologies. An important application for these analyses is understanding how the numerous genes for processing carbon compounds in bacterial genomes are regulated in response to cell physiology and environmental conditions to ultimately influence carbon flux through marine environments. Focusing these omic analyses on model organisms that represent groups with specific carbon-processing capabilities should enableus to better predict how the diverse carbon pool in marine envi-ronments is metabolized by bacterioplankton communities and how those roles may change under different conditions.
One functional group of bacteria increasingly recognized as having an impact on the marine carbon cycle is the methyl-otrophs, microorganisms capable of metabolizing single-carbon substrates (1, 2). The presence of methylotrophs in the marine environment has been recognized for several decades owing to their enrichment and cultivation from seawater samples (3) and more recently in metagenomic surveys (4). Recent investigations
have further expanded the potential role of methylotrophs in the marine environment to include high-molecular-weight (HMW) dissolved organic matter (DOM) cycling (5) and phytoplankton-bacteria interactions (6). The sources of methanol supporting these populations in the marine environment are not well under-stood, but a recent study by Mincer and Aicher (7) showed that several marine phytoplankton taxa can release micromolar con-centrations of methanol. Additionally, analyses of methanol standing stocks in seawater has revealed nanomolar concentra-tions with short turnover times, suggesting that methylotrophs may have a substantial role in the flux of marine carbon (8–10).
In coastal environments, members of the OM43 clade of Beta-proteobacteriaof the familyMethylophilaceaehave emerged as im-portant marine methylotrophs. First identified by Rappé et al. (11), these organisms are a common component of coastal bacte-rial communities (12) and can substantially increase in relative abundance during phytoplankton blooms (13). The first OM43 genome sequences indicated the presence of highly streamlined genomes in this group (1.3 Mbp encoding 1,377 genes) and suggested that members of the clade might be obligate methyl-otrophs because of an incomplete tricarboxylic acid (TCA) cycle (14, 15). Halsey et al. (16) demonstrated that OM43 strains are not solely limited to methanol as a substrate, as they can metabolize a range of C1 compounds, including dimethylsulfoniopropionate and trimethylamine oxide. Furthermore, they found that the availability of these substrates shifted the metabolic fate of meth-anol toward either dissimilatory or assimilatory processes. OM43 isolates have recently been obtained from ultraoligotrophic envi-ronments (17), and a closely related sister clade has been isolated from freshwater environments (18), with both isolates also having streamlined genomes and a metabolic range similar to that of pre-viously described OM43 strains. Evidence of a further expanded metabolic range in OM43 clade methylotrophs was recently dem-onstrated for multiple OM43 strains that were isolated via growth on naturally derived HMW DOM (19). Growth assays of these isolates showed that they could reach substantial cell densities (⬎106ml⫺1) on either methanol or HMW DOM. However, the
genes enabling this expanded metabolic range, as well as their regulation under different environmental conditions, remain un-known.
Complementing these laboratory observations, environmental surveys are revealing that members of the OM43 clade are active, dynamic members of coastal communities. Metatranscriptomes and metaproteomes revealed that OM43xoxF-type methanol de-hydrogenases are some of the most highly transcribed genes and among the most abundant proteins in coastal systems (20, 21). Furthermore,in situobservations suggest that these genes are dy-namically regulated, exhibiting substantial shifts in their tran-script profiles over both seasonal and diel time scales (22). For example, OM43xoxF-type methanol dehydrogenase transcripts had higher seasonal abundances in the fall and winter but minimal day-night differences, while in contrast, transcripts for ribosomal proteins and elongation factors displayed some of the largest day-night differences observed in the entire microbial community (22). These results suggest that OM43 members may tightly tune their transcriptome to the environmental conditions of coastal ecosystems, including temporal shifts in nutrient availability and primary production. However, it is not known which environ-mental factors are responsible for driving OM43 transcription dy-namics.
There is thus a need for experimentally validated, quantitative transcriptional markers that can be used as reporters of the phys-iological and metabolic state of OM43 clade cells under different conditions, particularly those indicating growth phase, nutrient stress, and carbon substrate utilization.In situquantitative omic techniques have recently been developed that allow for the calcu-lation of absolute gene, transcript, or protein abundances in marine samples on a per-environmental-unit basis (23–26). However, as these environmental gene inventories increase, inter-preting their biological or ecological meaning requires a knowl-edge of how cellular transcript abundances map to the activity, metabolism, and physiology of cell populations. Comparative quantitative transcriptomics of model organisms grown under de-fined conditions can identify transcriptional markers of physio-logical or metabolic activity and provide an inventory of cellular transcript abundances to aid in the interpretation of microbial activitiesin situvia metatranscriptomic surveys.
In this study, we applied quantitative transcriptomics to an analysis of OM43 clade strain NB0046 to (i) understand the quan-titative nature of a transcriptome from a streamlined marine bac-terium, including total mRNA content and genome-wide cellular transcript abundances, and how they change with growth phase; (ii) identify transcriptional benchmarks of physiological activity, metabolism, and the nutritional state; and (iii) explore the meta-bolic pathways and regulation involved in the metabolism of methanol and naturally occurring HMW DOM.
RESULTS AND DISCUSSION
Growth response to nutrient amendments.OM43 strain NB0046 was originally isolated off the coast of Massachusetts in the United States via dilution to extinction in a seawater medium enriched with naturally occurring HMW DOM (19). For the experiments described in this report, NB0046 was grown in a basal medium consisting of Sargasso seawater sterilized by tangential-flow filtra-tion (TFF) through a 1-kDa membrane and amended as follows. For regime I, the inorganic-nutrient-deplete condition, no inor-ganic nutrients or vitamins were added. For regime II, the inorganic-nutrient-amended condition, 400 M NH4⫹ and
30M PO43⫺were added. Regime III consisted of
inorganic-nutrient- and vitamin-amended conditions with 400 M NH4⫹, 30 M PO43⫺, and a vitamin mixture with shaking.
Regime IV consisted of inorganic-nutrient- and vitamin-amended conditions with 400M NH4⫹, 30M PO43⫺, and a
vitamin mixture without shaking. For a carbon source, the cul-tures were amended with either 50M methanol or various con-centrations of HMW DOM (see Materials and Methods).
Cultures amended with methanol reached a cell density (3⫻ 106ml⫺1; Fig. 1) typical of growth in Sargasso seawater medium,
as previously described (19), which was lower than that observed for other OM43 clade cultures grown in coastal seawater medium (16). The lower cell density appears not to be the result of reduced inorganic nutrient concentrations, since the addition of NH4⫹
and PO43⫺did not significantly increase the cell yield (Fig. 1). The
addition of an AMS1 vitamin mixture (27), however, did increase the concentrations to⬎107cells ml⫺1. Shaking the nutrient- and
vitamin-enriched cultures at 60 rpm did not further increase the cell yield (Fig. 1). The growth rates of the methanol-amended cultures in exponential phase ranged from 0.06 to 0.09 h⫺1,
sim-ilar to previous observations of OM43 isolates (14, 16).
depend-ing on the experimental conditions. Robust growth of this strain was consistently observed in high concentrations of HMW DOM when it was grown in small-volume chambers (200-l to 1-ml wells). However, when the batch culture volume was increased (from 8 to 250 ml), growth on HMW DOM was severely dimin-ished (see Fig. S1 in the supplemental material) and often did not significantly differ from that of the non-carbon-amended control, although the HMW DOM treatments exhibited significantly greater cell yields than the non-carbon-amended cultures later into stationary phase under regimes I and III (ttest,P⬍0.05; Fig. 1). We considered the possibility that ventilation may be one reason for the observed difference between the multiwell plates and the bottles; however, when the cells were shaken in 500-ml bottles with vented lids in regime III, there was no substantial increase in cell yields over regimes I and II for the HMW DOM amendments. Given the low growth yields on HMW DOM in large-volume cultures of regimes I, II, and III, we were unable to capture these bacteria for transcriptome analysis. However, when the seawater medium was UV oxidized (prior to nutrient or sub-strate additions) to reduce the background concentration of en-dogenous DOM, NB0046 exhibited significant growth only when the medium was amended with HMW DOM and did not grow in the non-carbon-amended control or methanol treatment (Fig. 1). In order to gain more insight into OM43 HMW DOM metabo-lism, we therefore grew and collected cells for transcriptional
anal-ysis in UV-oxidized seawater medium amended as follows. Re-gime V consisted of UV-oxidized seawater with no inorganic nutrient or vitamin amendment, and regime VI consisted of UV-oxidized seawater amended with inorganic nutrients (400 M NH4⫹and 30M PO43⫺).
The treatments again included methanol, HMW DOM, or a non-carbon-amended control. In these experiments, inorganic nutrients once again did not substantially increase maximum cell yields and there was no detectable growth in the non-carbon-amended control or methanol additions (Fig. 1).
Direct stimulation of growth by methanol and HMW DOM amendments.Our cell yields under non-carbon-amended condi-tions were consistent with previous reports that OM43 clade members can reach substantial cell densities (ⱖ105ml⫺1) when
grown in a naturally derived seawater medium that is not carbon amended (14, 19). Recentin situmeasurements of methanol in seawater have revealed nanomolar standing stocks and a methanol turnover time of 1 day (8), suggesting that ambient methanol concentrations in seawater could support significant microbial growth. To examine the extent to which the carbon amendments in our experiments directly supported the observed cell yields, we developed a simple, high-performance liquid chromatography (HPLC)-based method to quantify methanol in our seawater me-dium and the carbon-amended treatments.
The ambient methanol concentration in the basal seawater was FIG 1 Growth of OM43 clade betaproteobacterial strain NB0046 in Sargasso seawater medium amended with different nutrient and carbon substrates. Error bars represent the SD of triplicate samples for each treatment. For regime IV, the total length of the experiment was twice that of the others. Inorganic nutrients, 30M phosphate and 400M ammonium; vitamins, AMS1 vitamin mixture; vented and shaking, incubation bottles were shaken at 60 rpm and their caps loosed to increase ventilation of the medium. Arrows indicate sampling points from which transcriptomes were generated.
248⫾100 nM (mean⫾standard deviation [SD],n⫽6), compa-rable to mass spectrometry measurements of methanol in seawa-ter from similar Atlantic latitudes by Beale et al. (8). On the basis of the bacterial growth efficiency of 22% reported by Halsey et al. (16) for OM43 strain HTCC2181 grown on 10M methanol and a bacterial carbon content of 10 fg of C cell⫺1 (28), this
back-ground methanol concentration could support a cell density of ca. 6⫻104ml⫺1but not the 3⫻105to 5⫻105ml⫺1we observed in
the non-carbon-amended and HMW DOM treatments (Fig. 1). For the methanol-amended samples in regime IV, NB0046 con-sumed methanol at a rate inversely proportional to cell growth (Fig. 2A), and assuming the aforementioned growth efficiencies, the 46.6M methanol consumed could support the production of 1.2⫻107cells, comparable to the observed maximum cell density
of 1.4⫻107⫾1.1⫻106ml⫺1(mean⫾SD,n⫽3). A similar result
was obtain under the methanol amendment in regime III (Fig. 2B), with a final observed methanol drawdown of 39M that could theoretically support a density of 1⫻107cells ml⫺1, closely
matching the observed maximum cell density of 1⫻107⫾1.3⫻
106ml⫺1(mean⫾SD,n⫽3). Unexpectedly, there was also a
small but significant abiotic loss of methanol in the noninoculated controls in the methanol treatment in this experiment, potentially due to the ventilation and shaking conditions of this regime (if this loss was consistent, the total drawdown would be reduced to 29M and the theoretical yield would be 0.74⫻107cells ml⫺1).
In the HMW DOM treatments, there were no significant
in-creases in methanol concentrations just after the HMW DOM addition or at the final time point for the HMW DOM-amended, noninoculated controls (Fig. 2B). In the UV-oxidized seawater experiments in which we observed significant growth on HMW DOM, the methanol concentration was initially 0.67⫾0.05M (mean⫾SD,n⫽3), 3.5 times as high as that of non-UV-treated seawater medium (Fig. 2B). This increase may be due to the UV-driven release of methanol from background HMW DOM poly-saccharides naturally present in the seawater, which incorporate methylated sugars (29, 30). However, under the aforementioned assumptions, this would theoretically support only one-third of the observed final cell yields. Furthermore, the cells did not grow in either the non-carbon-amended control or methanol-amended treatment in the UV-oxidized seawater (Fig. 1), even given the medium’s higher background methanol concentrations. We did observe a drawdown of 0.54M methanol from the background medium at the end of the experiment for the inoculated HMW DOM treatment in UV-oxidized seawater, which could support 1.4⫻105cells ml⫺1but not the observed final yield of 5.4 ⫻
105cells ml⫺1. These results suggest that the addition of HMW
DOM to the medium provided some growth factor or carbon source to support the observed cell production. It is unlikely that the growth of OM43 cultures on HMW DOM is due to abiotic release of absorbed or covalently attached methyl compounds from the DOM polymer, as we did not observe the presence of free methanol, formaldehyde, or formic acid in solutions of HMW DOM screened by1H nuclear magnetic resonance (NMR)
analy-sis, and there was no significant increase in the methanol concen-tration just after HMW DOM addition or at the final time point in the HMW DOM-amended, noninoculated controls (Fig. 2B). These results suggest that abiotic release of methanol from HMW DOM is negligible and support the hypothesis that HMW DOM-sustained growth is due to enzymatic cleavage of the carbon sub-strate directly from HMW DOM by the methylotrophs.
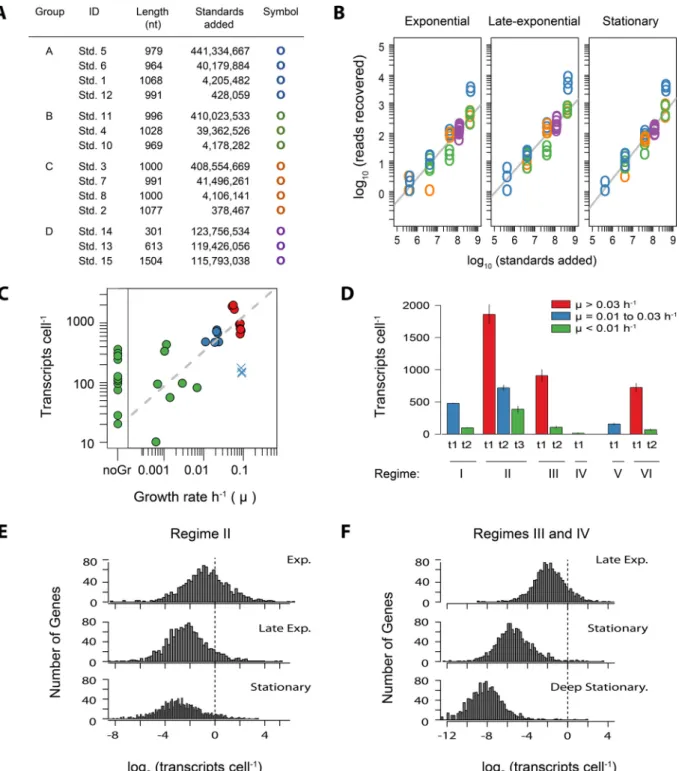
Sequence composition and internal standard recovery. Trip-licate biological samples for RNA analysis were collected at 11 time points in the six cultivation experiments (Fig. 1) in order to iden-tify transcriptional markers of growth, activity, and carbon me-tabolism under the different nutrient regimes. Quantitative tran-scriptomics was achieved by synthesizing 14 RNA standards that were assembled into four groups and then individually added to a sample just prior to RNA extraction (Fig. 3A; also see the supple-mental material). The samples were rRNA depleted and se-quenced with Illumina’s MiSeq platform. The sequencing yields across the 33 transcriptomes ranged from 3⫻105to 3⫻106reads
per sample (see Table S1 in the supplemental material). Recovery of the internal RNA standards in the sequence libraries was log linear over 4 orders of magnitude, showing good replication be-tween the standard sets and few indications of systematic or tech-nical error (Fig. 3B; also see Fig. S2 in the supplemental material). However, 3 of the 14 standards were not recovered at the expected ratios (standards 2, 4, and 5; Fig. 3B; see Text S1 in the supplemen-tal material) and therefore were not included in any downstream calculations. The remaining 11 standards were used to convert the number of reads per library to the number of transcripts per cell (see Text S2).
Cellular mRNA content and transcript abundance as func-tions of the growth phase.The average mRNA content per cell varied by 3 orders of magnitude across the six experiments and significantly correlated with the culture growth phase (Pearson’s FIG 2 Methanol concentrations in Sargasso seawater medium with or
with-out strain NB0046 and with different nutrient regimes and carbon substrates. (A) Time series of methanol drawdown in proportion to NB0046 growth in the nutrient- and vitamin-amended regime (IV). Cell densities are black filled circles, and methanol concentrations are open boxes. (B) Beginning and end-point methanol concentrations for the nutrient- and vitamin-amended regime (III) and the UV-oxidized medium experiment with HMW DOM plus nutri-ent amendmnutri-ents (regime VI). The carbon substrate treatmnutri-ents are indicated below the axis (Non Amd., not carbon amended), and above those are the time points sampled (S.M., seawater medium before starting the experiment; T0,
inoculated and just after addition of the carbon substrate; TF, inoculated and at
the final time point sampled; CtrlF, noninoculated at the final time point
FIG 3 (A) Internal RNA standard statistics and groupings. ID, the standard identifier; length, total number of nucleotides in a standard; standards added, the final number of standards added to each sample; symbol, the plotting symbol in the graph. (B) The recovery of internal standards in the sequence libraries versus the number of standards added for samples collected over three different growth phases in the nutrient- and methanol-amended regime (II). The grey line is the fitted linear regression. Plots of standard recovery for all 33 samples are provided in Fig. S2. (C) Relationship between the total mRNA content per cell as estimated from internal standard recovery and the culture growth rate at the time of sampling. Points are colored as indicated in the legend to panel D. The time points at which growth was zero or cell densities were decreasing were binned into “noGr.” Regime V (UV-oxidized medium not nutrient amended plus HMW DOM) had relatively low temporal resolution of cell concentrations just before transcriptome sampling, causing the sampling time points to have an overestimate of the growth rate and were therefore considered outliers (plotted as blue⫻s). (D) Total cellular transcript abundances by experiment and sampling time point (t1 to t3), as shown by the arrows in Fig. 1. (E, F) Distribution of transcript abundances in OM43 strain NB0046 during different phases of growth. The dashed line indicates the number of genes with one transcript cell⫺1. Exp., exponential
growth phase; late exp., late-exponential growth phase; Deep Stationary., cultures in the stationary phase for an extended period of time.
r⫽ ⫺0.55,P⬍0.01; Fig. 3C). The nutrient-amended regime (II) plus methanol, for which transcriptome samples were collected at three distinct points in the growth curve, had abundances of 1,859 (⫾155), 720 (⫾45), and 387 (⫾50) transcripts cell⫺1during the
exponential, late-exponential (i.e., transitioning from exponential to stationary), and stationary growth phases, respectively (mean⫾ SD). The mRNA content of cultures in stationary phase for an extended period of time was lower (⬍100 transcripts cell⫺1) and
reached a minimum of 17⫾7 transcripts cell⫺1in the 600th hour
of the regime IV experiment (Fig. 3D).
Transcripts were detected for ⬎99% of the genes in the NB0046 genome, no matter the experiment or treatment condi-tion (99.8%⫾0.17% [mean⫾SD],n⫽33). The genome-wide distribution of gene-specific transcript abundances followed a lognormal distribution (Fig. 3E and F). These results are compa-rable to earlier RNA-Seq observations that showed that most, if not all, genes are expressed in the bacterial genome, and these expression levels follow a continuous distribution, with no dis-crete division into low or high gene expression (31). The variance in gene-specific transcript abundances was tightly constrained, with the difference between the lowest and highest gene expres-sion levels spanning 5 orders of magnitude for all of the samples (4.6⫾0.4 [mean⫾SD],n⫽33; Fig. 3E and F). In contrast, the magnitude of individual transcript abundances showed clear trends of shifting with the culture growth phase (Fig. 3E and F), as expected given the total cellular mRNA content relationship to the growth phase described above. The gene-specific transcript abun-dance averaged 1.4⫾0.1 transcripts cell⫺1during exponential
phase, a value similar to that obtained by Passalacqua et al. (31), who used a modeling approach based on samples ofBacillus an-thraciscollected in exponential growth phase. The most highly expressed gene in the NB0046 transcriptome during this growth phase was the methanol dehydrogenase-encoding gene xoxF
(NB46_00364), with a mean abundance of 83⫾51 transcripts cell⫺1, while in contrast, the least expressed genes were found at
only 1 transcript in every 215 cells (0.005⫾ 0.002 transcripts cell⫺1). As the cultures entered stationary phase, the average gene
transcription level dropped by 62% to 0.55 ⫾0.03 transcripts cell⫺1and eventually to a low of 0.29⫾0.04 transcripts cell⫺1in
stationary phase. On the extreme end, in the deep stationary phase of regime IV, the average transcript abundance was 0.004 tran-scripts cell⫺1or approximately 1 in every 250 cells. For the cellular
transcript abundances of all of NB0046’s genes across the 33 dif-ferent samples, see Table S2 in the supplemental material.
Interpretation of cellular transcript abundances is growth phase dependent.An examination of genes commonly used as metabolic state and growth phase markers revealed that the cellu-lar transcript abundance of these genes closely tracks the growth status of the cultures at the time of collection (Fig. 4A). Given that the goal of most transcriptome experiments is a comparative analysis of treatment-specific processes, these results suggest that comparisons of different treatments on a transcripts-per-cell scale should be conducted with sample populations in similar growth/ activity states, or else global transcript changes tied to the physio-logical state may obscure any biophysio-logically meaningful difference between the treatments. Therefore, in our study, to identify treatment-specific differences in transcript abundances, we com-pared only across time points when the cultures were in similar growth phases, particularly focusing on the four experiments that had samples near the end of exponential-phase growth, i.e.,
meth-anol (MeOH)-amended medium without inorganic nutrients (N) or vitamins (V) (regime I,⫹MeOH ⫺N⫺V); methanol- and inorganic-nutrient-amended medium (regime II,⫹MeOH⫹N
⫺V); methanol-, inorganic-nutrient-, and vitamin-amended me-dium (regime III,⫹MeOH ⫹N⫹V); and HMW DOM- and inorganic-nutrient-amended, UV-oxidized medium (regime VI,
⫹DOM⫹N⫺V).
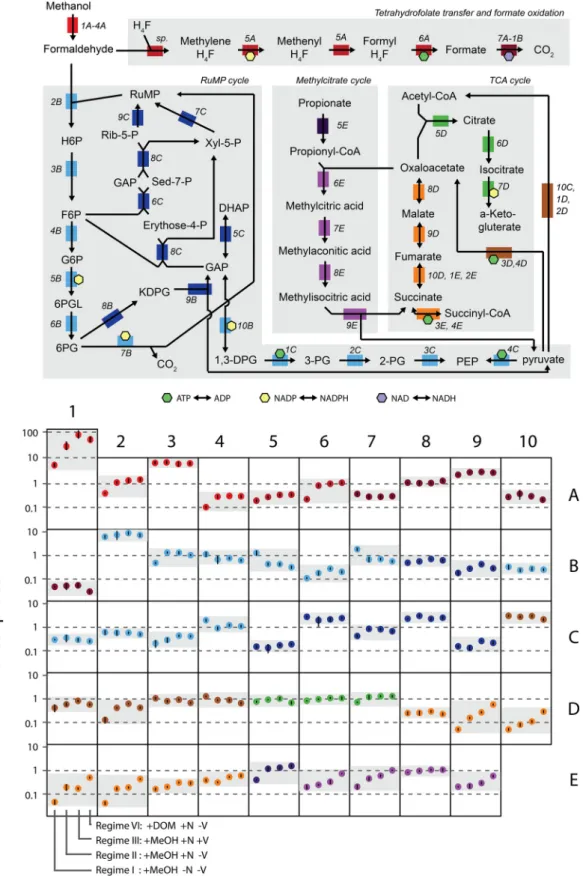
FIG 5 Transcript abundances of NB0046 genes related to one-carbon and central metabolism under different nutrient regimes and carbon substrate additions. At the top is a metabolic map of the substrates, genes (colored blocks), and their connections (arrows) in strain NB0046. Next to each gene is an identifier in italics providing the location of that gene in the bottom panel, which shows the mean transcript abundances of triplicate samples collected from the late exponential phase for the different nutrient regimes (regime designations are shown at the base of box 1E). The full names and IMG accession numbers of the genes are shown in Table S3 in the supplemental material. Error bars are the SDs of biological triplicates.
ANOVA, and if the Benjamini-Hochberg-corrected P value was⬍0.05, a pairwisettest was used to identify significantly dif-ferent treatment pairs with a minimum 2-fold difference in tran-script abundance.
The initial step in C1 metabolism is methanol oxidation to formaldehyde via anxoxF-type methanol dehydrogenase (32, 33), and in our experiments,xoxFwas often the most highly tran-scribed gene, with tens to hundreds of transcripts cell⫺1(Fig. 5,
box 1A). This is consistent with observations from coastal tran-scriptomes thatxoxFis often a dominant component of the ma-rine transcript and protein pool (20, 22). In fact, under all of the conditions tested in this study,xoxFwas always present atⱖ1 copy cell⫺1, even in stationary phase. This was true of no other gene in
the genome, further highlightingxoxF’s likely vital function or rapid cellular turnover. Interestingly, while methanol was present at nanomolar or greater concentrations in all of our experiments (Fig. 2),xoxF’s transcriptional dynamics seemed to be more nu-trient regime dependent, with a 20-fold difference inxoxF tran-script abundance between the nutrient-deplete (⫹MeOH ⫺N
⫺V) and nutrient-amended (⫹MeOH⫹N⫺V) regimes (Fig. 5, box 1A). Genes xoxJG are also part of the xox operon but were transcribed at lower levels thanxoxFand displayed more muted expression dynamics, withxoxJ(methanol dehydrogenase-associated protein) showing significantly lower expression only in the nutrient-deplete experiment (⫹MeOH ⫺N⫺V) and xoxG
(associated cytochrome) consistently expressed at 10 to 11 tran-scripts cell⫺1across all four experiments (Fig. 5, boxes 2A and 3A).
Formaldehyde produced from methanol oxidation is the cen-tral intermediate in C1 metabolism, and OM43 strains possess two different pathways for processing it: (i) oxidation of formaldehyde to formate via the tetrahydrofolate pathway and (ii) the ribulose monophosphate (RuMP) cycle for either assimilatory or dissimi-latory processes. The first two enzymatic steps in the tetrahydro-folate pathway are catalyzed by a bifunctionalfolD-encoded pro-tein, which, in all of our late-exponential-phase experiments, was consistently expressed at ca. 0.3 transcript cell⫺1(Fig. 5, box 5A).
The methyl moiety is then oxidized to formate via a formate-tetrahydrofolate ligase, which showed significantly lower expres-sion in the nutrient-deplete regime (⫹MeOH⫺N⫺V) (Fig. 5, box 6A). The final step in the tetrahydrofolate pathway is oxida-tion of formate to CO2via a multisubunit formate dehydrogenase,
which was relatively consistently transcribed across the various nutrient regimes, although the transcript abundances of the indi-vidual subunits were substantially different from one another (av-erages of 0.05, 0.31, 1.16, and 2.94 transcripts cell⫺1for the delta,
gamma, beta, and alpha subunits, respectively) (Fig. 5, boxes 7A through 1B).
An alternative route for formaldehyde metabolism is the RuMP cycle, which can operate in an assimilatory manner to pro-duce intermediates of central carbon metabolism or in a dissimi-latory manner for energy conservation. Entry into the RuMP cycle begins with 3-hexulose-6-phosphate synthase (HPS), which con-denses formaldehyde and ribulose 5-phosphate. We observed that HPS had consistently high late-exponential-phase transcript abundances under all of the nutrient regimes (8 to 12 transcripts cell⫺1; Fig. 5, box 2B). After HPS, RuMP intermediates undergo a
series of isomerizations and dehydrations (Fig. 5, boxes 3B and 6B). Interestingly, the genes encoding dehydration steps were two of the few genes in the genome we observed to have significantly higher transcript abundances under nutrient-deplete conditions
(⫹MeOH⫺N⫺V) (Fig. 5, boxes 5B and 7B). These two dehy-drogenases are important regulatory steps in the RuMP cycle (34), with 6-phosphogluconate dehydrogenase in particular being di-agnostic of the dissimilatory portion of the RuMP cycle, which leads to the oxidation of phosphogluconate to CO2and the
regen-eration of RuMP. The transcriptional enrichment of these dehy-drogenases may indicate that the cells were routing more carbon to the dissimilatory component of the RuMP cycle under nutrient-deplete conditions, potentially due to a lack of key inor-ganic nutrients for synthesizing biomass.
After the assimilatory C1 and RuMP pathways, carbon may enter the TCA cycle, which, in all sequenced OM43 strains, is missing the E1 subunit of␣-ketoglutarate dehydrogenase (15, 17). This enzymatic gap results in an incomplete TCA cycle, which is widely used as a diagnostic marker of obligate methylotrophy (35). In our experiments, the two TCA cycle branches displayed distinctly different transcriptional patterns. The first branch con-sists of the conversion of citrate to␣-ketoglutarate, and the three genes in this branch were consistently transcribed at ca. 1 tran-script cell⫺1across all of the regimes (Fig. 5, boxes 5D through
7D). The second TCA cycle branch is the conversion of oxaloac-etate to succinate, and interestingly, it showed an expression pat-tern that was very different from that of the citrate branch, ranging from a low of 0.1 transcript cell⫺1in the nutrient-deplete cultures
(⫹MeOH⫺N⫺V) to ca. 1.0 transcript cell⫺1in the HMW DOM
treatment (⫹DOM ⫹N⫺V) (Fig. 5, boxes 9D and 2E). The NB0046 genome encodes a succinate dehydrogenase, and al-though it was also significantly enriched in the HMW DOM treat-ment, the effect size was much smaller than that of the other TCA genes (Fig. 5, boxes 3E and 4E), potentially indicating a different metabolic role, as it is unknown how the conversion of succinate to succinyl-CoA would integrate into central metabolism in these organisms (35). Similarly, many members of the family Methylo-philaceaedo not encode a canonical malate dehydrogenase, in-stead encoding a malate quinone oxidoreductase (Fig. 5, box 8D; see reference 35). Notably, in our experiments, the gene for this enzyme did not follow the same transcription pattern as the other genes, potentially suggesting a different role or an alternative en-zyme in this location.
Several genes associated with methylcitrate metabolism had transcription patterns similar to that of the oxaloacetate arm of the TCA cycle. An examination of the NB0046 genome revealed that these genes are likely part of a complete methylcitrate cycle (MCC). In other organisms, the MCC has been shown to be in-volved in the metabolism of short-chain fatty acids, particularly propionyl coenzyme A (propionyl-CoA) (36). In NB0046, MCC genes for propionyl-CoA metabolism are clustered together in a
prpBCDlocus encoding 2-methylcitrate synthase (prpC; Fig. 5, box 6E), 2-methylcitrate dehydratase (prpD; Fig. 5, box 7E), and methylisocitrate lyase (prpB, a diagnostic marker of the MCC pathway; Fig. 5, box 9E). Strain NB0046 does not appear to encode a canonical 2-methylisocitrate dehydratase, though it does contain an aconitate hydratase (acnB, Fig. 5, box 8E), which may have similar activity. A survey of OM43 clade genomes in the Integrated Microbial Genomes (IMG) database revealed theprpBCD locus to be conserved among all four available genomes (HTCC2281, HIMB624, NB0016, NB0046).
were significantly enriched in the HMW DOM treatment (⫹DOM⫹N⫺V), we also observed significantly higher MCC transcript abundances in the HMW DOM samples (Fig. 5, boxes 6E, 7E, and 9E). The one exception was the aconitate hydratase gene mentioned above (acnB, Fig. 5, box 6E), which may suggest that NB0046 encodes the MCC-2 pathway variant that does not require this enzyme.
The MCC has also been found inMethylotenera mobilis, a re-lated member of the familyMethylophilaceaefrom freshwater sed-iments, suggesting that they have the capability for multicarbon metabolism and challenging the notion that these organisms are obligate methylotrophs (37). Expression ofM. mobilisMCC genes was enrichedin situ, suggesting that 3C metabolism may be an important component of theirin situactivity. Our observations of a complete MCC cycle in marine members of the OM43 clade indicates that these organisms may have the ability to degrade multicarbon substrates, and the upregulation of these genes in the HMW DOM treatment suggests a potential route for metaboliz-ing this complex carbon substrate.
Transcriptional responses to differing nutrient regimes. Be-yond central carbon metabolism, NB0046 also had substantial transcriptional shifts in other important physiological processes under the different nutrient regimes, including those related to inorganic nutrient processing and energy conservation (Table 1), as well as translational and iron-related machinery (see Text S1 in the supplemental material).
Nitrogen.Under the nutrient-deplete regime (⫹MeOH⫺N
⫺V), NB0046 substantially upregulated nitrogen-related tran-scripts, particularly those involved in the PII-dependent response,
the glutamine oxoglutarate aminotransferase (GOGAT) system, and nitrogen starvation stress (Table 1). This included genes such as that for the PIInitrogen regulatory protein (⬎1,000-fold
in-crease in transcript abundance), that for glutamine synthase (6-fold increase), andntrB(5-fold increase). NB0046’s two ammo-nium transporters also had higher cellular transcript abundances in the nutrient-deplete experiment, although to a markedly different extent, with amtB gene 1 (NB46_01065) increasing 2-fold (0.4⫾0.1 transcript cell⫺1[mean⫾SD]),
whileamtBgene 2 (NB46_00249) increased over 250-fold to 4.9⫾ 1.4 transcripts cell⫺1. Other nitrogen-related transcripts enriched
in the nutrient-deplete condition included those for IMP dehy-drogenase, GMP synthase, ornithine carbamyl transferase, and carbamyl phosphate synthase (Table 1). The gene showing the greatest change in cellular transcript abundance over all of the experiments was that for hypothetical protein NB46_00251, which is in a putative operon with the gene for the highly upregu-lated ammonium transporter and nitrogen PIIregulatory protein
(Glnk). For the majority of experiments, this gene’s transcripts were typically found in only 1 out of every 100 cells; however, under the nutrient-deplete regime (⫹MeOH⫺N⫺V), the abun-dance of the transcript for NB46_00251 increased by 1,900-fold to 17⫾0.2 transcripts cell⫺1(Table 1).
Phosphorus.Changes in phosphorus-related transcript abun-dances among the different nutrient conditions were more con-strained than those for nitrogen-related transcripts (Table 1). The nutrient-deplete regime (⫹MeOH⫺N⫺V) had a significantly lower transcript abundance (2- to 5-fold) of the phosphate-specific transport system gene (pst), while that of the gene for the corresponding negative regulator protein,phoU, showed little dif-ference among the experiments. The genes for the phosphate
regulon sensor protein and a phosphate-selective porin were also significantly lower in the nutrient-deplete regime. Whilepst tran-scripts increased upon phosphorus addition (⫹MeOH⫹N⫺V), they reached their highest abundances in the vitamin (⫹MeOH
⫹N⫹V) and HMW DOM regimes (⫹DOM⫹N⫺V). Interest-ingly, there was also significant enrichment in both the vitamin-plus-methanol and HMW DOM regimes of aphnPgene that en-codes the last step in methylphosphonate utilization (Table 1). The NB0046 genome, however, does not appear to contain the other genes in the canonical carbon-phosphonate lyase operon, suggesting that this gene may have a different metabolic role in NB0046.phnPis a phosphoribosyl 1,2-cyclic phosphate phospho-diesterase that is able to cleave phosphophospho-diesterase bonds. Cyano-cobalamin (vitamin B12), which contains a phosphate group in a
cyclic phosphodiesterase bond, is part of the AMS1 vitamin mix-ture used in our experiments and was present at a final concentra-tion of 700 pM. In a similar fashion, chemical characterizaconcentra-tion of HMW DOM by31P NMR shows that up to 70% of the
or-ganic phosphorus in HMW DOM is contained within sugar phosphodiester bonds (D. J. Repeta, unpublished data), such that the HMW DOM regime was supplemented with ~1.3M sugar phosphodiester-P. Thus, metabolism of cyanocobalamin and HMW DOM may be linked by the substrate-induced tran-scription of genes for breaking phosphodiesterase bonds (phnP) and phosphate uptake (pst).
Rhodopsin.The NB0046 genome encodes a light-driven,
proton-pumping rhodopsin, and under the methanol- and nutrient-amended (⫹MeOH⫹N⫺V), methanol- and vitamin-amended (⫹MeOH⫹N⫹V), and HMW DOM (⫹DOM⫹N
⫺V) conditions, cellular abundances of rhodopsin transcripts were high, with 16 to 36 transcripts cell⫺1(Table 1). These
find-ings agree with metatranscriptomic surveys in which rhodopsin genes are often found to be some of the most highly transcribed genesin situ, not just for OM43 clade members but for many abundant community members such as SAR11, SAR116, and fla-vobacteria (21, 38). However, under nutrient-deplete conditions (⫹MeOH⫺N⫺V), rhodopsin transcripts were significantly re-duced by 18-fold to 1.5⫾0.1 transcripts cell⫺1(mean⫾SD).
mental energy source that rhodopsin-driven proton pumping can provide.
Global similarity between vitamin-amended and HMW DOM treatments.While there were clear instances of transcrip-tion differences between the vitamin-plus-methanol (⫹MeOH
⫹N⫹V) and HMW DOM (⫹DOM⫹N⫺V) regimes, the two experiments often displayed similar expression patterns (Table 1), including enrichment of genes for the nonmevalonate pathway for terpenoid synthesis (which integrates with synthesis of vitamins B1 and B6, carotenoids, and quinones), peptidases encoded by
TABLE 1 Cellular transcript abundances of selected genes significantly upregulated or downregulated under different nutrient regimesa
No. of transcripts per 1,000 cells
Gene description Locus SD; significance Deplete Replete Vitamin DOM
17,897 10 10 8 Conserved hypothetical protein NB46_00251 166/3/3/2;⫹⫹⫹,⫺nn,⫺nn,⫺nn 3,093 3 3 3 Nitrogen regulatory protein PII NB46_00250 86/1/1/1;⫹⫹⫹,⫺nn,⫺nn,⫺nn
4,952 18 19 23 Ammonium transporter NB46_00249 1,402/3/4/2;⫹⫹⫹,⫺nn,⫺nn,⫺nn 32 2 1 1 Hypothetical protein KB13_177 NB46_00540 19/2/1/1;⫹⫹⫹,⫺nn,⫺nn,⫺nn 425 35 69 83 Ammonium transporter NB46_01065 119/2/14/8;⫹⫹⫹,⫺nn,⫺nn,⫺nn 2,413 2,058 1,899 1,653 Glutamine synthetase, type I NB46_00305 651/287/315/162;⫹⫹⫹,⫺nn,⫺nn,⫺nn 1,228 236 379 370 Glycosyltransferase involved in cell wall biogenesis NB46_00223 244/41/36/42;⫹⫹⫹,⫺nn,⫺nn,⫺nn 869 177 184 173 Nitrogen regulation protein NtrB NB46_00304 70/20/27/30;⫹⫹⫹,⫺nn,⫺nn,⫺nn 2,826 565 1,162 936 IMP dehydrogenase NB46_01283 792/108/135/90;⫹⫹⫹,⫺nn,⫺nn,⫺nn 1,277 319 558 415 GMP synthase NB46_01284 152/16/20/38;⫹⫹⫹,⫺⫺n,⫺⫹n,⫺nn 88 994 446 175 Chaperone protein DnaJ NB46_00532 6/473/30/3;⫺nn,⫹n⫹, nnn, n⫺n 69 889 363 165 Cochaperone GrpE NB46_00534 8/496/73/14;⫺nn,⫹n⫹, nnn, n⫺n 127 2,066 1,064 493 Chaperone protein HtpG NB46_00999 12/673/182/38;⫺⫺n,⫹⫹⫹,⫹⫹n, n⫺n 372 4,704 2,003 944 Chaperone protein DnaK NB46_00533 29/829/313/71; —n,⫹⫹⫹,⫹⫺⫹, n⫺⫺ 563 2,833 946 547 Chaperonin GroS NB46_01193 43/543/208/15;⫺nn,⫹⫹⫹, n⫺n, n⫺n 1,240 6,068 2,213 1,305 Chaperonin GroL NB46_01192 167/681/325/55; —n,⫹⫹⫹,⫺⫹⫺, n⫺⫺ 570 750 718 560 Phosphate transport system regulatory PhoU NB46_00097 75/34/32/50; —n,⫹n⫹,⫹n⫹, n⫺⫺ 76 109 163 183 Phosphate-selective porins O and P NB46_00625 28/34/22/32; n⫺⫺, nnn,⫹nn,⫹nn 40 83 119 162 Phosphate ABC transporter, periplasmic P-binding NB46_00628 7/8/14/19;⫺⫺⫺,⫹⫺⫺,⫹⫹⫺,⫹⫹⫹ 154 240 453 439 Phosphate ABC transporter, permease PstC NB46_00629 12/30/12/59;⫺⫺⫺,⫹⫺⫺,⫹⫹n,⫹⫹n 95 210 531 493 Phosphate ABC transporter, permease PstA NB46_00630 9/29/20/49;⫺⫺⫺,⫹⫺⫺,⫹⫹n,⫹⫹n 94 280 457 361 Phosphate ABC transporter, ATP-binding NB46_00631 20/52/32/16;⫺⫺⫺,⫹⫺⫺,⫹⫹⫹,⫹⫹⫺ 78 183 202 176 Phosphate regulon sensor protein NB46_01228 8/99/6/10; nnn, nnn, nnn, nnn
134 264 1,213 989 PhnP protein NB46_00720 8/53/78/99;⫺⫺⫺,⫹⫺⫺,⫹⫹⫹,⫹⫹⫺ 308 644 298 244 Fe-S protein assembly chaperone HscA NB46_00974 42/268/9/24; nnn, nn⫹, nnn, n⫺n 109 155 87 88 Fe-S protein assembly cochaperone HscB NB46_00975 15/45/13/7; nnn, nnn, nnn, nnn 170 350 163 230 Iron-sulfur cluster assembly protein IscA NB46_00976 16/26/27/30;⫺n⫺,⫹⫹⫹, n⫺⫺,⫺⫹⫺ 134 5,304 574 309 TonB-dependent siderophore receptor NB46_01062 8/1,302/38/44;⫺nn,⫹⫹⫹, n⫺n, n⫺n 289 1,148 301 964 Putative TonB-dependent receptor NB46_00103 15/321/22/71;⫺n,⫹⫹n, n⫺⫺,⫹n⫹ 1,376 688 772 671 Ferritin and Dps NB46_00108 79/103/47/48;⫹⫹⫹,⫺nn,⫺nn,⫺nn 1,455 16,208 36,814 27,421 Bacteriorhodopsin NB46_00176 121/1,449/4,097/3,176;⫺⫺⫺,⫹⫺⫺,
⫹⫹⫹,⫹⫹⫺
39 72 95 76 -Carotene 15,15=-monooxygenase NB46_00171 1/38/4/8; n⫺n, nnn,⫹nn, nnn 27 139 151 158 Lycopene cyclase protein NB46_00172 2/67/19/15;⫺⫺⫺,⫹nn,⫹nn,⫹nn 22 106 93 113 Phytoene/squalene synthetase NB46_00173 4/36/13/16;⫺⫺⫺,⫹nn,⫹nn,⫹nn 101 304 329 361 Phytoene desaturase NB46_00174 21/129/34/43;⫺⫺⫺,⫹nn,⫹nn,⫹nn 147 522 630 673 Geranylgeranyl pyrophosphate synthase NB46_00175 27/154/152/92;⫺⫺⫺,⫹nn,⫹nn,⫹nn 44 47 102 94 2-C-methyl-D-erythritol 2,4-cyclodiphosphate NB46_01067 12/8/2/6; n⫺⫺, n⫺⫺,⫹⫹n,⫹⫹n 50 35 114 103 2-C-methyl-D-erythritol 4-phosphate transferase NB46_01066 8/5/12/10; n⫺⫺, n⫺⫺,⫹⫹n,⫹⫹n 98 260 687 666 Peptidase PpqF NB46_00526 24/58/38/72;⫺⫺⫺,⫹⫺⫺,⫹⫹n,⫹⫹n 180 379 863 750 Putative Xaa-Pro aminopeptidase 3 NB46_00896 14/111/75/74;⫺⫺⫺,⫹⫺⫺,⫹⫹n,⫹⫹n 66 234 715 683 Trypsin domain protein NB46_01139 20/44/24/95;⫺⫺⫺,⫹⫺⫺,⫹⫹n,⫹⫹n 84 151 437 507 ABC-type dipeptide transport system, ATPase NB46_00835 3/35/23/94; n⫺⫺, n⫺⫺,⫹⫹n,⫹⫹n 85 239 553 385 Peptide ABC transporter, permease protein NB46_00784 10/127/21/34;⫺⫺⫺,⫹⫺⫺,⫹⫹⫹,⫹⫹⫺ 92 314 706 757 Sigma E regulatory protein, MucB/RseB, putative NB46_00988 13/67/42/97;⫺⫺⫺,⫹⫺⫺,⫹⫹n,⫹⫹n 386 1,211 2,478 2,690 RNA polymerase sigma factor RpoE NB46_00986 103/196/256/333;⫺⫺⫺,⫹⫺⫺,⫹⫹n,⫹⫹n 66 51 139 113 Sulfatase NB46_00552 8/12/10/13; n⫺⫺, n⫺⫺,⫹⫹⫹,⫹⫹⫺ 121 230 648 511 Extracellular solute-binding protein, family 5 NB46_00783 5/83/46/71; n⫺⫺, n⫹⫺,⫹⫹⫹,⫹⫹⫺ 16 77 66 193 Hypothetical protein Neut_0862 NB46_00664 0/3/4/4;⫺⫺⫺,⫹⫹⫺,⫹⫺⫺,⫹⫹⫹ 12 30 28 70 FKBP-type peptidyl-prolylcis-transisomerase NB46_01197 4/5/7/15; nn⫺, nn⫺, nn⫺,⫹⫹⫹ 101 269 420 1,055 Putative HpcH/HpaI aldolase/citrate lyase NB46_00665 12/33/16/47;⫺⫺⫺,⫹⫺⫺,⫹⫹⫺,⫹⫹⫹ 104 341 487 1,045 Long-chain fatty acid–CoA ligase, putative NB46_00666 17/93/21/76;⫺⫺⫺,⫹⫺⫺,⫹⫹⫺,⫹⫹⫹
ppqFandpqqG(involved in the biosynthesis of pyrroloquinoline quinone), several genes for the uptake and metabolism of proteins (sulfatases, peptide ABC transport), and the phosphorus-related
phnPgene described above. Notably, many of these genes can be linked to vitamin metabolism or to accessing functional groups on vitamin molecules.
To quantify the extent of the transcriptional similarity between the vitamin-plus-methanol and HMW DOM regimes further, we used hierarchal clustering to examine how the late-exponential-phase time points from each nutrient regime were related on a global transcriptome scale (Fig. 6A). While the nutrient-deplete (⫹MeOH⫺N⫺V) and nutrient-amended (⫹MeOH⫹N⫺V) regimes formed separate, distinct clusters, the vitamin-amended (⫹MeOH⫹N⫹V) and HMW DOM (⫹DOM⫹N⫺V) regimes clustered together, with the three HMW DOM replicates nested within the vitamin replicates (Fig. 6A). This strong similarity in the global transcriptome indicates that the HMW DOM ad-ditions provide vitamins or substituting nutrients that (at least in part) stimulate growth in UV-oxidized seawater. To test this, we conducted an experiment in which vitamins were added to UV-oxidized seawater medium amended with nutrients and looked for recovered growth in the methanol- and non-carbon-amended treatments. In comparison to non-vitamin-non-carbon-amended UV-oxidized seawater, the addition of vitamins stimulated NB0046’s growth in UV-oxidized seawater for both the methanol-and non-carbon-amended treatments (Fig. 6B). This was true for cells grown either in cultivation plates at 1 ml well⫺1(Fig. 6B) or in
8-ml cultures in test tubes (data not shown). However, in the test tubes, we continued to see that methanol addition led to a substantial increase in cell concentrations over the HMW DOM addition when vitamins were added, in contrast to the cultivation plates in which the addition of vitamins to the UV-oxidized seawater led to maximum cell density for the HMW DOM amendments.
It is important to note that vitamin B12(cobalamin) has a size
of⬎1 kDa and is potentially captured at ~98 to 99% efficiency in the HMW DOM collection process (Repeta, unpublished). This may provide a partial explanation for the complex growth pat-terns we saw with HMW DOM. The purpose of UV oxidizing the seawater used was to reduce the concentration of background car-bon compounds present in natural seawater that sustain the ca. 5⫻105cell ml⫺1yields in non-carbon-amended experiments.
Vitamins and vitamin precursors are likely oxidized during this process, and therefore, the fact that HMW DOM additions re-cover the growth of NB0046 cultures in UV-oxidized medium suggests that HMW DOM may contain some of these missing growth factors. An alternative explanation is that NB0046 can use the vitamins as a growth substrate, as evidenced by the small dif-ference between the non-carbon-amended and methanol treat-ments in UV-oxidized seawater (Fig. 6B).
Support for the hypothesis that restored growth in the DOM-amended, UV-oxidized medium is related to some vitamin sup-plementation thus includes the facts that (i) vitamin B12 (and
probably other B vitamins) is likely present in the HMW DOM concentrate; (ii) most organic cofactors will likely have been de-stroyed during the UV oxidation process; (iii) hierarchical cluster analysis revealed a global similarity in the vitamin-amended (⫹MeOH⫹N⫹V) and HMW DOM (⫹DOM⫹N⫺V) tran-scriptomes (Fig. 6A), suggesting a common metabolic response under these two conditions; and (iv) most importantly, addition of vitamins to the UV-oxidized medium restored the methanol growth response (Fig. 6B).
Summary.In this study, we produced a fully quantitative tran-scriptome of a marine bacterium in order to characterize the global transcript pool and shifts in cellular transcript abundances in re-sponse to different growth phases, nutrient regimes, and carbon sub-strates.
The mRNA content of this streamlined marine bacterium closely matched both modeled and experimentally derived values for other bacteria and was substantially influenced by the growth phase of the cultures at the time of collection. In the exponential phase of growth, NB0046 had 900 to 1,800 transcripts cell⫺1, a
value consistent with classical measurements of cell content based on bulk macromolecular composition. For example, an average
Escherichia colicell in exponential growth has been shown to con-tain 1,380 transcripts cell⫺1 (based on measurements of RNA
mass [43]) to 1,800 transcripts cell⫺1(based on single-cell analysis
[44]). NB0046’s cellular mRNA content during later phases of growth was lower, averaging approximately 100 transcripts cell⫺1.
These NB0046 stationary growth phase values are similar to the low values observed in the field, with several studies showing that an average marine bacterial community member will contain ca. 100 to 300 transcripts cell⫺1(23, 24, 45). However, it is not clear
FIG 6 OM43 strain NB0046 transcription patterns and cell growth assays reveal similar responses to the vitamin (⫹MeOH⫹N⫹V) and HMW DOM (⫹DOM
⫹N⫺V) regimes. (A) Hierarchical clustering (with Pearson correlation coefficients and complete linkage) of genome-wide transcript abundances. (B) Maxi-mum NB0046 cell densities in UV-oxidized seawater medium with or without AMS1 vitamin mixture amendment after 72 h of incubation. Error bars are the SDs of biological triplicates. No C Amd., non-carbon-amended control.
how well the growth phases of batch cultures reflect the nature of bacterioplankton growth in the environment. Caution in inter-preting these values is thus urged, and more research is needed to fully understand how representative batch cultures in stationary phase may mirror the low but potentially steady-state growth ofin situpopulations (46, 47).
The majority of genes were transcribed at⬍1 copy cell⫺1,
re-sults similar to previous models of bacterial transcription in which few genes have transcripts in every cell of a population, even dur-ing rapid growth (31, 48). We observed that cellular transcript abundances of genes encoding basic cellular maintenance and growth processes (ATP synthase, polymerases, elongation factors, etc.) were highly correlated with the growth phase of the culture and reflected a broader, system-wide trend of transcript abun-dance being directly related to the growth phase. These results suggest that inferences about differential transcription on a per-cell basis between experimental conditions should be made from cultures sampled in similar growth phases. By comparing only those samples that were collected near the end of exponential growth, we observed NB0046 to differentially regulate the transcript abundances of individual genes in response to different environmental conditions and substrates, including genes encoding carbon, nitrogen, phospho-rus, iron, and energy conservation-related processes (Table 1; see Ta-ble S2 in the supplemental material).
With their small genome and small cell size, OM43 clade mem-bers are categorized as having a streamlined lifestyle, which is in-creasingly recognized as a prominent ecological strategy in the oceans (49). Similar to SAR11 clade organisms, representatives of the OM43 clade have relatively few means of transcriptional reg-ulation (49), suggesting a reduced ability to respond to environ-mental dynamics, at least on the transcriptional level. However, the large shifts in transcript abundance observed in this study suggest that OM43 members are capable of inducing substantial changes in their transcriptomes in response to differing environ-mental conditions. For example, NB0046 increased the transcript abundances of nitrogen-related genes such as those for the PII
response, GOGAT, and ammonium transporters by hundreds to thousands of fold in the nutrient-deplete regime (⫹MeOH⫺N
⫺V). In contrast, a recent coupled transcriptome-proteome study of SAR11 clade representative “CandidatusPelagibacter ubique” revealed that this organism had little transcriptional response to nitrogen limitation, with many of its transcript changes limited to⬍3-fold between nitrogen-deplete and nitrogen-replete cul-tures (50). This difference between the transcriptional responses of SAR11 and OM43 is likely partially due to a lack of a P
II-dependent regulon system in SAR11. Indeed, inDehalococcoides mccartyi, which, like NB0046, contains a PIIregulon, a⬎50-fold
increase in PII-related gene transcription was observed under
nitro-gen limitation, suggestion that the PIIregulon is inherently prone to
large transcriptional dynamics (51). These results suggest that even though two types of organisms may have streamlined characteristics in common, there can be significant differences in the extent of their regulatory responses to changing environmental conditions.
A central goal of this study was to determine how an OM43 clade representative responds to different carbon substrate avail-ability. Our measurements of methanol concentrations in seawa-ter medium showed that methanol drawdown occurs at a rate proportional to cell growth and closely follows a model of growth efficiency similar to that described by Halsey et al. (16). However, our transcription results suggest a relatively complex regulatory
scheme controlling methanol metabolism that depends on nutri-ent conditions. For example,xoxF(methanol dehydrogenase), de-spite always being the most highly transcribed gene, had signifi-cantly higher transcript abundances in the nutrient-amended regimes, suggesting that the cell may upregulate this crucial path-way when nutrient supplies allow methanol to be used for both energy generation and biosynthesis. Accordingly, key dissimilatory RuMP cycle transcripts were upregulated in the nutrient-deplete re-gime, suggesting that when inorganic nutrients are limiting, carbon is routed more toward dissimilatory energy conservation processes. In contrast, proteorhodopsin transcription was downregulated in the nutrient-deplete regime (⫹MeOH –N⫺V), perhaps reflecting a de-creased requirement for this alternative energy source when there is ample carbon for respiration-driven energy conservation but growth is limited by inorganic nutrient availability (42). Interestingly, for-mate dehydrogenase and hexulose phosphate synthase gene tran-scription remained relatively constant across the experiments, sug-gesting that these genes, though both highly transcribed, might not be the most sensitive transcriptional markers, at least not under the con-ditions tested here.
Our transcription data also provided insights into an OM43 clade representative’s growth on HMW DOM. The significant en-richment of transcripts for the oxaloacetate arm of the TCA cycle in the HMW DOM treatment, together with the detection of com-plete MCC in NB0046 that was also significantly upregulated in the HMW DOM treatment, was suggestive of a potential route for HMW DOM metabolism through three-carbon compounds. In addition, the global similarity between the transcriptional re-sponses to the vitamin-plus-methanol (⫹MeOH⫹N⫹V) and HMW DOM (⫹DOM⫹N⫺V) treatments suggests that HMW DOM might also provide some vitamin supplements missing from the organic stripped UV-oxidized seawater that allow for the production of important metabolites like quinones, vitamins, carotenoids, and terpenoids. This supplementation might be the result of enrichment of vitamins within the HMW DOM itself or, alternatively, from both compounds serving directly as a growth substrate, with a potential metabolic link due to the presence of organic phosphorus contained within phosphodiesterase bonds. Taken together, these results suggest several potential mecha-nisms for an expanded metabolic range in OM43 strain NB0046. Future tests of these hypotheses are needed to tease apart the com-plex factors influencing OM43 carbon metabolism, including ex-amine growth on three-carbon compounds and vitamins, and their potential origin in the HMW DOM complex.
carbon-processing activities of these coastal methylotrophs may shift in response to various environmental conditions.
MATERIALS AND METHODS
Cell cultivation.The basal growth medium consisted of Sargasso seawater that was subjected to TFF to remove cells, viruses, and HMW DOM (see reference 19). The nutrient regimes consisted of inorganic nutrients alone (30M phosphate and 400M ammonium [final concentrations]) or with an AMS1 vitamin mixture (see reference 27 for composition). To ensure the sterility of the seawater medium, which had been sterilized by TFF several months prior to these experiments, it (and nutrients and vitamins if added) was passed through a 0.22-m-pore-size filter tower (polyethersulfone membrane; Falcon, Corning, NY). Subsamples of each medium type were then aliquoted into either 1-liter borosilicate glass bottles (regime I) or 500-ml polycarbonate bottles (regimes II to VI) and amended with either 50M methanol or HMW DOM from the North Subtropical Pacific (see below for HMW DOM description). The final concentrations of HMW DOM (measured in units of carbon assuming 0.4 mg of C/mg of DOM) depended on the availability of the purified product and varied from experiment to experiment as follows: regime I, 800M dissolved organic carbon (DOC), regime II, 2,200M DOC, regime III, 800M DOC, regime IV, no HMW DOC treatment, regime V, 400M DOC, regime VI, 560M DOC. The bottles were inoculated with an NB0046 starter culture to a final cell concentration between 500 and 2,000 ml⫺1, wrapped in aluminum foil, and placed in a dark incubator set
at 22°C. Regime III included shaking at 60 rpm and bottle lids loosely screwed on to increase ventilation. Cell concentrations were monitored via flow cytometry (see Text S1 in the supplemental material). Generation time was calculated for each sampling point by dividing the time elapsed by the log2-fold change in the cell abundance ratio between the current
and previous time points and then multiplying the result by 1.443 to get the growth rate. Cells were collected for RNA processing by peristaltic pumping onto 0.1-m-pore-size filters (see Text S1). Assays comparing growth in small- versus large-volume chambers were conducted with 48-well microtiter plates with 1 ml of medium per 48-well and in 10-ml polycar-bonate test tubes containing 8 ml of medium.
Methanol quantification.An enzymatic method of determining the concentration of methanol in a seawater background by HPLC was devel-oped. Subsamples of 10 to 20 ml were taken at various time points during the experiments and syringe filtered through a 0.22-m Acrodisc filter (Pall; both the syringe and Acrodisc filters were triple rinsed with ultra-pure water prior to filtering) into combusted glass vials. Filtered samples were stored at⫺20°C in the dark prior to quantification. Samples were thawed, and 1 ml was transferred into triplicate combusted glass HPLC vials. One hundred microliters of a freshly prepared alcohol oxidase solu-tion (1.47 U/ml; Sigma Aldrich) was added to two out of three replicate vials and mixed before incubation at room temperature in the dark for 14 h. Controls receiving no enzyme were given 100l of ultrapure water prior to incubation to maintain consistent volumes. Methanol standards were prepared by adding HPLC-grade methanol to sterilized seawater in combusted glass volumetric flasks prior to the addition of alcohol oxidase. A 12.6 mM solution of 2,4-dinitrophenylhydrazine (2,4-DNPH; Sigma Aldrich) was prepared in a 1 N hydrochloric acid solution by heating the mixture in a combusted glass volumetric flask at 90°C for 8 h with periodic mixing. The alcohol oxidase enzyme activity was quenched by adding 40l of the 2,4-DNPH solution and incubating the mixture at room temperature for 1 h after mixing it. Chromatographic analysis was per-formed with an Agilent 1100 or 1200 series high-performance liquid chro-matograph. Methanol standards and samples were injected (20l) and separated on a ZORBAX SB-C18column (Agilent; 3.5m, 4.6 by 150 mm)
by elution at 1 ml min⫺1with a linear gradient (percent solvent A
[ultra-pure water], percent solvent B [HPLC-grade acetonitrile], time in min-utes): 70, 30, and 0; 70, 30, and 2; 60, 40, and 4; 55, 45, and 16; 20, 80, and 18; 20, 80, and 22; 70, 30, and 24; and 70, 30, and 27. The derivatized formaldehyde peak was detected at 354 nm with a retention time of ca.
12 min. We corrected for any background formaldehyde present in each sample by subtracting the peak area (if detectable) of the control sample containing no alcohol oxidase from the average peak area of the replicates that received the alcohol oxidase enzyme. Methanol standards were used to derive molar concentrations of methanol from background-corrected peak areas. Using this approach, we could reliable quantify a range of methanol concentrations (100 nM to 50M) in a seawater background.
HMW DOM.The HMW fraction of DOM (⬎1 kDa) was
concen-trated by ultrafiltration from ~18,000 liters of filtered (0.2-m-pore-size filter) surface seawater (15 m) pumped 2 km from the shore of the Island of Hawaii, HI, at the National Energy Laboratory Hawaii Authority in February 2013. The ultrafiltration system consisted of a stainless steel membrane housing and a high-pressure pump fitted with two GE/ Osmonics 4- by 40-in. UF membranes (GE series) in parallel. Membranes were cleaned with 0.1 N NaOH and HCl and rinsed with 100 liters of seawater before use. Tubing and fittings were Kynar or polytetrafluoro-ethylene Teflon. Each day, approximately 1,600 liters of seawater was concentrated in a 200-liter high-density polyethylene barrel. At the end of sampling, the 200 liters was concentrated to ~20 liters, filter (0.2m) pumped into a 20-liter carboy, and stored at⫺20°C. The following day, this sample was combined with a new sample, concentrated to 20 liters, filtered, and stored. The sample did not freeze between collections but remained cold. The process was repeated until ~6,000 liters was concen-trated, after which the sample was frozen and returned to the lab for further processing. The HMW DOM-concentrated seawater was then fil-tered through a 30-kDa ultrafiltration membrane to remove cell debris and viral particles, diafiltered to remove salts, and freeze-dried. A total of 10.6 g of freeze-dried HMW DOM was obtained that was 31% C (⫺21.6‰) and 2.8% N (6.9‰) with a C/N ratio of 12.9, representing 20% of the DOC in the original raw seawater.
The polysaccharide fraction of HMW DOM was concentrated by anion-exchange chromatography. A glass column (2.2-cm inside diame-ter) was slurry packed with 16 g of Bio-Rex 5 (Bio-Rad Corp.) resin (chlo-ride form) and washed three times with 30 ml of 0.5 NaOH to convert the resin to hydroxide form. The column was then rinsed with water (80 ml) to a pH of ~6. HMW DOM (0.5 g) dissolved in 5 ml of water was applied to the column, and the carbohydrates were recovered by washing the column with 80 ml of water. Cations were removed by stirring with 1 g of Bio-Rex 50W-X8 resin for 1 h. The sample was filtered and freeze-dried three times to yield a fluffy white material.1H NMR analysis of a
concen-trate sample was done to ensure that no methanol (⬍3 nmol/10 mmol of HMW DOC), formaldehyde, or formic acid was present in the sample.
Internal standard synthesis.Construction of the internal RNA stan-dards was similar in approach to protocols described in references 23 and 52, with the exception that the DNA templates used forin vitro transcrip-tion (IVT) were generated directly from genomic templates (in this case, Sulfolobus solfataricus) via PCR amplification with T7 promoter incorpo-ration. Regions of theS. solfataricusgenome with little to no homology with the NB0046 genome were identified. Primers targeting these regions were synthesized and used for PCR amplification and T7 promoter incor-poration (see Table S4 in the supplemental information for the primer sequences used). The RNA internal standards were generated from the template DNA amplicons via T7 RNA polymerase IVT with the MEGAscript High Yield Transcription kit (Ambion). The standards were quantified, pooled into groups, and added to the cell samples as shown in Fig. 3A. See Text S1 in the supplemental material for detailed information on standard construction, addition, and recovery.