Column tests of nitrate breakthrough
behavior in subsurface sediments to
understand transport in the root-zone
Becky Haworth and Emma Goodwin
A Senior Project Presented To
The Faculty of the Natural Resources Management and Environmental Sciences Department California Polytechnic State University, San Luis Obispo
In Partial Fulfillment Of the Requirements for the Degree Environmental Earth Science; Bachelor of Science
Column tests of nitrate breakthrough behavior in subsurface
sediments to understand transport in the root-zone
Becky Haworth and Emma Goodwin
Natural Resources Management & Environmental Sciences Department, California
Polytechnic State University, San Luis Obispo, California
Introduction
Nitrate has become an increasingly ubiquitous pollutant in surface and groundwater, posing a threat to hu-man health and ecosystems. Nitrogen is a necessary nutrient for plant growth and is limiting in hu-many soils. As a result, farmers often add nitrogen to soil in a usable form such as nitrate, nitrite, or ammonia through the addition of fertilizer. Intensification of agriculture due to the need to feed Earth’s growing human popu-lation has become a threat to natural systems (Vitousek et al., 1997). Nitrates can get into water by direct runoff from chemical fertilizer and also from livestock manure, another common soil fertilizer. Groundwater, in comparison to surface water, has a high residence time, meaning nitrogen inputs will continue to decrease groundwater quality as long as humans continue to interfere with the nitrogen cycle (Vitousek et al., 1997). Van Meter et al. (2016) found evidence that nitrate accumulation in the root zone underlying agricultural fields accounts for missing nitrogen that occurs in mass balance studies of N. This study highlighted the hydrologic legacy of dissolved N in groundwater, defining hydrologic time lag as the average time it takes for dissolved nitrogen to be transported from the point of application to the point of concern (Van Meter et al., 2016). This accumulation, in combination with the time lag theory, explains the high nitrate values that have remained in watersheds despite reductions in N inputs (Van Meter et al., 2016). Excess nitrogen in water bodies can lead to algal blooms and subsequent eutrophication, which can be devastating to a large number of freshwater species. In humans, excess nitrates in drinking water can restrict oxygen transport in the bloodstream, which is particularly harmful to unborn babies (Manassaram et al., 2007). The Maximum Contaminant Level (MCL) for nitrate concentrations in drinking water is 10 milligrams per liter (mg/L) as N or 45 mg/L as NO−3. This value is most commonly exceeded in shallow aquifers underlying agricultural areas (Dubrovsky et al., 2010). Additionally, the cost of nitrate contamination in groundwater can have extreme economic consequences relating to nitrate clean up, fertilizer loss through leaching, and mitigation measures. It is predicted that the total cost for safe drinking water solutions translates to $5-$9 per irrigated acre per year or $100-$180 per ton of fertilizer nitrogen applied (Harter and Lund, 2012).
Approach
Materials and Methods
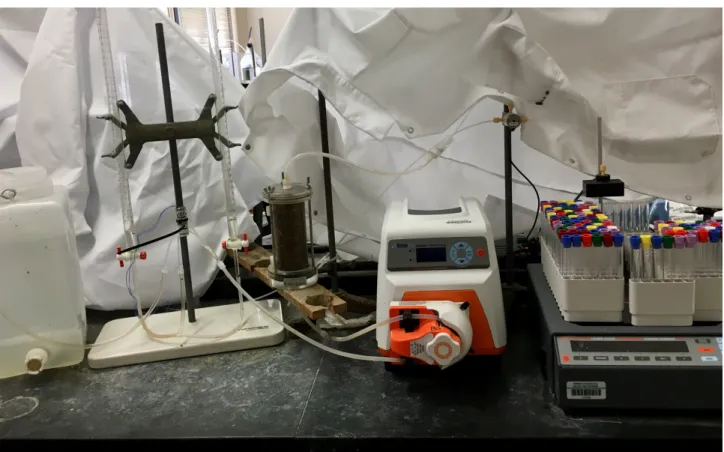
In this study, a local soil from Chorro Creek was collected, tested, and compared to one sand standard. Cal Poly soils were initially chosen for this testing, but after multiple attempts were found to be too clay rich to allow water transport in this setup. The sand standard and Chorro Creek soil were both tested at three different flow rates. In this column breakthrough experiment, the setup was as follows. Soils were packed into a permeameter, 0.1524 cm in length, ensuring limited air bubbles were present prior to testing. A container holding water was fed through a tube to the KrosFlo peristaltic pump where it was pumped into the soil permeameter. For the Chorro Creek sediments, this container held 0.005 M CaCl2 solution. This
solution aimed to minimize dispersion of the colloidal material and maintain innate flow paths within the soil. For the sand standard testing, deionized water was used. The effluent was then either discharged or diverted to the Spectrum Spectra/Chrome Fraction Collector CF-2. Initially, the diluted CaCl2solution was
run through the system to flush out initial and residual nitrate in the soil from previous testing. Adjacent to the water containers were two 100 mL burettes containing dilute KNO3 solution. A solenoid valve was
used to switch the inflow source from the water container to the nitrate burettes. This allowed for an easy transition between DI/dilute CaCl2solution flush and KNO3solution flow during testing. The experimental
setup is shown in Figure 1.
Figure 1: Experimental setup of breakthrough experiments, described from left to right: water container holding flush solution; two 100 mL burettes containing dilute KNO3 solution; soil permeameter; KrosFlo
Procedure
Sample Collection
During the initial flush the peristaltic pump was programmed to a set number of revolutions per minute (rpm) and the fraction collector was programmed to collect samples of effluent in 13 mm test tubes. After at least 18 collections, the inflow was switched using the solenoid valve and a solution of KNO3 diluted to
around 62 mg/L was pumped through the soil as samples were continuously being collected. The average flow rate was measured by timing three 10 mL intervals in the source burette as nitrate was pumped through, or by measuring the volume collected in the test tubes after the test was complete (collection volume/time per collection). When the amount of KNO3 solution in the burettes reached almost 0 mL, the valve was
switched back to begin flushing the system again with deionized water for the sand standard sample and dilute CaCl2 solution for Chorro Creek sediments, until around 100 test tubes were filled by the fraction
collector. For the sand standard, every 5th test tube was tested with the HANNA 96786C Nitrate ISM photometer to find the nitrate concentration in mg/L. For the Chorro Creek sediments, every test tube was measured.
Sample Analysis
Before testing, a calibration check on the photometer was performed to ensure measurement consistency. Each sample was diluted with deionized water, to ensure an exact 10 mL of solution for the photometer cuvette. When samples collected were not over 5 mL of solution, a dilution was used to ensure 10 mL in the cuvette. For example, the Chorro Creek sediment test run at 25 rpm collected 1.9 mL per 10 seconds of collection, so the testing effluent was diluted with 8.1 mL of deionized water. Once the solution was effectively diluted, the cuvette was cleaned with a microfiber cloth and placed into the photometer. The photometer was first zeroed with the unreacted sample to compensate for sample turbidity or color. It was then removed and a packet of powder containing Cadmium reagent was added to the cuvette. As soon as the cuvette was sealed, the cuvette was vigorously shaken for 10 seconds, then gently repeatedly inverted for 50 seconds. The cuvette was again cleaned with a microfiber cloth and placed into the photometer for 3 minutes while the sample reacted with the reagent, this nitrate value could then be measured and recorded. This procedure was repeated for each sample collected.
Results
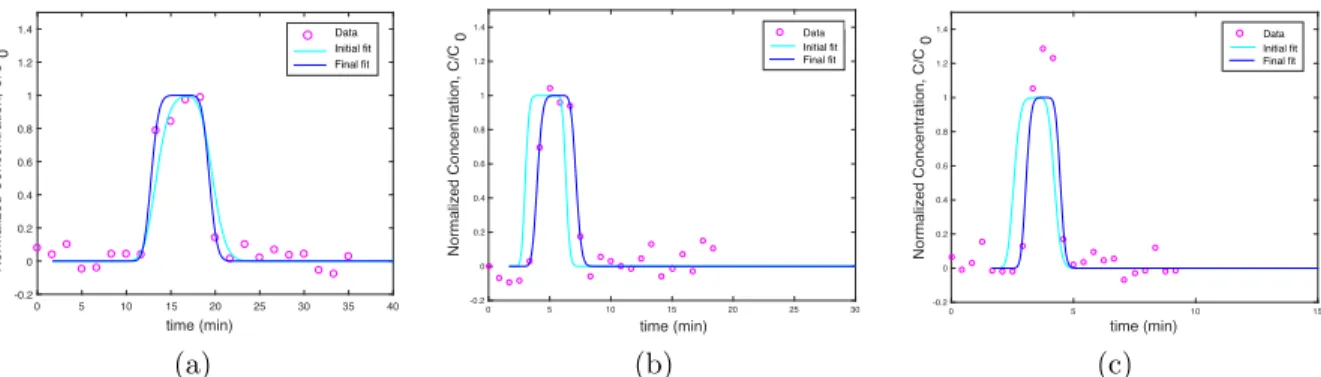
Three tests run with the sand standard at 20, 40, and 60 rpm produced results that demonstrated a square shaped curve with minimal dispersion of arrival and elution waves, and which peaked at the concentration of the injected nitrate (Figure 2). Nitrate concentrations remained at background levels and then quickly increased, peaked during injection, and decreased during elution back to zero. When these results were analyzed in MATLAB, the dispersivity value, which explains how diffuse the leaching front is, was very small, as expected for a sand standard (Table 1).
Two tests run at 50 and one at 75 rpm using Chorro Creek sediment followed a similar but more dispersed bell shaped curve to the sand control tests (Figure 3). The two tests run at 50 rpm differ by the amount of KNO3 solution injected. At 25 rpm, the overall curve is bell shaped, but individual values show a cyclical
pattern that perhaps relates to pumping by the peristaltic pump (Figure 3, a).
The raw data collected were then analyzed by fitting to a model curve in MATLAB to estimate transport properties of the soil, namely tortuosity factor (ω) and dispersivity (α) (Table 1). The equation of the model is shown below.
C(t) =C0 2
erfc
L−vt
2√Dt
+ exp
vL
D
erfc
L+vt
2√Dt
WhereLis the sample size, vis velocity,tis time, andC0 is the injected concentration. Dis the dispersion
coefficient which is described by the equation D =α| v | +ωD0, with ω being tortuosity factor, v being
of the samples were scaled to account for the dilution and then divided by the concentration of the KNO3
reference solution. This value was plotted on the y-axis with time plotted on the x-axis of graphs. In addition, based on the comparison of flow of nitrate solution through a sand control and flow through the Chorro Creek soil, a difference between injected and peak concentration of nitrates exist. In the sand control, there is no decrease apparent from the starting concentration to the peak concentration.
Soil Type RPM ω α(m) Sand 20 8.61 1.70×10⁻⁴ Sand 40 10.1 5.40×10⁻⁴ Sand 60 10.1 2.00×10⁻⁴ Chorro Creek 25 0.700 5.10×10⁻³ Chorro Creek 50 0.703 4.87×10⁻³ Chorro Creek 50 0.743 9.14×10⁻³
Chorro Creek 75 0.652 8.68×10⁻³
Table 1: Tortuosity factor (ω) and dispersivity (α) estimates for sand standard and Chorro Creek sediments.
Discussion
Our study questions ask how nitrates are transported through subsurface sediments, and whether soil prop-erties allow nitrates to break down as they move through the subsurface (especially the root zone and below), and if so, whether differing velocities affect the rate of microbial utilization of nitrates. By looking at soil properties such as dispersivity, it can be determined how nitrate moves through and accumulates in the subsurface sediment. These values were determined by modeling the following soil dispersion equation in MATLAB.
D=α|v|+ωD0
Dispersivity (α) is a property of a porous medium, such as substrate, that determines dispersion characteris-tics of the medium. Dispersivity relates pore velocity to the dispersion coefficient of nitrate (D0), and is one
of the most important transport parameters for a soil. Additionally, it is possible to predict how this may relate to the ability of microbes to do reductive work by utilizing the nitrates. In the sand samples, a small dispersivity value suggests that the nitrate did not disperse during transport through the substrate. For a soil with a similar dispersivity found in the field, all of the nitrate would likely be flushed out and enter into groundwater. Such rapid transport does not allow for retention of nitrate in the subsurface and therefore, not enough time for microbial breakdown to occur. However, in the Chorro Creek soil, the dispersivity value was found to be much higher, suggesting that in this sediment nitrate was able to disperse through the sample. In the field, it would take time for all of the nitrate to leach into groundwater, as much of the nitrate would get left behind. This would allow for microbial activity and reduction of nitrate due to microbial utilization. Higher dispersivity indicates a more diffuse leaching front.
In relation to the soils we intended to study, these results suggest that higher dispersivity values in soil allow for greater dispersion of nitrate and higher possibility for microbial utilization. To prevent nitrate from entering into groundwater, management practices that alter dispersivity such as tillage or addition of organic matter may be implemented.
References
Dubrovsky, N. M., Burow, K. R., Clark, G. M., Gronberg, J., Hamilton, P. A., Hitt, K. J., Mueller, D. K., Munn, M. D., Nolan, B. T., Puckett, L. J., et al., 2010. The quality of our nation’s waters-nutrients in the nation’s streams and groundwater, 1992-2004. Tech. rep., US Geological Survey.
Harter, T., Lund, J., 2012. Addressing nitrate in californias drinking water: Executive summary. Addressing Nitrates in California’s Drinking Water.
Manassaram, D. M., Backer, L. C., Moll, D. M., 2007. A review of nitrates in drinking water: maternal exposure and adverse reproductive and developmental outcomes. Ciencia & saude coletiva 12, 153–163. Van Meter, K. J., Basu, N. B., Veenstra, J. J., Burras, C. L., 2016. The nitrogen legacy: emerging evidence
of nitrogen accumulation in anthropogenic landscapes. Environmental Research Letters 11 (3), 035014. Vitousek, P. M., Aber, J. D., Howarth, R. W., Likens, G. E., Matson, P. A., Schindler, D. W., Schlesinger,
0 5 10 15 20 25 30 35 40 time (min) -0.2 0 0.2 0.4 0.6 0.8 1 1.2 1.4
Normalized Concentration, C/C
0
Data Initial fit Final fit
0 5 10 15 20 25 30
time (min) -0.2 0 0.2 0.4 0.6 0.8 1 1.2 1.4
Normalized Concentration, C/C
0 Data
Initial fit Final fit
0 5 10 15
time (min) -0.2 0 0.2 0.4 0.6 0.8 1 1.2 1.4
Normalized Concentration, C/C
0 Data
Initial fit Final fit
(a) (b) (c)
Figure 2: Concentration of nitrate as it is transported through a sand standard at different flow velocities (a. 20 rpm, b. 40 rpm, c. 60 rpm). Data resembles a square wave, indicating a rapid, non disperse leaching front.
0 5 10 15 20 25 30
time (min) 0
0.5 1 1.5
Normalized Concentration, C/C
0
Data Initial fit Final fit
0 10 20 30 40 50 60
time (min) 0
0.5 1 1.5
Normalized Concentration, C/C
0
Data Initial fit Final fit
(a) (b)
0 5 10 15 20 25 30
time (min) 0
0.5 1 1.5
Normalized Concentration, C/C
0
Data Initial fit Final fit
0 2 4 6 8 10 12
time (min) 0
0.5 1 1.5
Normalized Concentration, C/C
0
Data Initial fit Final fit
(c) (d)