In the Pursuit of Sons: Additional Births or Sex-Selective
Abortion in Pakistan?
Batool Zaidi and S. Philip Morgan
Sociology Department and Carolina Population Center, The University of North Carolina at Chapel Hill
Abstract
Even though Pakistan is a highly patriarchal society, it has not featured prominently in studies focusing on sex-selective abortion and sex ratios at birth. But with fertility declining and existing strong son preference—Pakistan has one of the highest desired sex ratios in the world—how will Pakistani families respond? In the pursuit of sons, will they have additional children or resort to sex-selective abortions? Or is there evidence that the pursuit of sons is weakening? Using data from three rounds of the demographic and health survey, we show clear evidence of son preference in fertility intentions, patterns of contraceptive use and parity progression ratios. More specifically, we find pervasive evidence that Pakistanis continue childbearing to have a son, to have more than one son and to have at least one daughter. We do not find consistent and convincing evidence that sex ratios at birth (which indicate sex-selective abortion) are increasing.
When “the total number of children couples desire falls more rapidly than the total number of desired sons” (Das Gupta and Bhat 1997), the pursuit of sons intensifies. Despite declining family size and persistent gender inequality, there are few Muslim countries among those with elevated sex ratios (providing unambiguous evidence of sex-selective
abortions).1 In part, this may reflect the strict ban on abortion services in most of these
countries, supported by Islamic restrictions/taboos against abortion. Pakistan, with its high abortion rate (albeit, illegal still) and strong cultural history shared with north India (which has some of the highest sex ratios in the world), could be a Muslim exception. Are Pakistani couples responding to the tension between lower fertility and the desire for sons in ways similar to the country's Indian and Chinese neighbors? If so, then Pakistan will experience high sex ratios, leading to a marriage squeeze and possibly other social problems (Dyson 2012; Guilmoto 2011; Hesketh and Xing 2006).
Most research on sex ratio imbalances has focused on China, India, and South Korea, where national sex ratios at birth have been elevated from normal levels of 106 (boys to 100 girls) to levels as high as 110, 119, and 115, respectively (Hesketh and Zing 2006). Recently, elevated sex ratios have been reported in other Asian countries and beyond, for example, Albania, Armenia, Azerbaijan, Georgia (Duthé et al. 2012), Nepal (Frost 2013), and Vietnam (Guilmoto 2012). Should Pakistan be included in this set?
1Albania and Azerbaijan, both Muslim-majority countries, recently experienced elevated sex ratios at birth. However, both are secular
HHS Public Access
Author manuscript
Popul Dev Rev
. Author manuscript; available in PMC 2017 December 01.Published in final edited form as:
Popul Dev Rev. 2016 December ; 42(4): 693–710. doi:10.1111/padr.12002.
A
uthor Man
uscr
ipt
A
uthor Man
uscr
ipt
A
uthor Man
uscr
ipt
A
uthor Man
uscr
Alternatively, Pakistani couples could continue pursuing sons by having additional children, but at the cost of larger family sizes and underinvestment in daughters, a pattern recently documented in Turkey (Altindag 2016) and found in earlier studies in Pakistan (Hussein, Fikree, and Berendes 2000; Muhammad 2009. Elevated fertility levels will slow Pakistan's movement toward replacement-level fertility. At Pakistan's current slow pace of fertility decline, it will reach replacement level in approximately 35 years. By this time its population will have increased by more than a hundred million to around 300 million, maintaining its rank as one of the half-dozen most populous countries in the world (UN Population Prospects 2015). This population growth would provide additional challenges for a country that ranks in the bottom quartile of the Human Development Index (indicating low levels of health, wealth, and education) and in the top quartile of the gender inequality index
(indicating major disadvantages for girls and women).2 Is this Pakistan's likely future path?
The fertility transition and the transition in sex preference
When fertility is high, son preference influences fertility behavior only modestly even in strongly patriarchal societies. With many births, the probability that a woman has at least one son is very high. For example, with a family size of six, the probability of being sonless is one percent; when the average family size falls to three children, the probability of being sonless increases to 12 percent (Bongaarts and Potter 1983, Ch. 9). With every one-child reduction in the average family size, the probability of being sonless doubles (Guilmoto 2009).
Bongaarts (2013) offers a model of the “transition in son preference” that tracks three different sex ratios. First, the desired sex ratio at birth (DSRB) is estimated from Demographic and Health Survey (DHS) responses regarding the respondent's “ideal” number of sons and daughters. This sex ratio reflects the strength of son preference. The second measure is the sex ratio at birth (SRB), which provides the first clues regarding how sons are pursued. An elevated SRB is an “unambiguous indication” that sex-selective abortion is being used (Bongaarts 2013: 193). An alternative strategy, and one not dependent upon recent technologies that can determine the sex of the fetus, is to have additional births in the pursuit of sons. While this latter strategy does not alter the overall SRB, it strongly affects the sex ratio at last birth (SRLB), since couples who have a son stop childbearing and those who have daughters do not.
Bongaarts (2013: Figure 10, reproduced here as Figure 1) posits that these sex ratios will change in the following way. The DSRB, signaling the underlying strength of patriarchy/ preference for sons, is initially high. With fertility decline, the gender bias emerges first in the SRLB, as couples use sex-specific stopping strategies (transition stage: Mid). As fertility falls further, in countries where abortion is available/acceptable the SRB begins to increase as well (transition stage: Late). Note that this emergence of gender bias in the SRLB and SRB can occur despite the beginning of declines in the DSRB. With social and economic
2For a description of the Human Development Index, see http://hdr.undp.org/en/statistics/hdi/. For a description of the Gender
Inequality Index, see http://hdr.undp.org/en/statistics/gii/.
A
uthor Man
uscr
ipt
A
uthor Man
uscr
ipt
A
uthor Man
uscr
ipt
A
uthor Man
uscr
development (if accompanied by greater gender equality), the DSRB declines sharply and both the SRB and SRLB follow suit.
Bongaarts (2013) shows that Pakistan has a modest SRB (using UN estimates), but its DSRB and SRLB are among the highest for countries with available DHS data. Guilmoto (2009) uses survey data and estimates that for 2003–07, Pakistan has a SRB in the range of 109– 112, an estimate above normal but with a large confidence interval given the number of births available for analysis. Thus, there is the suggestion of significant sex-selective abortion in Pakistan. This evidence and logic places Pakistan in the mid-transition phase of Bongaarts's son preference transition model (see Figure 1). Below, we explore in greater detail the fit of Pakistani data to Bongaarts's model.
The Pakistani experience
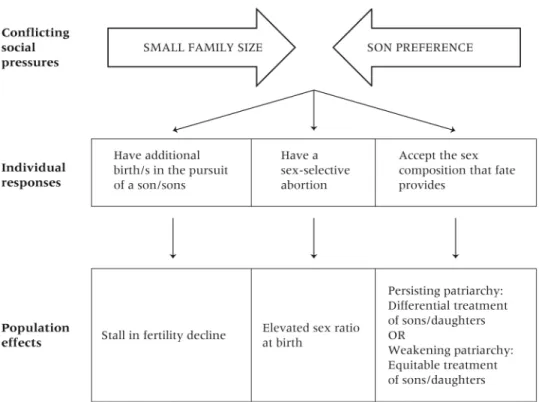
Pakistan provides a case study of the behavioral responses to the intensification of son preference—the pursuit of sons in the face of declining family size. Figure 2 depicts this tension, the possible behavioral responses, and the consequences of these responses.
Son preference—Despite modest improvements, the preferential treatment of sons is ubiquitous in Pakistan. Gender differentials in children's health and education are lessening but remain stark. Nearly twice as many young women (aged 15–24) never attend school as young men, enrollment rates at both the primary and secondary levels are lower for girls, and girls drop out of school at a higher rate than do boys (Zaidi et al. 2012). Preferential treatment for boys begins before birth. Bharadwaj and Lakdawala (2013) find that women are more likely to get prenatal checkups and take iron pills when pregnant with a boy. These indicators of discrimination are higher in areas with more intense son preference. After birth, girls in Pakistan are subject to benign neglect: a girl between ages 1 and 5 years has a 30 to 50 percent greater chance of dying than a boy, largely because of differences in nutrition, preventive care, and health-seeking behavior (Fikree and Pasha 2004). The most common causes of under-five deaths for boys are related to neonatal complications, while for girls the most common cause is infectious disease.
Son preference in a highly patriarchal society like Pakistan is certainly not surprising and is well documented. Pakistan had the second highest DSRB among 61 developing countries, with levels comparable to states in northern India (e.g., 150 for Bihar, see Bongaarts 2013). Clearly, the motivation for sons is strong in Pakistan.
Smaller family size—While most neighboring countries began experiencing fertility decline before the 1980s, fertility rates in Pakistan remained above six births per woman until the late 1980s/early 1990s. It is widely accepted that the fertility transition in Pakistan began at this point (Sathar and Casterline 1998). Despite a significant drop after the onset, overall fertility in Pakistan declined slowly throughout the 1990s and remained at nearly five births (total fertility rate [TFR] of 4.8) births per woman as late as 2000–01. In the last decade, however, Pakistan's TFR has declined further and is estimated to be 3.8 in 2012 and is as low as 3.2 in urban areas (NIPS 2013). Women in Pakistan are increasingly facing the fertility squeeze that makes achieving sex preferences difficult without behavioral change.
A
uthor Man
uscr
ipt
A
uthor Man
uscr
ipt
A
uthor Man
uscr
ipt
A
uthor Man
uscr
Behavioral responses—How are Pakistani women and families responding to the pressures to have fewer children while bearing sons? As depicted in Figure 2, given intense patriarchy (embodied in son preference) and the desire for smaller families, women/families can have more children, use selective abortion to meet both size and compositional fertility goals, or accept the gender composition that fate provides. Years ago, Davis and Blake (1956) argued that persons behave in ways that involve the least institutional reorganization. Given that patriarchy is deeply entrenched in Pakistani society and institutions, we
hypothesize (consistent with Figure 1) that women will respond either by continuing to have additional births until they have the desired number of sons, or by resorting to sex-selective abortions to ensure the desired composition at lower parities.
According to Bongaarts (2013), Pakistan had the fifth highest SRLB. A high SRLB is a sensitive indicator of differential stopping behavior and can be explained entirely by differential birth control. The contraceptive prevalence rate (CPR) increased rapidly from around 11 percent in 1991 to 33 percent by 2003 but showed a modest decline in use to 29 percent by 2007. The most recent round of the Pakistan Demographic and Health Survey (PDHS 2012–13) reports a CPR of 35 percent. Stalling contraceptive prevalence rates and the consequent slowdown of fertility decline may indicate that women are having additional children in the pursuit of sons. Previous studies have also found that the number of living sons is associated with intentions to have additional children, intentions to use contraception, and subsequent fertility (Mahmood and Ringheim 1996; Sathar and Casterline 1998;
Casterline, Sathar, Haque 2001; Hussain, Fikree, and Berendes 2000; Muhammad 2009; Channon 2015).
While high SRLBs may indicate sex-selective abortion, elevated sex ratios at birth (SRB) are an unambiguous indication that sex-selective abortion is being used. To translate strong son preference (indicated by a high DSRB) into a high SRB, couples need to have the means to identify the sex of a fetus and access to abortion services. Contrary to the expectations of many analysts, abortion rates in Pakistan are high for an Islamic country that forbids abortion under all but extreme circumstances. A national study estimated that 890,000 abortions took place in 2002, suggesting 29 abortions per 1,000 women of reproductive age (Sathar, Singh, and Fikree 2007). Over the next decade, the estimated abortion rate almost doubled to 50 abortions per 1,000 women (Sathar et al. 2014). According to a study of women hospitalized for post-abortion complications, 20 percent of women who had an abortion had 0–2 children, and another 30 percent had 3–4 children (Vlassoff et al. 2009). Given that the ideal family size was close to four children, it is clearly possible that some of these abortions were for sex selection.
Further, the 2006–07 PDHS showed that ultrasound technology is widely available in urban and rural areas: 66 percent of women had an ultrasound examination during an antenatal checkup for their last pregnancy (NIPS 2008). Over the next five years, this proportion has increased to 89 percent (NIPS 2013). Thus, women have access to technology that can reveal the sex of the fetus.
In sum, all the prerequisites for sex-selective practice are in place. Family size is getting smaller, technology to determine the sex of the fetus is available, abortions are taking place
A
uthor Man
uscr
ipt
A
uthor Man
uscr
ipt
A
uthor Man
uscr
ipt
A
uthor Man
uscr
(albeit illegally and unsafely), and the preferential treatment of boys, anchored in strong patriarchy, remains pervasive. However, these prerequisites do not guarantee sex-selective abortions; it is possible that Pakistani women may change their sex preference (see Figure 2). Or, more likely, they could rely solely on differentially continuing childbearing (enlarge their family size) in order to achieve sex compositional goals.
Data
In the absence of recent census data, we use data from three rounds (1990–91, 2006–07, and
2012–13) of the Pakistan Demographic Health Survey.3 These data have been used in
several international studies on son preference and prenatal sex selection (Arnold, Kishor, and Roy 2002; Ebenstein 2007; Garenne 2008; Bongaarts 2013). The data include
information on the reproductive history, behavior, and intentions of women of reproductive age (15–49). The PDHS sample for 1990–91 included 6,611 ever-married women; these women reported 27,369 births. The 2006–07 sample was larger, containing information on 10,032 ever-married women and 39,049 births. The 2012–13 sample was larger still; it included 13,558 ever-married women and 50,238 births.
The PDHS birth histories identify the sex and birth order of each birth, allowing for the estimation of parity progression ratios by the sex composition of previous births. The data on intentions permit analysis of the relationship between son preference and planned future fertility. The detailed background indicators collected in the PDHS allow one to study these patterns across various population subgroups. And importantly, the three rounds of the survey permit a comparison of these measures over two decades during which Pakistan began its fertility transition.
Methods and measures
We focus first on differential stopping. In Tables 1–3 we examine, respectively, how sex composition of previous children influences the likelihood of intending more children, using contraception, and continuing childbearing. To assess the differentials in these outcomes by sex composition of previous children, we produce cross-classifications of each outcome (i.e., intent for another child, current contraceptive use, and progression to the next parity) by parity and sex composition of children. We then estimate log-linear models that capture the structure (or systematic variation) in these data. We choose a preferred model for the data (for each outcome) that captures the association between that outcome and sex composition in a parsimonious way. The preferred model captures the systematic and substantively important variation and provides expected (Exp.) odds ratios that can be compared with the
ones calculated from the observed data (Obs.). See Appendix A for details of this analysis.4
In subsequent analysis (Tables 4 and 5) we test for elevated sex ratios at birth and for significant variation in these sex ratios. We rely on a well-measured variable, sex of child,
3The 1990–91 DHS data were argued to have severely underestimated fertility rates (Juarez and Sathar 2001). The re-interview survey conducted to check data reliability did find evidence of underreporting of births, but none for sex differentials in consistency of reporting (Curtis and Arnold 1994). These problems suggest caution in interpreting the 1990–91 results but do not suggest a particular bias in key results presented here.
4Appendixes are available at the supporting information tab at wileyonlinelibrary.com/journal/pdr.
A
uthor Man
uscr
ipt
A
uthor Man
uscr
ipt
A
uthor Man
uscr
ipt
A
uthor Man
uscr
and a well-known relationship, i.e., the weak dependence of the sex of child on sex of previous children given no interventions. Bongaarts and Potter (1983) state that for most purposes, the sex of the next child can be considered as a random event with the probability
of a son and a daughter fixed at .512 and .488, respectively.5
In Table 4, we calculate sex ratios at birth and interpret high sex ratios (those significantly higher than 1.06) as unambiguous evidence of sex-selective abortions. Detecting small differences in the SRB can be difficult (Guilmoto 2009), and the substantively important differences we expect (say a change in SRB from 106 to 110 or 115) are statistically small (an odds ratio of 1.04 or 1.08, respectively). Precise estimates require a large number of births. For instance, a sex ratio of 106 calculated using survey data with a sample of 10,000
has a 95 percent confidence interval of 102–110 (Arnold, Kishor, and Roy 2002).6 We assess
whether an estimated SRB differs from normal (106) by determining whether it falls in the confidence interval of a normal SRB for that sample size. Additionally, chi-square tests are used to test whether SRBs vary across a set of subpopulations.
The fact that we rely on two-tailed significance tests, when our hypotheses are clearly linked to having more sons, means that the significance tests are conservative, i.e., the estimated standard errors are exaggerated. We deliberately rely on this conservative test to provide extra caution in rejecting the null hypothesis (i.e., that the sex ratios are normal).
In Table 5, we offer the strongest test of whether sex-selective technology is being used, given the data available in these three DHS surveys. This analysis uses the same methods and data structure as Tables 1–3. We examine all sex ratios (by parity and sex composition), searching for systematic variation consistent with expectations of sex-selective abortions.
Finally, to test whether Pakistan's “son preference transition” follows Bongaarts's template (see Figure 1), we also construct the DSRB and the SRLB (see Figure 3). For the DSRB we follow the methodology used by Retherford and Roy (2003). The calculation comes from the DHS question on the respondent's ideal number of boys and girls. Men's and women's preferences are given equal weight; for the survey rounds that do no include a male survey, the male DSRB is assumed to be higher (by 18 male births) than the calculated female DSRB, based on average difference for 23 DHS countries (Bongaarts 2013). We calculate the SRLB as the SRB for the last birth among women who report wanting no more children at the time of the survey.
Results
Evidence of differential stopping
Fertility intentions—A key determinant of stopping behavior is the intention to have another birth or not. Our interest focuses on differential reports associated with the current sex composition of children at each parity. Variation by sex composition is captured by the
5In initial analyses (not shown here), we made use of the slight dependency for the sex of the next birth to be like that of prior births (i.e., Ps= 51.45+ 0.3Ns – 0.5Nd, where Ps = percent sons; Ns = number of prior sons; Nd=number of prior daughters, see Bongaarts and Potter 1983: 204). However, because the probabilities under the assumption of independence lead to more conservative estimates of differential treatment (than those under the assumption of slight dependency), we only present the results assuming no dependency. 6Standard error= sqrt((PxQ)/N), where P and Q are the proportions boy and girl, and N is the sample size.
A
uthor Man
uscr
ipt
A
uthor Man
uscr
ipt
A
uthor Man
uscr
ipt
A
uthor Man
uscr
observed odds ratio of each composition compared to the category of having only boys (the reference category is indicated by a value of 1.00). To detect significant differences across parity, sex composition, and year, we choose a preferred model for the data (see Appendix A for details of model fitting and selection). The preferred model captures the systematic or structured variation in the table as a set of expected odds ratios. For instance, Table 1 shows, in 1991 at parity 1, an observed odds ratio of 1.10—indicating that the odds of intending another child are increased by a factor of 1.10 if the first child is a girl instead of a boy. This observed odds ratio varies substantially by year (2.31 and 1.52 in 2007 and 2013,
respectively). We focus on the expected odds ratio of 1.63 for all three years, i.e., the preferred model constrains stability in this effect across all three data waves: those with a daughter at parity 1 are estimated to be 1.63 times more likely to intend another child. Models that allowed variation across year did not provide an improved fit of model to data.
This table's pattern of association can be captured with a few additional expected odds ratios. At parity 2, 3, and 4, respondents with all girls are 3.67 times more likely to intend another child compared to those with all boys. This effect is constrained to be identical in all three years and reflects a persistent and strong desire for sons. At parity 3 and 4, those with only one son are also more likely to intend another child compared to those with all sons. This odds ratio is estimated as 1.68 in 1991 and as a weaker 1.20 in the later years. The remaining expected odds ratios, .80 and .57, indicate an increasing desire for at least one girl. In 1991, respondents at parity 3 and 4 who have one girl are less likely (by a factor of . 80) to intend another child compared to those with all boys. The magnitude of this reduction is greater in 2007 and 2013 (a factor decline of .57) compared to 1991.
Thus, the data on intentions clearly show dissatisfaction with having no sons, and, for those with three and four children, a modest aversion to having only one son. This result is clear and persistent evidence of son preference. But the respondents who are most satisfied at parity 3 and 4 (and thus so not desire more children) are those with two sons and at least one daughter. Previous research in Pakistan has hinted at the desire for daughters, or at least one daughter (Muhammad 2009; Hussain, Fikree, and Berendes 2000); Table 1 provides clear evidence.
Current contraceptive use—Data on current use of contraception reveal whether women are acting consistent with their intentions described above, i.e., are they less likely to be using contraception if they have daughters rather than sons? The relevant data are shown in Table 2. Again, our focus is on differential behavior depending upon the current sex composition of children. Our preferred model is similar to the one chosen for data on intent (Table 1). However, the odds ratios are substantially weaker. This is not surprising given the low level of contraceptive use in Pakistan. In 1991 at parity 2, 3, and 4 the odds of using contraception are lowered significantly (by factors of .69 to .80) if the respondent has mostly or only daughters. The differential use of contraception among those with all or mostly daughters does not change over time. These results provide clear evidence of the pursuit of sons—i.e., use of contraception is increased if one has sons. But again, we see at parity 3 and 4 that having all sons is not the most preferred sex composition: the odds of using contraception are increased by a factor of 1.17 if there are at least two sons and one
A
uthor Man
uscr
ipt
A
uthor Man
uscr
ipt
A
uthor Man
uscr
ipt
A
uthor Man
uscr
daughter. There is a desire (Table 1) and behavior (Table 2) consistent with preferences for having at least one daughter.
Parity progressions—Next, we analyze parity progression ratios for women who have had no birth in the last five years. We limit the sample to these women so that the
progression ratios reflect fertility behavior of women who have likely completed their
desired family.7 But unlike data in Table 1 and 2, the focus is not on current intentions or
behavior (prospective intentions or current use) but on past behavior captured in these three surveys.
Again our focus is on variation, in this case for parity progression, by the sex composition of previous children (see Appendix A for details of model selection). With the exception of parity 1 (where almost all women progress to the next parity), parity progressions are greater if the woman has only or mostly girls. Moreover, our preferred model allows these expected odds ratios to be stronger in 2007 and 2013 compared to 1991. For instance, at parity 3 or 4, women with all girls are more likely to have an additional birth, by a factor of 1.20 in 1991 but by a factor of 1.89 in 2007 and 2013. Also and as in Tables 1 and 2, there is evidence of dissatisfaction with only one son for those with three or four children; in 2007 and 2013 the odds of an additional birth are increased by a factor of 1.28 with only one son and two or three daughters compared to having all sons. Finally, again as in the previous tables, there is evidence for a limited balancing of sons and daughters. At parity 3 and 4, an additional child is less likely (by a factor of .82) if there are at least two boys and one girl compared to having all boys.
Thus, the data in Tables 1 through 3 tell a consistent story. Fertility intentions, contraceptive use, and parity progression all indicate a strong aversion to having only daughters and a preference at parities 3 and 4 for two sons. While it receives less attention, there is a secondary preference for a balance of boys and girls. At parities 3 and 4, women seem more satisfied with at least one girl compared to having all boys.
Evidence of sex selection
Table 4 shows the SRB for the five years preceding each survey. At the national level, the SRB is estimated at 101 in 1991 and 110 in 2007. Both estimates are within the 95 percent confidence interval for a normal SRB of 106. But the 110 value is just outside the 90 percent level and is consistent with the beginning of a shift toward an elevated SRB. In contrast, the 2013 data show a normal SRB of 104 for the five years preceding the survey. These estimated SRBs provide no evidence of a secular trend toward elevated sex ratios.
To determine how likely it is that the elevated SRB estimated from the 2007 survey indicates widespread sex-selective abortions, we carried out three different analyses. First, we used retrospective birth history from the 2013 survey to provide a second estimate for the five-year period prior to the 2007 survey. This estimated SRB was nearly identical to the one calculated from the 2007 data and shown in Table 4 (results are in Appendix B). Thus, the
7Analysis is limited to women with no births in the last five years in order to capture women who have completed childbearing. Women who have not had births in the last five years are unlikely either to intend or to have additional children.
A
uthor Man
uscr
ipt
A
uthor Man
uscr
ipt
A
uthor Man
uscr
ipt
A
uthor Man
uscr
elevated sex ratio at birth for the 2002–06 period is unlikely due to data quality issues (as suggested by other studies; see Sathar et al. 2015).
Next, we calculate the SRBs for various sub-populations for all three surveys. We ask whether SRB are elevated for groups most likely to be practicing sex-selective abortions. As seen in Table 4, in 1991 and again in 2013 we find no clear evidence of elevated sex ratios
for any sub-population (e.g., by region or parity8). Elevated SRBs in 2007 are frequently not
significant because of small Ns, but elevated levels are found for subgroups consistent with the emergence of sex-selective abortion—e.g., for births in urban areas. One would expect that the sex ratio would increase first in urban areas given that women in these areas desire fewer children and have greater access to facilities providing prenatal screening and abortion (Guilmoto 2007; Filmer, Friedman, and Schady 2009). The SRB for 2007 is also higher at parities that reflect the ideal family size range, i.e. parity 2–4. But these patterns by rural/ urban residence and birth order, ones suggestive of sex-selective abortions, are not replicated if we calculate estimates for this same time period using the 2013 data (results not shown here). In sum, there is mixed evidence for a modest increase in the SRB in the 2002–06 period.
Finally, we offer the strongest test of whether sex-selective technology is being used, given the data available in these three DHS surveys. This analysis builds on the results in Tables 1– 3 and uses the same methods and data structure. Analyses above clearly showed the sex compositions to which Pakistani women were averse. We use data in Table 5 to ask whether the sex ratios for these women are higher than for women who already have sons. We thus focus on women most likely to use sex-selective abortion and compare them to others who have little reason to do so. The key result is our inability to reject the null hypothesis of no difference across categories of women with favorable and unfavorable sex compositions. There are observed differences in this table suggestive of sex-selective abortion (i.e., abnormally high sex ratios and odds ratios calculated from them) but no consistent patterns confirming this. Thus, all expected odds ratios in Table 5are 1.0.
Summary and discussion
How does Pakistan's experience fit with the stylized patterns shown in Figure 1? In Figure 3 we estimate Pakistan's desired sex ratio at birth (DSRB) in the 130–140 range, quite high. There may be some decline between the latter two years (marginally significant at the .05 level). Note that the sex ratio at last birth (SRLB) is also quite high, in the 120–130 range with no evidence of change. This indicator shows clear evidence of a behavioral response to sex preference, without indicating the mechanism (additional births or sex-selective abortion). The sex ratio of all births (SRB) is elevated only for 2007 and only modestly. Thus there is no clear evidence for a trend toward sex-selective abortion.
Substantively, therefore, patriarchy remains strong, as indicated by the desired sex ratio (DSRB) and data on prospective intentions (Table 1). The desire and intent to have sons is
8The estimated sex ratio for first births in 1991 is 115. This estimate is not statistically different from a normal sex ratio (of 105) and it is not at a family-building stage where one would expect an elevated sex ratio. We attribute the high value of this estimate to sampling variation.
A
uthor Man
uscr
ipt
A
uthor Man
uscr
ipt
A
uthor Man
uscr
ipt
A
uthor Man
uscr
unmistakable. Second, the willingness to act on these preferences is also unmistakable. The SRLB will likely increase in the future as increased use of contraception allows for differential continuation of childbearing based on sex of previous children. Our analysis of contraception shows that it is used for differential continuation of childbearing based on sex of previous children. Overall, our data show pervasive evidence that Pakistanis continue childbearing to have a son, to have more than one son, and to have at least one daughter.
Pakistan's experience diverges most sharply from the template in Figure 1 in the absence of any sustained increases in the SRB—a change that would signal widespread use of sex-selective abortion. Is the Pakistani response indicative of the unacceptability of sex-sex-selective abortion or of abortion in general? Given the relatively high rates of abortion, the answer is likely to be the former. Intensive interviews conducted by the first author, carried out in 2014–15 with Pakistani women and physicians, suggest that hospitals often have informal rules against revealing the sex of the fetus during ultrasound exams. Interestingly,
administrators and doctors reported that these “don't tell” practices were aimed at avoiding confrontations with clients over erroneous results, rather than a fear of sex-selection practices. Likewise, interviews with medical professionals in a large Pakistani urban center found that sex-selective abortions are not perceived to be common practice (Sathar et al. 2015). Repeatedly doctors in this study reported that ultrasound could not reliably identify the sex of a fetus until the twelfth week of pregnancy and that abortions at that duration were not recommended or common practice.
The lack of evidence of sex-selective abortions is also in line with the results of studies comparing fertility behaviors of Hindu and Muslim communities in India, as well as the Indian and Pakistani diasporas in Europe and North America (Desai and Temsah 2014; Brekke 2013; Singh et al. 2010; Almond et al. 2013; Bhat and Zavier 2003). Lower sex ratios among Pakistani or Muslim communities in most of these studies did not reflect weaker son preference, rather just a greater reliance on continued fertility following only daughters. This reliance on differential stopping behavior is strongly visible in our results and shows no signs of weakening over time. It is likely one of the reasons Pakistan's fertility rate has been slow to decline further. Differential stopping has the potential to become even more widespread as more women gain access to contraception. Increased contraceptive use could lower fertility and family size norms further and thus increase the pressure to resort to sex-selective abortions.
Using either of these behaviors increases the likelihood of meeting the family's sex
preferences, but both can have negative consequences at multiple levels (see Figure 2). First, both strategies reinforce patriarchy and the importance of sons compared to daughters. Patriarchy (or other social structures) is reinforced when individuals enact behavior consistent with it. Pursuing sons reinforces patriarchy in the actor's “mind” and in the “world” – in the mind because patriarchal schemas are reified by their use and in the world as persons justify or signify to others that they use these ways of thinking and reasoning (see Johnson-Hanks et al. 2011). Thus, to the extent that patriarchy is problematic, so is the pursuit of sons that embody it.
A
uthor Man
uscr
ipt
A
uthor Man
uscr
ipt
A
uthor Man
uscr
ipt
A
uthor Man
uscr
The pursuit of sons also exacerbates demographic problems. Sex-selective abortion, although not widely used in Pakistan, would increase the sex ratio. In societies like Pakistan that highly value marriage, an imbalanced sex ratio implies that some men will be unable to find partners. A more immediate concern is the strategy of having additional births in the pursuit of sons. This strategy increases the birth rate and contributes to population growth. In a poor country with substantial inequality, the ability to invest in the next generation is hindered by more children at both the aggregate and family level. Finally, the pursuit of sons has negative consequences for children and especially girls. Additional births in the pursuit of sons create larger families, and children in these families face the dilution of resources available for each child—with daughters likely to feel the dilution of resources more intensely than do sons.
Supplementary Material
Refer to Web version on PubMed Central for supplementary material.
Acknowledgments
Notes: We thank Ted Mouw, Yong Cai, Ronald Rindfuss, Monica Das Gupta, John Casterline, and John Bongaarts for useful comments and discussion on the initial draft. We are grateful to the Carolina Population Center and its NIH/NICHD center grant (P2C HD050924) for general support and for its NIH/NICHD for training support (T32 HD007168).
References
Almond, Douglas, Lena, Edlund, Kevin, Milligan. Son preference and the persistence of culture: Evidence from South and East Asian immigrants to Canada. Population and Development Review. 2013; 39(1):75–95.
Altindag, Onur. Son preference, fertility decline, and the nonmissing girls of Turkey. Demography. 2016; 53(2):541–566. [PubMed: 26931324]
Arnold, Fred, Sunita, Kishor, Roy, TK. Sex-selective abortions in India. Population and Development Review. 2002; 28(4):759–785.
Prashant, Bharadwa j, Lakdawala, Leah K. Discrimination begins in the womb: Evidence of sex-selective prenatal investments. Journal of Human Resources. 2013; 48(1):71–113.
Bhat, PN Mari, Zavier, AJ Francis. Fertility decline and gender bias in northern India. Demography. 2003; 40(4):637–657. [PubMed: 14686135]
Bongaarts, John. The implementation of preferences for male offspring. Population and Development Review. 2013; 39(2):185–208.
Bongaarts, John, Potter, Robert G. Fertility, Biology, and Behavior: An Analysis of the Proximate Determinants. New York: Academic Press; 1983.
Brekke, Torkei. Religion and sex-selective abortion: Acomparative study of immigrants from South Asia to Norway. Diaspora Studies. 2013; 6(1):31–39.
Casterline, John B., Sathar, Zeba A., Haque, Minhaj ul. Obstacles to contraceptive use in Pakistan: A study in Punjab. Studies in Family Planning. 2001; 32(2):95–110. [PubMed: 11449867]
Channon, Melanie Dawn. Son preference, parity progression and contraceptive use in South Asia. Population Horizons. 2015; 12(1):24–36.
Curtis, Sian L., Arnold, Fred. Occasional Papers No 1. Calverton, MD: Macro International Inc; 1994. An evaluation of the Pakistan DHS Survey based on the Reinterview Survey.
Das Gupta, Monica, Bhat, PN Mari. Fertility decline and increased manifestation of sex bias in India. Population Studies. 1997; 51(3):307–315.
A
uthor Man
uscr
ipt
A
uthor Man
uscr
ipt
A
uthor Man
uscr
ipt
A
uthor Man
uscr
Davis, Kingsley, Blake, Judith. Social structure and fertility: An analytic framework. Economic Development and Cultural Change. 1956; 41(3):211–235.
Desai, Sonalde, Temsah, Gheda. Muslim and Hindu women's public and private behaviors: Gender, family, and communalized politics in India. Demography. 2014; 51(6):2307–2332. [PubMed: 25143018]
Duthé, Géraldine, Vallin, Jacques, Badurashvili, Irina, Kuyumjyan, Karine. High sex ratios at birth in the Caucasus: Modern technology to satisfy old desires. Population and Development Review. 2012; 38(3):487–501.
Dyson, Tim. Causes and consequences of skewed sex ratios. Annual Review of Sociology. 2012; 38:443–461.
Ebenstein, Avraham. Fertility choices and sex selection in Asia: Analysis and policy. 2007 Available at SSRN 965551.
Fikree, Fariyal F., Pasha, Omrana. Role of gender in health disparity: The South Asian context. BMJ. 2004; 328(7443):823–826. [PubMed: 15070642]
Filmer, Deon, Friedman, Jed Arnold, Schady, Norbert. Development, modernization, and childbearing: The role of family sex composition. World Bank Economic Review. 2009; 23:371–398.
Frost, Melanie. Falling sex ratios and emerging evidence of sex-selective abortion in Nepal: Evidence from nationally representative survey data. BMJ Open. 2013; 3:5.
Garenne, Michel. Situations of fertility stall in sub-Saharan Africa. African Population Studies. 2008; 23:173–188.
Guilmoto, Christophe Z. Characteristics of sex ratio imbalance in India and future scenarios. paper prepared for the 4th Asia and Pacific Conference on Sexual and Reproductive Health and Rights, India; New Delhi: UNFPA. 2007 Oct.
Guilmoto, Christophe Z. The sex ratio transition in Asia. Population and Development Review. 2009; 35(3):519–549.
Guilmoto, Christophe Z. Sex imbalances at birth: Trends, consequences, and policy implications. 2011.
https://www.unfpa.org/webdav/site/global/shared/documents/ Guilmoto_Revised_presentation_Hanoi_Oct011.pdf
Guilmoto, Christophe Z. Son preference, sex selection, and kinship in Vietnam. Population and Development Review. 2012; 38(1):31–54. [PubMed: 22833863]
Hesketh, Therese, Xing, Zhu Wei. Abnormal sex ratios in human populations: Causes and consequences. Proceedings of the National Academy of Sciences. 2006; 103(36):13271–13275. Hussain R, Fikree Fariyal F, Berendes HW. The role of son preference in reproductive behaviour in Pakistan. Bulletin of the World Health Organization. 2000; 78(3):379–388. [PubMed: 10812738] Juarez, Fatima, Sathar, Zeba. Changes in family formation in Pakistan. Zaba, B., Blacker, J., editors.
Brass Tacks London: Oxford University Press; 2001.
Mahmood, Naushin, Ringheim, Karin. Factors affecting contraceptive use in Pakistan. Pakistan Development Review. 1996; 35(1):1–22. [PubMed: 12292564]
Muhammad, Ali. Does sex of children matter? Implications for fertility in Pakistan. Journal of Biosocial Science. 2009; 41(1):39–50. [PubMed: 18647438]
NIPS (National Institute of Population Studies). Pakistan Demographic and Health Survey 2006–07. NIPS; Islamabad: 2008.
NIPS (National Institute of Population Studies). Pakistan Demographic and Health Survey 2012–13 Preliminary Report. NIPS; Islamabad: 2013.
Retherford, Robert D., Roy, TK. National Family Health Survey Subject Reports, No 21. Mumbai: International Institute of for Population Sciences; 2003. Factors affecting sex-selective abortion in India and 17 major states.
Sathar, Zeba A., Casterline, John B. The onset of fertility transition in Pakistan. Population and Development Review. 1998; 24(4):773–796.
Sathar, Zeba A., Singh, Susheela, Fikree, Fariyal F. Estimating the incidence of abortion in Pakistan. Studies in Family Planning. 2007; 38(1):11–22. [PubMed: 17385379]
A
uthor Man
uscr
ipt
A
uthor Man
uscr
ipt
A
uthor Man
uscr
ipt
A
uthor Man
uscr
Sathar, Zeba A., Singh, Susheela, Rashida, Gul, Shah, Zakir, Niazi, Rehan. Induced abortions and unintended pregnancies in Pakistan. Studies in Family Planning. 2014; 45(4):471–491. [PubMed: 25469930]
Sathar, Zeba A., Rashida, Gul, Hussain, Sabahat, Hassan, Anushe. Evidence of Son Preference and Resulting Demographic and Health Outcomes in Pakistan. Islamabad: Population Council; 2015. Sewel, William H. A theory of structure: Duality, agency, and transformation. American Journal of
Sociology. 1992; 98:1–20.
Sewel, William H. Logics of History: Social Theory and Social Transformation. University of Chicago Press; 2005.
Singh, Narpinder, Pripp, Are H., Brekke, Torkel, Stray-Pedersen, Babill. Different sex ratios of children born to Indian and Pakistani immigrants in Norway. BMC Pregnancy and Childbirth. 2010; 10:40. [PubMed: 20682027]
United Nations, Department of Economic and Social Affairs, Population Division. World Population Prospects The 2015 Revision. Volume II: Demographic Profiles. ST/ESA/SER.A/380; 2015. Vlassoff, Michael, et al. Brief No 2. New York: Guttmacher Institute; 2009. Abortion in Pakistan. Zaidi, Batool, Sathar, Zeba, Haque, Minhaj ul, Zafar, Fareeha. The Power of Girls' Schooling for
Young Women's Empowerment and Reproductive Health. Islamabad: Population Council; 2012.
A
uthor Man
uscr
ipt
A
uthor Man
uscr
ipt
A
uthor Man
uscr
ipt
A
uthor Man
uscr
Figure 1. Expected patterns of sex ratio at birth (SRB), sex ratio at last birth (SRLB), and desired sex ratio at birth (DSRB) over the course of the transition in son preference SOURCE: Bongaarts 2013: Figure 10.
A
uthor Man
uscr
ipt
A
uthor Man
uscr
ipt
A
uthor Man
uscr
ipt
A
uthor Man
uscr
Figure 2. Possible responses to, and consequences of, conflicting pressures related to smaller family size and the desire for sons
A
uthor Man
uscr
ipt
A
uthor Man
uscr
ipt
A
uthor Man
uscr
ipt
A
uthor Man
uscr
Figure 3.
Trends in desired sex ratio (DSRB), sex ratio at last birth (SRLB), and sex ratio of all births (SRB): Pakistan DHS 1991, 2007, and 2013
DSRB: women below age 35; SRLB: births in 5 years preceding survey among women with intention to have no more children; SRB: births in 5 years preceding survey.
A
uthor Man
uscr
ipt
A
uthor Man
uscr
ipt
A
uthor Man
uscr
ipt
A
uthor Man
uscr
A
uthor Man
uscr
ipt
A
uthor Man
uscr
ipt
A
uthor Man
uscr
ipt
A
uthor Man
uscr
ipt
T ab le 1Odds and odds ratios of intention
a to ha
v
e another child by sex of pr
evious childr
en, parity
, and y
ear 1991 2007 2013 N Odds Ratio N Odds Ratio N Odds Ratio Obs. Exp. b Obs. Exp. b Obs. Exp. b P arity 1 Bo y 405 1.00 1.00 653 1.00 1.00 890 1.00 1.00 Girl 395 1.10 1.63 566 2.31 1.63 816 1.52 1.63 P arity 2 2 Bo ys 206 1.00 1.00 376 1.00 1.00 541 1.00 1.00 1 Bo
y, 1 Girl
383 0.88 1.00 660 0.86 1.00 1,046 0.99 1.00 2 Girls 168 3.34 3.67 287 3.59 3.67 399 2.72 3.67 P arity 3 3 Bo ys 116 1.00 1.00 198 1.00 1.00 263 1.00 1.00 2 Bo
ys, 1 Girl
349 0.71 0.80 539 0.71 0.57 832 0.62 0.57
2 Girls, 1 Bo
y 294 1.51 1.68 414 1.59 1.20 646 1.13 1.20 3 Girls 104 3.04 3.67 115 6.33 3.67 175 3.48 3.67 P arity 4 4 Bo ys 49 1.00 1.00 89 1.00 1.00 133 1.00 1.00 3 Bo
ys, 1 Girl
215 0.91 0.80 333 0.35 0.57 482 0.62 0.57 2 Bo
ys, 2 Girls
320 0.99 0.80 483 0.39 0.57 715 0.75 0.57
3 Girls, 1 Bo
y 192 1.71 1.68 241 1.08 1.20 405 1.49 1.20 4 Girls 40 7.56 3.67 56 4.68 3.67 87 5.00 3.67
a Currently married w
omen e
xcluding those declared infecund.
A
uthor Man
uscr
ipt
A
uthor Man
uscr
ipt
A
uthor Man
uscr
ipt
A
uthor Man
uscr
ipt
T ab le 2Odds and odds ratios of curr
ent contracepti
v
e use
a by sex of pr
evious childr
en, parity
, and y
ear 1991 2007 2013 N Odds Ratio N Odds Ratio N Odds Ratio Obs. Exp. b Obs. Exp. b Obs. Exp. b P arity 1 Bo y 421 1.00 1.00 663 1.00 1.00 910 1.00 1.00 Girl 406 1.78 1.00 573 0.84 1.00 829 0.80 1.00 P arity 2 2 Bo ys 211 1.00 1.00 386 1.00 1.00 553 1.00 1.00 1 Bo
y, 1 Girl
406 1.58 1.00 676 1.01 1.00 1,065 0.94 1.00 2 Girls 178 0.84 0.69 298 0.63 0.69 403 0.76 0.69 P arity 3 3 Bo ys 120 1.00 1.00 202 1.00 1.00 271 1.00 1.00 2 Bo
ys, 1 Girl
369 1.42 1.17 556 1.02 1.17 848 1.25 1.17
2 Girls, 1 Bo
y 301 0.72 0.80 422 0.84 0.80 658 0.86 0.80 3 Girls 109 0.64 0.69 116 0.62 0.69 180 0.65 0.69 P arity 4 4 Bo ys 50 1.00 1.00 92 1.00 1.00 136 1.00 1.00 3 Bo
ys, 1 Girl
221 0.98 1.17 339 1.39 1.17 493 1.03 1.17 2 Bo
ys, 2 Girls
330 0.80 1.17 497 1.27 1.17 731 0.94 1.17
3 Girls, 1 Bo
y 200 0.73 0.80 250 0.71 0.80 413 0.67 0.80 4 Girls 43 0.57 0.69 58 1.02 0.69 88 0.47 0.69
a Currently married w
omen.
A
uthor Man
uscr
ipt
A
uthor Man
uscr
ipt
A
uthor Man
uscr
ipt
A
uthor Man
uscr
ipt
T ab le 3Odds and odds ratio of parity pr
ogr
ession (PPR)
a by sex of pr
evious childr
en, parity
, and y
ear 1991 2007 2013 N Odds Ratio N Odds Ratio N Odds Ratio Obs. Exp. b Obs. Exp. b Obs. Exp. b P arity 1 Bo y 821 1.00 1.00 1,406 1.00 1.00 2,082 1.00 1.00 Girl 784 0.73 1.00 1,239 1.03 1.00 1,883 1.00 1.00 P arity 2 2 Bo ys 424 1.00 1.00 719 1.00 1.00 1,036 1.00 1.00 1 Bo
y, 1 Girl
701 0.84 1.00 1,236 0.92 1.00 1,863 1.06 1.00 2 Girls 350 1.10 1.20 530 1.36 1.89 811 2.14 1.89 P arity 3 3 Bo ys 220 1.00 1.00 335 1.00 1.00 443 1.00 1.00 2 Bo
ys, 1 Girl
479 0.63 0.82 903 0.97 0.82 1,280 0.80 0.82
2 Girls, 1 Bo
y 464 0.94 0.99 736 1.41 1.28 1181 1.33 1.28 3 Girls 146 1.49 1.20 242 2.34 1.89 359 2.09 1.89 P arity 4 4 Bo ys 103 1.00 1.00 138 1.00 1.00 175 1.00 1.00 3 Bo
ys, 1 Girl
286 0.82 0.82 480 0.83 0.82 666 0.62 0.82 2 Bo
ys, 2 Girls
383 0.66 0.82 691 0.95 0.82 995 0.90 0.82
3 Girls, 1 Bo
y 247 0.74 0.99 427 1.53 1.28 614 1.21 1.28 4 Girls 65 0.90 1.20 99 1.83 1.89 156 1.99 1.89
a Currently married w
omen with no birth in the last 5 years
A
uthor Man
uscr
ipt
A
uthor Man
uscr
ipt
A
uthor Man
uscr
ipt
A
uthor Man
uscr
ipt
T
ab
le 4
Sex ratios at birth in f
iv
e y
ears pr
eceding the sur
v
ey
1990
2007
2012
n
SRB
n
SRB
n
SRB
Ov
erall
6,426
101
9,112
110
*
10,739
104
Re
gion Urban
3,373
100
3,116
115
**
4,440
105
Rural
3,053
104
5,996
108
6,299
104
Birth order
1
1,126
115
1,880
108
2,423
107
2
1,021
106
1,673
110
2,116
107
3
944
99
1,397
125
**
1,717
100
4
817
94
1,165
113
1,360
103
5+
2,518
97
2,997
105
3,123
103
Assuming independence p(bo
y)=0.5145.
* p<0.1; **
p<0.05
→
106 signif
icantly dif
A
uthor Man
uscr
ipt
A
uthor Man
uscr
ipt
A
uthor Man
uscr
ipt
A
uthor Man
uscr
ipt
T ab le 5Sex of birth
a by sex of pr
evious childr
en, parity
, and y
ear 1991 2007 2013 N Odds Ratio N Odds Ratio N Odds Ratio Obs. Exp. b Obs. Exp. b Obs. Exp. b P arity 1 Bo y 528 1.00 1.00 863 1.00 1.00 1,133 1.00 1.00 Girl 493 0.98 1.00 810 1.18 1.00 983 0.95 1.00 P arity 2 2 Bo ys 262 1.00 1.00 389 1.00 1.00 470 1.00 1.00 1 Bo
y, 1 Girl
453 0.91 1.00 662 1.03 1.00 845 1.03 1.00 2 Girls 229 0.92 1.00 346 0.93 1.00 402 0.97 1.00 P arity 3 3 Bo ys 106 1.00 1.00 144 1.00 1.00 206 1.00 1.00 2 Bo
ys, 1 Girl
318 0.95 1.00 430 0.98 1.00 478 1.11 1.00
2 Girls, 1 Bo
y 302 1.07 1.00 455 1.02 1.00 513 0.97 1.00 3 Girls 91 0.87 1.00 136 1.45 1.00 163 0.89 1.00 P arity 4 4 Bo ys 51 1.00 1.00 61 1.00 1.00 69 1.00 1.00 3 Bo
ys, 1 Girl
170 0.92 1.00 230 0.58 1.00 241 0.62 1.00 2 Bo
ys, 2 Girls
265 1.33 1.00 331 0.78 1.00 384 0.69 1.00
3 Girls, 1 Bo
y 183 0.78 1.00 224 0.58 1.00 258 0.64 1.00 4 Girls 52 1.31 1.00 60 0.46 1.00 53 0.70 1.00
a Births in the 5 years preceding the surv
ey
.