Effects of Nitrogen Availability and Form on
Phytoplankton Growth in a Eutrophied
Estuary (Neuse River Estuary, NC, USA)
Emily K. Cira1*, Hans W. Paerl2, Michael S. Wetz3
1Department of Physical and Environmental Sciences, Texas A and M University–Corpus Christi, Corpus Christi, Texas, United States of America,2Institute of Marine Sciences, University of North Carolina at Chapel Hill, Morehead City, North Carolina, United States of America,3Department of Life Sciences, Texas A and M University–Corpus Christi, Corpus Christi, Texas, United States of America
Abstract
Nitrogen availability and form are important controls on estuarine phytoplankton growth. This study experimentally determined the influence of urea and nitrate additions on phyto-plankton growth throughout the growing season (March 2012, June 2011, August 2011) in a temperate, eutrophied estuary (Neuse River Estuary, North Carolina, USA). Photopigments (chlorophyllaand diagnostic photopigments: peridinin, fucoxanthin, alloxanthin, zeaxan-thin, chlorophyll b) and microscopy-based cell counts were used as indicators of phyto-plankton growth. In March, the phytophyto-plankton community was dominated byGyrodinium instriatumand only fucoxanthin-based growth rates were stimulated by nitrogen addition. The limited response to nitrogen suggests other factors may control phytoplankton growth and community composition in early spring. In June, inorganic nitrogen concentrations were low and stimulatory effects of both nitrogen forms were observed for chlorophylla- and diag-nostic photopigment-based growth rates. In contrast, cell counts showed that only crypto-phyte and dinoflagellate (Heterocapsa rotundata) growth were stimulated. Responses of other photopigments may have been due to an increase in pigment per cell or growth of plankton too small to be counted with the microscopic methods used. Despite high nitrate concentrations in August, growth rates were elevated in response to urea and/or nitrate addition for all photopigments except peridinin. However, this response was not observed in cell counts, again suggesting that pigment-based growth responses may not always be indicative of a true community and/or taxa-specific growth response. This highlights the need to employ targeted microscopy-based cell enumeration concurrent with pigment-based technology to facilitate a more complete understanding of phytoplankton dynamics in estuarine systems. These results are consistent with previous studies showing the sea-sonal importance of nitrogen availability in estuaries, and also reflect taxa-specific
responses nitrogen availability. Finally, this study demonstrates that under nitrogen-limiting conditions, the phytoplankton community and its various taxa are capable of using both urea and nitrate to support growth.
a11111
OPEN ACCESS
Citation:Cira EK, Paerl HW, Wetz MS (2016) Effects of Nitrogen Availability and Form on Phytoplankton Growth in a Eutrophied Estuary (Neuse River Estuary, NC, USA). PLoS ONE 11(8): e0160663. doi:10.1371/journal.pone.0160663
Editor:Christopher J. Gobler, Stony Brook University, UNITED STATES
Received:December 23, 2015
Accepted:July 22, 2016
Published:August 9, 2016
Copyright:© 2016 Cira et al. This is an open access article distributed under the terms of theCreative Commons Attribution License, which permits unrestricted use, distribution, and reproduction in any medium, provided the original author and source are credited.
Data Availability Statement:All relevant data are within the paper and its Supporting Information files.
Funding:This work was supported by the National Science Foundation [DEB1104598 to MSW and HWP;NSF.gov], the NC Dept. of Environment and Natural Resources (portal.ncdenr.org), and the Lower Neuse Basin Association (Neuse River Estuary ModMon Program;lnba.net). The funders had no role in study design, data collection and analysis, decision to publish, or preparation of the manuscript.
Competing Interests:The authors have declared
Introduction
In temperate and subtropical estuaries worldwide, phytoplankton growth can be controlled by factors such as nutrient and light availability, residence time, and grazing among others (e.g., [1–3]). Nitrogen (N) availability commonly limits estuarine phytoplankton growth, as strong correlations between N supply and phytoplankton production have been noted in many estuar-ies (e.g., [4–6]). As N loads have increased worldwide over the past century, harmful symptoms of eutrophication such as excessive chlorophyllalevels and increasing prevalence of harmful algal blooms and microbial pathogens, as well as hypoxia, have become widespread (e.g., [7, 8]). In river-dominated estuaries, N loading typically occurs in pulses following rain events, and these events have been shown to modulate large-scale spatial and temporal patterns in phytoplankton community growth and taxonomic composition (e.g., [3,9,10]).
While overall N availability is significant from the standpoint of controlling phytoplankton growth in many estuaries, N form may influence phytoplankton community structure by favoring the growth of certain taxa over others [11]. It has been noted that the forms of N deliv-ered to many estuaries have shifted to include a larger proportion of reduced N compounds, including urea [12]. As a major component of fertilizers, urea levels have increased sharply in some estuaries subjected to loadings from watershed agricultural activities [12]. While urea has been shown to be a major source of N supporting phytoplankton growth in a number of sys-tems (e.g., [13,14]), its role in shaping phytoplankton community composition remains unre-solved because of a paucity of observational and experimental studies, with existing studies showing considerable variability in the response of different phytoplankton taxa to urea [15, 16]. Experimental work on a range of potentially harmful taxa (e.g.,Prorocentrum minimum, Pseudonitzschia delicatissima) has demonstrated their ability to utilize organic nutrient forms [17,18], and it has been hypothesized that urea may favor the growth of mixotrophic, and potentially harmful, phytoplankton taxa [19].
Here, we experimentally determined the influence of urea and nitrate additions on estuarine phytoplankton growth and taxonomic composition in the Neuse River Estuary, NC. Our objec-tives were to examine the effects of N availability and the relative influence of each N form dur-ing the growdur-ing season from early sprdur-ing through late summer. Results from these experiments add to a limited body of knowledge on the role(s) these N forms play in determining estuarine phytoplankton growth and community composition.
Materials and Methods
Study site
–
Neuse River Estuary, North Carolina
The Neuse River Estuary (NRE) in eastern North Carolina is part of the Albemarle-Pamlico estu-arine system, the second largest estuestu-arine complex in the United States. The NRE is a long resi-dence time (up to four months), lagoonal estuary. N loading is usually highest in late winter/ spring when river discharge is high [20,21], while in the summer inorganic N concentrations are typically low except for occasional pulses during hypoxic or storm events [13,20,22]. Nitrate is the dominant inorganic N form in the NRE, while maximum urea concentrations are3μM [13,20]. During the summer months, phytoplankton growth is often N-limited in the NRE [4, 13]. Increasing N loads over the past few decades have led to significant acceleration of eutrophi-cation, including numerous phytoplankton blooms and presence of harmful taxa [21,23–25].
Experimental design
using surface water collected from the CMAX throughout the growing season, on June 6, 2011 (35.03˚N, 76.97˚W), August 15, 2011 (35.14˚N, 77.05˚W), and March 12, 2012 (34.84˚N, 76.87˚W). These locations are not within private or protected waters and no per-mission was required for taking samples. This study did not involve any endangered or pro-tected species.
For each of the three experiments, N availability was manipulated by adding 10μM-N as either urea or potassium nitrate to experimental treatments, while controls had no N addition. Treatments were run in triplicate for each experiment. Experimental water was dispensed in pre-washed (with 10% HCl) and rinsed (4x with deionized water) 4 L high density polyethylene Cubitainers that were ~80% transparent to ambient photosynthetically active radiation (PAR). Cubitainers were incubated in an outdoor pond (~1 m deep) that was continuously flushed with water from adjacent Bogue Sound, thereby approximating in situ temperature and surface light conditions. Subsamples were taken from each Cubitainer at 24 and 48 hours, but data are presented showing the phytoplankton response after 24 hours because one or more key nutri-ents (phosphorus [P] in March; N and P in June; N in August) were depleted to below typical half-saturation levels for uptake by 24 hours (i.e.,<0.1–0.2μM P,<1–2μM N; [30];S1 Table). Thus community dynamics and changes after that timeframe would not necessarily reflect a response to the added nutrients. Effects of N addition on phytoplankton growth and commu-nity composition were determined primarily from changes in chlorophyllaand phytoplankton group diagnostic photopigments, with supporting information provided by microscopic cell counts.
Light, nutrients, pigments, and cell abundances
Photosynthetically available radiation (PAR) was monitored continuously with a LI-COR 2pi PAR sensor located adjacent to the pond. At the beginning of each experiment and after the 24 hour incubation period, subsamples were collected for inorganic nutrients, total dissolved N (TDN), phytoplankton diagnostic photopigments and phytoplankton abundance. Nutrient (NO3-, NO2-, NH4+, PO4-) and TDN analyses were conducted with a Lachat QuickChem 8000
(Lachat Instruments) according to standard colorimetric methods (see [31] for details). Dis-solved organic N (DON) was estimated as the difference between TDN and inorganic N. Pig-ment concentrations were quantified using a high performance liquid chromatography (HPLC) photodiode array spectrophotometry system, as described in Paerl et al. [32]. Chloro-phyllaand diagnostic photopigments for the major phytoplankton taxonomic groups in the NRE were measured [33,34], including: zeaxanthin (cyanobacteria), fucoxanthin (raphido-phytes,Karlodiniumsp., diatoms, haptophytes), peridinin (dinoflagellates), chlorophyll b (chlorophytes, prasinophytes), and alloxanthin (cryptophytes). Samples for cell counts were preserved with acid Lugols (3–4% final conc.) and stored in amber glass bottles in the dark until analysis. 5 mL of subsample was settled in Utermohl chambers for 3 hours, deemed appropriate based on chamber volume and height (see [35,36]). Cell counts were conducted using an Olympus IX71 inverted microscope at 200x magnification. Cells>5μm were identi-fied to lowest taxonomic level possible, and>600 cells were counted per sample to ensure accurate representation of the various taxa.
Results
Initial conditions
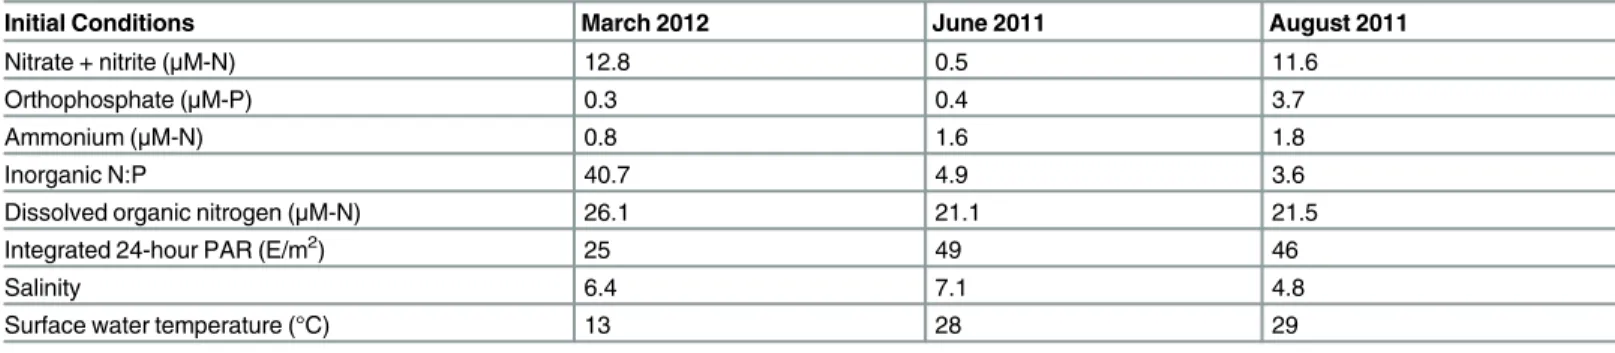
Meteorological conditions varied among experiments, however, both integrated PAR and sur-face water temperatures were similar between June and August (Table 1). Integrated PAR was approximately 2-fold higher in the summer months than in March, and surface water tempera-tures were higher in summer months as well (Table 1).
Throughout the experiments, DON accounted for a majority of TDN (Table 1). Nitrate con-centrations (as nitrate + nitrite) were highest in March (12.8μM-N), while ammonium (0.8μM-N) and orthophosphate concentrations were low (0.3μM-P), and inorganic molar N:P was 40.7 at that time. In June, ammonium concentrations were higher than nitrate concentra-tions (1.6μM-N and 0.5μM-N, respectively), while orthophosphate concentrations were 0.4μM-P. Inorganic molar N:P was 4.9, indicative of N-limited conditions (Table 1). In August, nitrate and ammonium concentrations were relatively high (11.6μM-N and 1.8μM-N, respec-tively), while orthophosphate concentrations were also high (3.7μM-P), and inorganic molar N: P (3.6) once again indicated N-limited conditions (Table 1). Although silicate was not measured, silicate concentrations at adjacent water quality monitoring stations were>15μM-Si in March, >86μM-Si in June and>90μM-Si in July (H. Paerl, unpubl. data; available upon request).
Bloom-level concentrations of chlorophylla(defined here as>30μg L-1; see [20,28,32] for long-term data) were observed in March (32.8μg L-1), with photopigments (peridinin, 8.8μg L-1) and cell counts indicating dominance by the dinoflagellateGyrodinium instriatum(Tables 2and3). High fucoxanthin concentrations (2.5μg L-1) and diatom abundances were also noted (Tables2and3). The dominant diatoms includedLeptocylindrussp.,Skeletonemasp., Cyclo-tellasp., andChaetocerossp (Table 3). Chlorophyllaconcentrations were lower in June (17.2μg L-1). Relatively high peridinin (2.2μg L-1) and zeaxanthin (3.2μg L-1) concentrations indicated that the community was dominated by dinoflagellates and cyanobacteria (Table 2). Cell counts showed very high abundances of the dinoflagellateHeterocapsa rotundata (Table 3). No cyanobacteria in the detectable size range (>~5μm) were observed, indicating that the high zeaxanthin concentration may have arisen from picocyanobacteria that were too small to count but are known to be abundant in the Neuse River Estuary during the spring-fall period [38]. Elevated abundances of cryptophytes and raphidophytes were also noted
(Table 3). Lowest chlorophyllalevels (15.3μg L-1) were observed in August (Table 2). Phyto-plankton pigments showed no clear dominant functional groups (Table 2), though cell counts indicated high abundances ofAnabaenasp., cryptophytes and chlorophytes (Table 3).
Phytoplankton response to N additions
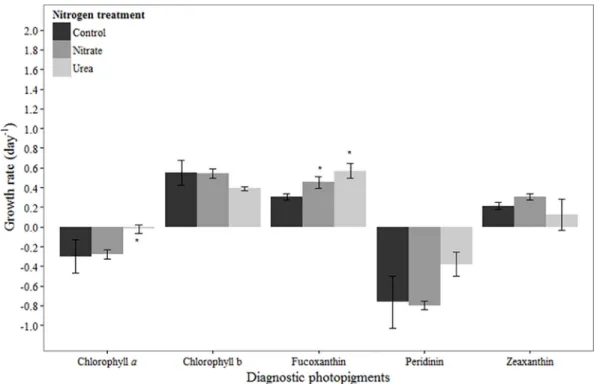
In March, chlorophylla-based net growth rates were negative in all treatments, but higher in the urea addition treatment compared to the control (p= 0.04;Fig 1). The net growth rate in
Table 1. Initial nutrient concentrations and physical conditions for each experiment.
Initial Conditions March 2012 June 2011 August 2011
Nitrate + nitrite (μM-N) 12.8 0.5 11.6
Orthophosphate (μM-P) 0.3 0.4 3.7
Ammonium (μM-N) 0.8 1.6 1.8
Inorganic N:P 40.7 4.9 3.6
Dissolved organic nitrogen (μM-N) 26.1 21.1 21.5
Integrated 24-hour PAR (E/m2) 25 49 46
Salinity 6.4 7.1 4.8
Surface water temperature (°C) 13 28 29
response to urea addition was higher than in response to nitrate, and this was statistically sig-nificant (p= 0.05;Fig 1). Chlorophyll b-, fucoxanthin- and zeaxanthin-based net growth rates were positive in all treatments (Fig 1). No difference was observed between the control and N treatments for chlorophyll b (urea:p= 0.10, nitrate:p= 0.99) and zeaxanthin (urea:p= 0.51, nitrate:p= 0.13). Likewise, no difference was observed between treatments for the dominant chlorophyll b-containing taxa that were enumerated, the chlorophytes (Table 3). In contrast, fucoxanthin-based net growth rates were significantly higher in the urea and nitrate treatments compared to the control treatment (p<0.01,p= 0.04, respectively;Fig 1). For some diatom taxa, mean growth rates in N-additions were lower than in the control treatments (Skeletonema sp.,Cyclotellasp.), while others (Leptocylindrussp.,Chaetocerossp.) had higher net growth rates in both N amended treatments compared to the control (Table 3). However, differences in growth rates were not significant for any of these taxa. Another fucoxanthin-containing taxon, the dinoflagellateKarlodiniumsp., did not respond to N addition (Table 3). Peridinin-based net growth rates were negative in all treatments (Fig 1). Peridinin-based growth was Table 2. Initial concentrations of diagnostic photopigments (μg L-1) for each experiment.
Photopigments March 2012 June 2011 August 2011
Chlorophylla 32.8 17.2 15.3
Alloxanthin BDL 0.7 0.8
Chlorophyll b 0.5 0.7 1.7
Fucoxanthin 2.5 0.6 1.5
Peridinin 8.8 2.2 0.6
Zeaxanthin 0.4 3.2 1.0
BDL indicates below detection limits.
doi:10.1371/journal.pone.0160663.t002
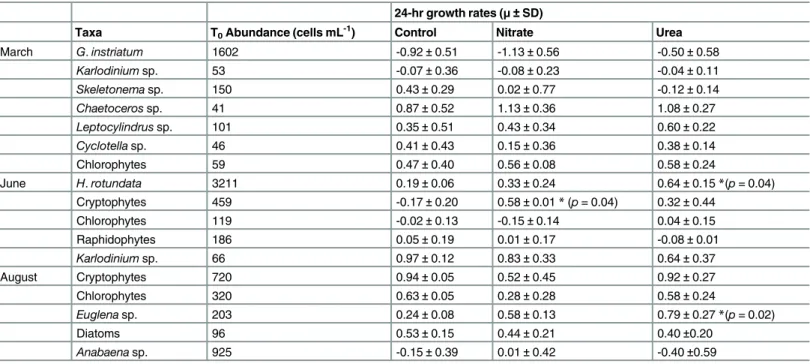
Table 3. Initial abundances and growth rates (μ±SD) of the major phytoplankton taxa in each experiment.
24-hr growth rates (μ±SD)
Taxa T0Abundance (cells mL -1
) Control Nitrate Urea
March G.instriatum 1602 -0.92±0.51 -1.13±0.56 -0.50±0.58
Karlodiniumsp. 53 -0.07±0.36 -0.08±0.23 -0.04±0.11 Skeletonemasp. 150 0.43±0.29 0.02±0.77 -0.12±0.14 Chaetocerossp. 41 0.87±0.52 1.13±0.36 1.08±0.27 Leptocylindrussp. 101 0.35±0.51 0.43±0.34 0.60±0.22 Cyclotellasp. 46 0.41±0.43 0.15±0.36 0.38±0.14
Chlorophytes 59 0.47±0.40 0.56±0.08 0.58±0.24
June H.rotundata 3211 0.19±0.06 0.33±0.24 0.64±0.15*(p= 0.04)
Cryptophytes 459 -0.17±0.20 0.58±0.01*(p= 0.04) 0.32±0.44
Chlorophytes 119 -0.02±0.13 -0.15±0.14 0.04±0.15
Raphidophytes 186 0.05±0.19 0.01±0.17 -0.08±0.01
Karlodiniumsp. 66 0.97±0.12 0.83±0.33 0.64±0.37
August Cryptophytes 720 0.94±0.05 0.52±0.45 0.92±0.27
Chlorophytes 320 0.63±0.05 0.28±0.28 0.58±0.24
Euglenasp. 203 0.24±0.08 0.58±0.13 0.79±0.27*(p= 0.02)
Diatoms 96 0.53±0.15 0.44±0.21 0.40±0.20
Anabaenasp. 925 -0.15±0.39 0.01±0.42 -0.40±0.59
Asterisk (*) indicates statistically significant difference in growth rates between a N treatment and the control. Significantp-values are given in parentheses.
slightly higher in the urea treatment compared to the nitrate or control treatments, though the difference was not statistically significant (p= 0.06, p = 0.08, respectively;Fig 1). Net growth rates of the dominant dinoflagellate,Gyrodinium instriatum, were also negative in all treat-ments, and though statistically indistinguishable, the mean growth rate was highest in the urea addition treatment (Table 3).
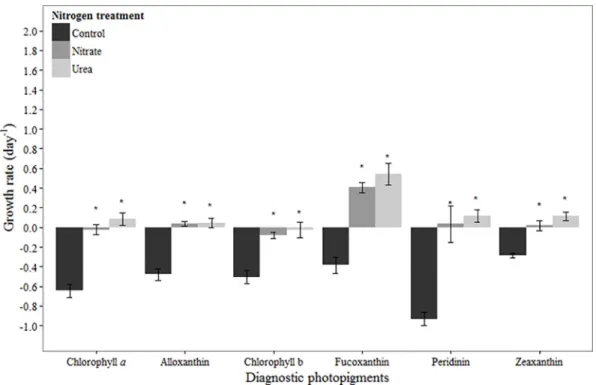
In June, the chlorophylla-based net growth rate was negative in the control, near zero in the nitrate treatment, and slightly positive in the urea treatment (Fig 2). Net growth rates in both N amended treatments were significantly higher than in the control treatment (urea: p<0.001, nitrate:p<0.001), but there was no significant difference between the N forms (p= 0.16;Fig 2). As with chlorophylla, net growth rates based on each of the diagnostic photo-pigments were negative in control treatments (Fig 2), and were significantly higher in urea (all pigments:p<0.001) and nitrate addition treatments compared to the control (all pigments: p<0.001). No significant differences were observed between N forms for any of the pigments (Fig 2). Fucoxanthin displayed positive net growth rates of 0.4–0.6 d-1in N addition treatments (Fig 2), whereas the net growth rates of the two main fucoxanthin-containing taxa, the raphi-dophytes andKarlodiniumsp., were not stimulated by N addition (Table 3). Growth of the most abundant phytoplankton taxa,Heterocapsa rotundata, was positive in all treatments and was significantly higher in the urea addition treatment compared to the control treatment (Table 3;p= 0.04). Cryptophyte growth rates generally mirrored those of alloxanthin, with negative growth in control treatments and positive growth in both N treatments, though only in the nitrate addition treatment was growth significantly higher than that in the control (Table 3;p= 0.04). The only chlorophyll b-containing taxa enumerated, the chlorophytes, showed no obvious response to N addition compared to controls (Table 3).
Fig 1. Growth rates based on diagnostic pigments in March 2012 experiment.Bars represent standard deviation (n= 3). Asterisk (*) indicates statistically significant difference between N treatment and control, while‘a’ indicates statistically significant difference between nitrate and urea treatments. Refer toTable 2for initial concentrations of pigments.
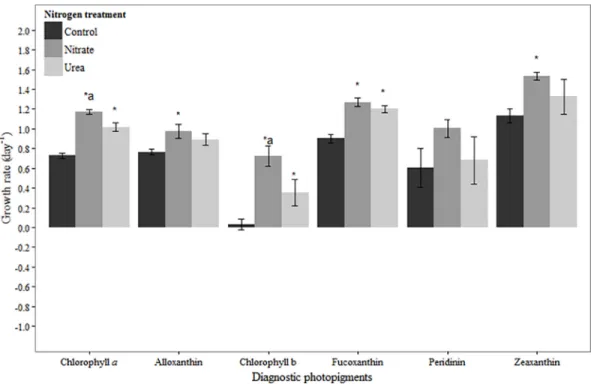
In August, chlorophylla-based net growth rates were positive in the control and N amended treatments (Fig 3). Net growth rates were significantly higher in N addition treatments com-pared to the control (urea:p<0.001, nitrate:p<0.001), and significantly higher in the nitrate treatment compared to the urea treatment (p<0.01;Fig 3). All diagnostic photopigments had positive net growth rates in the control and N amended treatments (Fig 3). Zeaxanthin- and alloxanthin-based net growth rates were significantly higher in the nitrate treatment compared to the control (p= 0.01,p =0.01, respectively), but not in the urea treatment (p= 0.17,p= 0.07, respectively). The only zeaxanthin-containing taxa enumerated,Anabaenasp., showed no response to N addition (Table 3). Likewise, cryptophyte abundances did not indicate a stimula-tory effect of N addition on growth (Table 3), contrary to the response of their marker pigment alloxanthin. Chlorophyll b-based net growth rates were significantly higher in N addition treat-ments compared to the control (urea:p= 0.02, nitrate:p<0.001), and significantly higher in the nitrate treatment compared to the urea treatment (p= 0.01;Fig 3). Of the chlorophyll b-containing taxa enumerated, chlorophyte growth was not stimulated by N addition, whereas Euglenasp. growth was stimulated by urea addition (Table 3;p= 0.02) but not nitrate (Table 3). Fucoxanthin-based net growth rates were significantly higher in both N addition treatments relative to the control (urea:p<0.001, nitrate:p<0.001;Fig 3). However, growth of the only two fucoxanthin-containing taxa enumerated, diatoms and raphidophytes, was not stimulated by N addition (Table 3). No statistically significant effect of N addition was observed on peridinin-based net growth rates (Fig 3).
Discussion
In these experiments, the phytoplankton responses to N additions and two different N forms were examined under representative seasonal conditions in the NRE, including; 1) cool, low Fig 2. Growth rates based on diagnostic pigments in June 2011 experiment.Bars represent standard deviation (n= 3). Asterisk (*) indicates statistically significant difference between N treatment and control. Refer to Table 2for initial concentrations of pigments.
light, early springtime conditions, 2) warm, low N summertime conditions, and 3) warm, N replete summertime conditions. Others have demonstrated distinct changes in both NRE phy-toplankton growth and photopigment-based functional groups in response to these various conditions (e.g., [34]). As much as feasible, this study went further by examining the ecological response of not only broad phytoplankton functional groups but also specific phytoplankton taxa to N addition, yielding new information on phytoplankton taxa that in many cases are important not only in the NRE but also other temperate/subtropical systems.
March
In March, a bloom of the dinoflagellateG.instriatumwas in place at the initiation of our exper-iment. Time course changes in its marker photopigment peridinin were similar to those of chlorophylla, suggesting that the bulk of chlorophyllapresent was fromG.instriatum.G. instriatumabundances and peridinin concentrations were both higher in the urea treatment compared to the control and nitrate treatments after 24 hours (Fig 2,Table 3). While Nagasoe et al. [39] determined that one particular strain ofG.instriatumwas unable to use urea and other organic N compounds for growth, results presented here suggest that this organism has the ability to use urea and/or was stimulated by growth of prey organisms that it is known to phagocytize (e.g., [40]). Of the other pigments observed in March, chlorophyll b- and zeaxan-thin-based net growth rates were positive and unaffected by N availability. Fucoxanzeaxan-thin-based net growth rates were positive in all treatments, but significantly higher in N treatments com-pared to the control, suggesting suboptimal growth at ambient concentrations and overall N limitation of growth. Furthermore, the stimulatory effects of nitrate and urea were equivalent, underscoring the ability of diatoms to utilize urea as an N source [15,41]. Rothenberger et al. Fig 3. Growth rates based on diagnostic pigments in August 2011 experiment.Bars represent standard deviation (n= 3). Asterisk (*) indicates statistically significant difference between N treatment and control, while‘a’ indicates statistically significant difference between nitrate and urea treatments. Refer toTable 2for initial concentrations of pigments.
[25] have argued that the relative importance of diatoms compared to dinoflagellates in the NRE during late winter-spring is dictated largely by river flow, with diatoms favored during high flow, elevated nutrient loading conditions. Our results are consistent with this, showing a much stronger response to N addition by diatoms compared to dinoflagellates based on pig-ment data. However, the diatom response was genera-specific, with some diatom genera being stimulated by N and others not. This points to effects of N availability that extend beyond broad functional group classifications to the genera or species level.
Results indicate that the influence of N can be modulated by, or eclipsed by, other factors during late winter/early spring in the NRE. For example, the low light levels in the turbid NRE may ultimately drive the community to N-limitation by preventing nitrate uptake, particularly in the late winter/early spring months. In this experiment, even though nitrate was present at a moderately high concentration in the environment (12.8μM-N), chlorophylla-based net growth rates in the control as well as nitrate treatments were negative. Additionally, the chlorophylla -based growth rate was highest in the urea addition treatment, suggesting that urea, not nitrate, was more effective at supporting community growth in March. Reduced N forms such as urea have been shown to be energetically favorable over nitrate under relatively low light conditions such as those experienced in mid-March [42,43]. Another factor that can account for the lack of response to N additions in March is P-limitation or co-limitation. At the initiation of this experi-ment, phosphate concentrations were low and inorganic molar N:P was ~41, suggesting that P-limitation may have prevented a stimulatory effect of N additions. Co-P-limitation of phytoplank-ton growth by N and P has been noted in spring in the NRE [4]. Aside from that of some diatom genera, the weak response of the phytoplankton community to N additions in March stresses the importance of other regulating/limiting factors in bloom dynamics during this time of year.
June
In June, the negative growth response in controls for all pigments, coincident with very low inor-ganic N concentrations, is indicative of strong N-limitation. Furthermore, chlorophylla-based net growth rates as well as those of the main diagnostic pigments (alloxanthin, chlorophyll b, fucoxanthin, peridinin, zeaxanthin) were stimulated by N addition, with no significant differ-ences between forms. In the case of alloxanthin and peridinin, net growth rates of the dominant taxa represented by these two pigments (cryptophytes andHeterocapsa rotundata, respectively) showed that the pigment-based growth changes were indeed representative of actual cell growth (Fig 2;Table 3). Cryptophytes often produce some of the largest blooms in the NRE, usually fol-lowing nutrient pulses into the system [33]. Although some cryptophytes are mixotrophic [17, 44–46], few studies have demonstrated a clear preference for DIN or organic N compounds (e.g., [16]). Cryptophyte growth in June was significantly stimulated by nitrate addition, while the response to urea addition was lower and more variable (Table 3), suggesting potential preference for DIN under the environmental conditions of the June experiment.H.rotundatawas the domi-nant dinoflagellate in June and has been shown to form blooms in other estuarine systems such as the Barnegat Bay-Little Egg Harbor system, NJ [47] and the Chesapeake Bay [48]. WhileH. rotundataresponded significantly to urea addition in this experiment (Table 3), it has not been shown to directly utilize urea [49,50]. This species, however, is often associated with high ammo-nium concentrations [25]. Thus, the response to urea additions may be driven by ammonium released through bacterial remineralization of the urea, which (bacterial remineralization) can be high in the summer months in the NRE [25,51]. The mixotrophic capabilities of this numerically important microorganism merit further investigation.
growth. For example, because no zeaxanthin-containing organisms were detected in our cell counts that were limited to>5μm cells, it can only be assumed that the high zeaxanthin con-centrations were indicative of picocyanobacteria (Synechococcussp.), which are numerically very abundant during summer in the NRE [38] and are capable of using both inorganic and organic N in coastal settings (e.g., [52,53]). Abundances of the main fucoxanthin- ( Karlodi-niumsp., raphidophytes) and chlorophyll b- (chlorophytes) containing organisms did not increase in response to N addition. In fact,Karlodiniumsp. had a relatively high net growth rate in all treatments (0.6–1.0 d-1), suggesting that its flexible nutritional strategies allowed it to thrive under the low inorganic N conditions in June (e.g., [54,55]). Net growth rates of the chlorophytes and raphidophytes were very low, and did not respond to N additions, suggesting that they may have been under strong grazing control, which has been previously documented to occur in the NRE during summer [56].
There are two possible explanations for the phenomenon of a stimulatory effect of N addi-tion on the marker pigments without a concomitant effect on cell abundances. One possibility is that we simply were unable to count the truly dominant taxa represented by fucoxanthin and chlorophyll b due to morphological ambiguities or small size, as is suspected for zeaxanthin-containing organisms (e.g., cyanobacterial picoplankton). Examples may include small hapto-phytes (fucoxanthin), which are known to be abundant in the NRE in summer/fall [25], and prasinophytes (chlorophyll b), which can also be important in the NRE under warmer condi-tions [25]. The second possibility is that the proportion of marker pigment per cell changed in response to N addition (e.g., [57,58]). In this regard, Lewitus et al. [59] found that the fucoxan-thin content per cell was generally higher in three estuarine flagellate species grown under nutrient replete versus deplete conditions. Both possibilities highlight the difficulty in inter-preting ecological patterns and relationships among estuarine phytoplankton taxa from pig-ments without use of other complimentary approaches, such as microscopy.
August
Chlorophylla-and diagnostic pigment-based net growth rates were positive in August across all treatments. Despite this and the fact that nitrate concentrations were relatively high (Table 1), pig-ment-based net growth rates were stimulated by N addition in several cases. This may seemingly point to suboptimal phytoplankton growth under ambient conditions as a result of N limitation. However, there were very few examples in August where the pigment-based growth changes were mirrored by those of the dominant phytoplankton taxa as determined by microscopy. This sug-gests that either pigments captured the growth response of taxa that we were unable to enumerate (e.g., prasinophytes–chlorophyll b, haptophytes–fucoxanthin), or that changes in pigment con-centrations reflected a change in cellular pigment levels. For example, cryptophyte growth was positive in all treatments, but was not stimulated by nitrate addition in contrast to its marker pig-ment, alloxanthin (Table 3,Fig 3). This suggests that the amount of alloxanthin per cell may have increased as a result of increased nitrate availability (cf. [59,60]), and thus the increased allox-anthin concentration was not reflective of a true growth response to N addition. In the case of chlorophyll b-containing organisms, chlorophytes andEuglenasp. were the main taxa present and their growth was also positive in all treatments. Yet whereas the chlorophytes were not stimu-lated by N addition,Euglenasp. growth was stimulated by urea (Table 3). With these two taxa alone, it remains unclear to what extent the change in chlorophyll b was representative of a true growth response (primarily ofEuglenasp.), changes in pigment per cell with no true growth response, or reflective of taxa (e.g., prasinophytes) that we were unable to enumerate.
3).Anabaenaspp. is a numerically-important taxa in the upper NRE during summer-fall [25], and many species are known to be N2fixers (e.g., [61]). Thus it is not surprising that it did not
respond to N addition. While there may have been changes in per cell concentrations of zea-xanthin inAnabaenasp. over the course of this experiment, we suspect that picocyanobacteria were a significant contributor to zeaxanthin in August (cf. [38]). These results clearly demon-strate the importance of incorporating both pigment analysis and cell counts in studies of phy-toplankton ecological dynamics. In this experiment, relying solely on either method would have led to vastly different conclusions about the magnitude of growth and the ecological effects of N addition on the NRE phytoplankton community and its important taxa.
Conclusions
Results from this study show seasonal and taxa-specific variability in the influence of N avail-ability on phytoplankton growth, as has been noted in the NRE and elsewhere [2,4,62]. Clear signs of N-limitation were seen in the summer months, while in the late winter/early spring, this was not the case, stressing the importance of co-occurring physical or chemical factors (e.g., low light levels, P-limitation) that may regulate bloom dynamics during that period. The observed effects of N addition on phytoplankton growth and community composition in these incubation experiments are broadly consistent with in situ seasonal dynamics in the NRE [25] and other coastal systems [16,63,64], and add to our understanding of the intricacies of the nitrogen-phytoplankton relationship for specific estuarine phytoplankton taxa.
Subtle seasonal differences in the phytoplankton response to N form were noted as well. For example, addition of urea had a marginal stimulatory effect on the dinoflagellateG.instriatum (Fig 1,Table 3), possibly due to low light conditions favoring mixotrophy over autotrophy (e.g., [42,43,65]).G.instriatumhas been shown to bloom in other systems including the Ches-apeake Bay [66], and winter-spring dinoflagellate blooms may contribute a substantial fraction of annual primary production in estuarine systems (e.g., NRE [33], Patuxent River Estuary [67]). Thus future work should consider seasonal light availability as a factor that may influ-ence the relative importance of inorganic versus organic nutrients on growth of relevant dino-flagellate taxa. Furthermore, the potential for organic N availability (i.e., urea) to influence overall phytoplankton community structure and bloom dynamics during this time of year war-rants further investigation. Another example comes from N-limited summer months, when addition of both forms of N stimulated phytoplankton growth to a similar degree. This suggests that urea supports growth across all investigated phytoplankton groups, likely due to mixo-trophic capabilities of some taxa as well as rapid bacterial conversion of urea to ammonium and its subsequent uptake by other phytoplankton taxa (e.g, [68]). Overall, these findings rein-force current understanding of the effects of N pulses on estuarine phytoplankton communi-ties, and add to a very limited body of knowledge on the relative effects of urea and nitrate on estuarine phytoplankton community growth and compositional responses.
Supporting Information
S1 Table. Nutrient concentrations (μg L-1) for each experiment. (XLSX)
S2 Table. Pigment concentrations (μg L-1) for each experiment.BDL indicates below detec-tion limits.
(XLSX)
S3 Table. Select phytoplankton taxa abundances (cells mL-1) for each experiment. (XLSX)
Acknowledgments
We thank members of the Paerl lab for assistance with experiments and sample analysis.
Author Contributions
Conceived and designed the experiments:HWP MSW.
Performed the experiments:EKC MSW.
Analyzed the data:EKC MSW.
Contributed reagents/materials/analysis tools:HWP MSW.
Wrote the paper:EKC HWP MSW.
References
1. Alpine AE, Cloern JE. Trophic interactions and direct physical effects control phytoplankton biomass and production in an estuary. Limnol Oceanogr. 1992; 37: 946–955.
2. Lewitus AJ, Koepfler ET, Morris JT. Seasonal variation in the regulation of phytoplankton by nitrogen and grazing in a salt-marsh estuary. Limnol Oceanogr. 1998; 43: 636–646.
3. Ornolfsdottir EB, Lumsden SE, Pinckney JL. Nutrient pulsing as a regulator of phytoplankton abun-dance and community composition in Galveston Bay, Texas. J Exp Mar Biol Ecol. 2004; 303: 197–220. 4. Rudek J, Paerl HW, Mallin MA, Bates PW. Seasonal and hydrological control of phytoplankton nutrient
limitation in the lower Neuse River Estuary, North Carolina. Mar Ecol Prog Ser. 1991; 75: 133–142. 5. Nixon SW. Coastal marine eutrophication: a definition, social causes, and future concerns. Ophelia.
1995; 41: 199–219.
6. Cloern JE. Our evolving conceptual model of the coastal eutrophication problem. Mar Ecol Prog Ser. 2001; 210: 223–253.
7. Paerl HW. Coastal eutrophication and harmful algal blooms: Importance of atmospheric deposition and groundwater as“new”nitrogen and other nutrient sources. Limnol Oceanogr. 1997; 42: 1154–1165. 8. Anderson DM, Glibert PM, Burkholder JM. Harmful algal blooms and eutrophication: Nutrient sources,
composition, and consequences. Estuaries. 2002; 25: 704–726.
9. Mallin MA, Paerl HW, Rudek J, Bates PW. Regulation of estuarine primary production by watershed rainfall and river flow. Mar Ecol Prog Ser. 1993; 93: 199–203.
10. Pinckney JL, Paerl HW, Harrington MB. Responses of the phytoplankton community growth rate to nutrient pulses in variable estuarine environments. J Phycol. 1999; 35: 1455–1463.
11. Bronk DA, See JH, Bradley P, Killberg L. DON as a source of bioavailable nitrogen for phytoplankton. Biogeosciences. 2007; 4: 283–296.
12. Glibert PM, Harrison J, Heil C, Seitzinger S. Escalating worldwide use of urea–a global change contrib-uting to coastal eutrophication. Biogeochemistry. 2006; 77: 441–463.
14. Yuan X, Glibert PM, Xu J, Liu H, Chen M, Liu H, et al. Inorganic and organic nitrogen uptake by phyto-plankton and bacteria in Hong Kong waters. Estuaries Coasts. 2012; 35: 325–334.
15. Solomon CM, Collier JL, Berg GM, Glibert PM. Role of urea in microbial metabolism in aquatic systems: a biochemical and molecular review. Aquat Microb Ecol. 2010; 59: 67–88.
16. Altman JC, Paerl HW. Composition of inorganic and organic nutrient sources influences phytoplankton community structure in the New River Estuary, North Carolina. Aquat Ecol. 2012; 46: 269–282. 17. Solomon CM, Glibert PM. Urease activity in five phytoplankton species. Aquat Microb Ecol. 2008; 52:
149–157.
18. Loureiro S, Jauzein C, Garcés E, Collos Y, Camp J, Vaqué D. The significance of organic nutrients in the nutrition ofPseudo-nitzschia delicatissima(Bacillariophyceae). J Plankton Res. 2009; 31: 399–410. 19. Burkholder JM, Glibert PM, Skelton HM. Mixotrophy, a major mode for harmful algal species in
eutro-phic waters. Harmful Algae. 2008; 8: 77–93.
20. Christian RR, Boyer JN, Stanley DW. Multi-year distribution patterns of nutrients within the Neuse River Estuary, North Carolina. Mar Ecol Prog Ser. 1991; 71: 259–274.
21. Paerl HW, Pinckney JL, Fear JM, Peierls BL. Ecosystem responses to internal and watershed organic matter loading: consequences for hypoxia in the eutrophying Neuse River Estuary, North Carolina, USA. Mar Ecol Prog Ser. 1998; 166: 17–25.
22. Rizzo WM, Christian RR. Significance of subtidal sediments to heterotrophically-mediated oxygen and nutrient dynamics in a temperate estuary. Estuaries. 1996; 19: 475–487.
23. Stow CG, Borsuk ME, Stanley DW. Long-term changes in watershed nutrient inputs and riverine exports in the Neuse River, North Carolina. Water Res. 2001; 35: 1489–1499. PMID:11317896 24. Hall NS, Litaker RW, Fensin E, Adolf JE, Bowers HA. Environmental factors contributing to the
develop-ment and demise of a toxic dinoflagellate (Karlodinium veneficum) bloom in a shallow, eutrophic, lagoonal estuary. Estuaries Coasts. 2008; 31: 402–418.
25. Rothenberger MB, Burkholder JA, Wentworth TR. Use of long-term data and multivariate ordination techniques to identify environmental factors governing estuarine phytoplankton species dynamics. Lim-nol Oceanogr. 2009; 54: 2107–2127.
26. Pennock JR. Chlorophyll distributions in the Delaware Estuary: regulation by light-limitation. Estuar Coast Shelf Sci. 1985; 21: 711–725.
27. Fisher TR, Harding LW, Stanley DW, Ward LG. Phytoplankton, nutrients, and turbidity in the Chesa-peake, Delaware, and Hudson Estuaries. Estuar Coast Shelf Sci. 1988; 27: 61–93.
28. Valdes-Weaver LM, Piehler MF, Pinckney JL, Howe KE, Rossignol KL, Paerl HW. Long-term temporal and spatial trends in phytoplankton biomass and class-level taxonomic composition in the hydrologi-cally variable Neuse-Pamlico estuarine continuum, North Carolina, U.S.A. Limnol Oceanogr. 2006; 51: 1410–1420.
29. Paerl HW, Valdes LM, Joyner AR, Piehler MF. Solving problems resulting from solutions: evolution of a dual nutrient management strategy for the eutrophying Neuse River Estuary, North Carolina. Environ Sci Technol. 2004; 38: 3068–3073. PMID:15224737
30. Fisher TR, Melack JM, Grobbelaar JU, Howarth RW. Nutrient limitation of phytoplankton and eutrophi-cation of inland, estuarine and marine waters. In: Tiessen H, editor. Phosphorous in the Global Environ-ment. Chichester: John Wiley and Sons; 1995. p. 301–322.
31. Peierls BL, Christian RR, Paerl HW. Water quality and phytoplankton as indicators of hurricane impacts on a large estuarine ecosystem. Estuaries. 2003; 26: 1329–1343.
32. Paerl HW, Rossignol KL, Hall NS, Peierls BL, Wetz MS. Phytoplankton community indicators of short-and long-term ecological change in the anthropogenically short-and climatically impacted Neuse River Estu-ary, North Carolina. Estuaries Coasts. 2010; 33: 485–497.
33. Pinckney JL, Paerl HW, Harrington MB, Howe KE. Annual cycles of phytoplankton community-structure and bloom dynamics in the Neuse River Estuary, North Carolina. Mar Biol. 1998; 131: 371–381. 34. Paerl HW, Valdes LA, Pinckney JL, Piehler MF, Dyble J, Moisander PH. Phytoplankton photopigments
as indicators of estuarine and coastal eutrophication. BioScience. 2003; 53: 953–964.
35. Lund JWG, Kipling C, Le Cren ED. The inverted microscope method of estimating algal numbers and the statistical basis of estimations by counting. Hydrobiologia 1958; 11: 143–170.
36. Margalef R. Counting. In: Vollenweider RA, Talling JF, Westlake DF, editors. A manual on methods for measuring primary production in aquatic environments (I.B.P Handbook 12). Oxford: Blackwell Scient. Publ; 1969. p. 7–14.
38. Gaulke AK, Wetz MS, Paerl HW. Picophytoplankton: A major contributor to planktonic biomass and pri-mary production in a eutrophic river-dominated estuary. Estuar Coast Shelf Sci. 2010; 90: 45–54. 39. Nagasoe S, Shikata T, Yamasaki Y, Matsubara T, Shmasaki Y, Oshima Y, et al. Effects of nutrients on
growth of the red-tide dinoflagellate Gyrodinium instriatum Freudenthal et Lee and a possible link to blooms of this species. Hydrobiologia. 2010; 651: 225–238.
40. Uchida T, Kamiyama T, Yamaguchi M. Predation by a photosynthetic dinoflagellateGyrodinium instria-tumon loricated ciliates. J Plankton Res. 1997; 19: 603–608.
41. Price NM, Harrison PJ. Uptake of urea C and urea N by the coastal marine diatomThalassiosira pseu-donana. Limnol Oceanogr. 1988; 33: 528–537.
42. Legrand C, Granéli E, Carlsson P. Induced phagotrophy in the photosynthetic dinoflagellate Hetero-capsa triquetra. Aquat Microb Ecol. 1998; 15: 65–75.
43. Li J, Glibert PM, Alexander JA, Molina ME. Growth and competition of several harmful dinoflagellates under different nutrient and light conditions. Harmful Algae. 2012; 13: 112–125.
44. Cloern JE, Dufford R. Phytoplankton community ecology: principles applied in San Francisco Bay. Mar Ecol Prog Ser. 2005; 285: 11–28.
45. Lewitus AJ, Caron DA. Physiological responses of phytoflagellates to dissolved organic substrate addi-tions. 2. Dominant role of autotrophic nutrition in Pyrenomonas salina (Cryptophyceae). Plant Cell Phy-siol. 1991; 32: 791–801.
46. Berg GM, Balode M, Purina I, Bekere S, Bechemin C, Maestrini SY. Plankton community composition in relation to availability and uptake of oxidized and reduced nitrogen. Aquat Microb Ecol. 2003; 30: 263–274.
47. Olsen PS, Mahoney JB. Phytoplankton in the Barnegat Bay-Little Egg Harbor Estuarine System: spe-cies composition and picoplankton bloom development. J Coast Res SI. 2001; 32: 115–143.
48. Sellner KG, Nealley EW. Diel fluctuations in dissolved free amino acids and monosaccharides in Ches-apeake Bay dinoflagellate blooms. Mar Chem. 1997; 56: 193–200.
49. Seong KA, Jeong HJ, Kim S, Kim GH, Kang JH. Bacterivory by co-occurring red-tide algae, heterotro-phic nanoflagellates, and ciliates. Mar Ecol Prog Ser. 2006; 322: 85–97.
50. Yoo YD, Jeong HJ, Kim MS, Kang NS, Song JY, Shin W, et al. Feeding by phototrophic red-tide dinofla-gellates on the ubiquitous marine diatomSkeletonema costatum. J Eukaryot Microbiol. 2009; 56: 413– 420. doi:10.1111/j.1550-7408.2009.00421.xPMID:19737193
51. Peierls BL, Paerl HW. Temperature, organic matter, and the control of bacterioplankton in the Neuse River and Pamlico Sound estuarine system. Aquat Microb Ecol. 2010; 60: 139–149.
52. Moore LR, Post AF, Rocap G, Chisholm SW. Utilization of different nitrogen sources by the marine cya-nobacteriaProchlorococcusandSynechococcus. Limnol Oceanogr. 2002; 47: 989–996.
53. Wawrik B, Callaghan AV, Bronk DA. Use of inorganic and organic nitrogen by Synechococcus spp. and diatoms on the West Florida Shelf as measured using stable isotope probing. Appl Environ Microbiol. 2009; 75: 6662–6670. doi:10.1128/AEM.01002-09PMID:19734334
54. Calbet A, Bertos M, Fuentes-Grunewald CF, Alacid E, Rigueroa R, Renom B, et al. Intraspecific vari-ability inKarlodinium veneficum: growth rates, mixotrophy, and lipid composition. Harmful Algae. 2011; 10: 654–667.
55. Place AR, Bowers HA, Bachvaroff TR, Adolf JE, Deeds JR, Sheng J.Karlodinium veneficum- the little dinoflagellate with a big bite. Harmful Algae. 2012; 14: 179–195.
56. Wetz MS, Paerl HW, Taylor CT, Leonard JA. Environmental controls upon picoplankton growth and bio-mass in a eutrophic estuary. Aquat Microb Ecol. 2011; 63: 133–143.
57. Llewellyn CA, Gibb SW. Intra-class variability in the carbon, pigment and biomineral content of prymne-siophytes and diatoms. Mar Ecol Prog Ser 2000; 193: 33–44.
58. Goericke R., Montoya JP. Estimating the contribution of microalgal taxa to chlorophyll a in the field– var-iations of pigment rations under nutrient- and light-limited growth. Mar Ecol. Prog. Ser. 1998; 169: 97– 112.
59. Lewitus AJ, White DL, Tymowski RG, Geesey ME, Hymel SN, Noble PA. Adapting the CHEMTAX Method for assessing phytoplankton taxonomic composition in Southeastern U.S. estuaries. Estuaries. 2005; 28: 160–172.
60. Schluter L, Mohlenberg F, Havskum H, Larsen S. The use of phytoplankton pigments for identifying and quantifying phytoplankton groups in coastal areas: testing the influence of light and nutrients on pigment/chlorophyllaratios. Mar Ecol Prog Ser. 2000; 192: 49–63.
62. Fisher TR, Peele ER, Ammerman JW, Harding LW. Nutrient limitation of phytoplankton in Chesapeake Bay. Mar Ecol Prog Ser. 1992; 82: 51–63.
63. Pennock J, Sharp JH. Temporal alteration between light- and nutrient-limitation of phytoplankton pro-duction in a coastal plain estuary. Mar Ecol Prog Ser. 1994; 111: 275–288.
64. Rosser SMJ, Thompson PA. Phytoplankton of the Swab-Canning Estuary: a comparison of nitrogen uptake by different bloom assemblages. Hydrol Process. 2001; 15: 2579–2594.
65. Caron DA, Sanders RW, Lim EL, Marrasé C, Amaral LA, Whitney S, et al. Light-dependent phagotrophy in the freshwater Mixotrophic chrysophyteDinobryon cylindricum. Microb Ecol. 1993; 25: 93–111. doi: 10.1007/BF00182132PMID:24189708
66. Egerton TA, Morse RE, Marshall HG, Mulholland MR. Emergence of algal blooms: the effect of short-term variability in water quality on phytoplankton abundance, diversity, and community composition in a tidal estuary. Microorganisms. 2014; 2: 33–57.
67. Sellner KG, Lacouture RV, Cibik SJ, Brindley A, Brownlee SG. Importance of a winter dinoflagellate-microflagellate bloom in the Patuxent River Estuary. Estuar Coast Shelf Sci. 1991; 32: 27–42. 68. Seitzinger SP, Sanders RW. Contribution of dissolved organic nitrogen from rivers to estuarine