Real World Evaluation of Techniques for Mitigating the Impact of Packet Losses on TCP Performance
Sushant Rewaskar
A dissertation submitted to the faculty of the University of North Carolina at Chapel Hill in partial fulfillment of the requirements for the degree of Doctor of Philosophy in the Department of Computer Science.
Chapel Hill 2008
Approved by:
ABSTRACT
SUSHANT REWASKAR: Real World Evaluation of Techniques for Mitigating the Impact of Packet Losses on TCP Performance.
(Under the direction of Jasleen Kaur)
The real-world impact of network losses on the performance of Transmission Control Protocol (TCP), the dominant transport protocol used for Internet data transfer, is not well understood. A detailed understanding of this impact and the efficiency of TCP in dealing with losses would prove useful for optimizing TCP design. Past work in this area is limited in its accuracy, depth of analysis, and scale. In this dissertation, we make three main contributions to address these issues: (i) design a methodology for in-depth and accurate passive analysis of TCP traces, (ii) systematically evaluate the impact of design parameters associated with TCP loss detection/recovery mechanisms on its per-formance, and (iii) systematically evaluate the ability of Delay Based Congestion Estimators (DBCEs) to predict losses and help avoid them.
We develop a passive analysis tool, TCPdebug, that accurately tracks TCP sender state for many prominent OSes (Windows, Linux, Solaris, and FreeBSD/MacOS) and accurately classifies segments that appear out-of-sequence in a TCP trace. This tool has been extensively validated using controlled lab experiments as well as against real Internet connections. Its accuracy exceeds 99%, which is double the accuracy of current loss classification tools.
Using TCPdebug, we analyze traces of more than 2.8 million Internet connections to study the efficiency of current TCP loss detection/recovery mechanisms. Using models to capture the impact of configuration of these mechanisms on the durations of TCP connections, we find that the recommended as well as widely implemented configurations for these mechanisms are fairly sub-optimal. Our analysis suggests that the durations of up to 40% of Internet connections can be reduced by more than 10% by reconfiguring prominent TCP stacks.
ACKNOWLEDGMENTS
First, I want to thank my advisor, Jasleen Kaur, for her constant support and guidance throughout my stay at UNC. Her immence patience with me and her attention to details taught me a lot about conducting research. I would also like to specially thank Don Smith for spending extraordinary amount of time with me dicussing my research and quiding me. Both of them made working of my dissertation a very rewarding and fun experience for me. I would like to thank Kevin jeffay, who has always been available to to provide input and insight in my work, as well as Ketan Mayer-Patel for his interesting and sometimes revolutionary ideas. I would also like to talk Don Towsley for taking time from this busy schedule to serve on my dissertation committee and providing good feedback which definetly improved the quality of my dissertation.
My friends, both from UNC and outside, always stood by me and helped me in every way possible. I am truely grateful for their quidance but more so for their support. During my stay at UNC, I had a lot of fun working on several class projects or discussing my random thoughts with the faculty here. I would like to thank the faculty and the Department of Computer Science in general for this valuable experience.
TABLE OF CONTENTS
LIST OF TABLES ix
LIST OF FIGURES xi
LIST OF ABBREVIATIONS xiv
1 Introduction 1
1.1 Thesis Goals . . . 1
1.1.1 Summary of Dissertation Objectives . . . 4
1.2 Passive Analysis of TCP Traces . . . 4
1.2.1 Benefits of Passive Analysis . . . 4
1.2.2 Challenges of Passive Analysis . . . 5
1.2.3 Developing TCPdebug . . . 5
1.3 TCP Loss Detection . . . 7
1.4 TCP Loss Prediction and Avoidance . . . 10
1.5 Thesis Statement . . . 12
1.6 Contributions . . . 12
1.7 Overview . . . 14
2 Background and Related Work 15 2.1 Background . . . 16
2.1.1 TCP Reliability . . . 16
2.1.2 TCP Congestion Control . . . 19
2.2 Related Work . . . 24
2.2.1 Past Work on TCP Congestion Control and Reliability . . . 24
2.2.2 Past Work on TCP Analysis Tools and Methodology . . . 38
3 TCPdebug 49
3.1 Passive Inference of TCP Losses . . . 50
3.1.1 Passive Loss Inference Methodology . . . 50
3.1.2 Practical Challenges in Loss Inference . . . 54
3.1.3 Summary of Our Methodology . . . 57
3.2 Validation . . . 59
3.2.1 Data Sources . . . 59
3.2.2 Validation AgainstTBITControlled Conditions . . . 60
3.2.3 Validation Against Real TCP Connections . . . 66
3.3 Impact . . . 67
3.4 Concluding Remarks . . . 72
4 TCP Detection Recovery 74 4.1 Problem Formulation . . . 75
4.2 Data Sources . . . 76
4.3 Methodology . . . 77
4.3.1 Identifying Loss Detection Attempts and Configuration: . . . 77
4.3.2 Studying Accuracy and Timeliness of Loss Detection: . . . 78
4.3.3 Studying Impact of Design Parameters: . . . 78
4.3.4 Studying Impact on Connection Response Times: . . . 79
4.4 Analysis of TCP Loss Detection . . . 80
4.4.1 Baseline Performance of real world TCP Implementations . . . 80
4.4.2 Impact of The RTO Estimator . . . 86
4.4.3 Impact of The dupACK Threshold . . . 90
4.4.4 Impact of The Smart Configuration . . . 92
4.5 Concluding Remarks . . . 93
5 Delay Based Congestion Avoidance 95 5.1 Problem Formulation . . . 96
5.2 Data Sources . . . 97
5.3 Evaluation Methodology . . . 99
5.3.1 Trace Pre-processing . . . 99
5.4 Evaluation Results . . . 104
5.4.1 Evaluation of Loss Prediction Ability . . . 104
5.4.2 Evaluation of False Positive Avoidance . . . 107
5.4.3 Impact on Connection Durations . . . 108
5.4.4 RTT Estimates: All or once-per-flight? . . . 112
5.5 Influence of Connection Characteristics . . . 112
5.5.1 Connection Characteristics of Interest . . . 113
5.5.2 Clustering of TCP Connections . . . 114
5.5.3 Performance of DBCEs Across Clusters . . . 117
5.6 Concluding Remarks . . . 120
6 Conclusions and Future Work 121 6.1 TCPdebug . . . 121
6.2 Loss Detection/Recovery . . . 122
6.3 Ability of DBCEs to Predict Losses . . . 124
6.4 Future Work . . . 127
A Analytical Model: Changing Parameters for Detection Mechanisms 129 A.1 Model for Best Possible Improvement in Connection Duration . . . 129
A.2 Increasing Dupack Threshold . . . 134
A.3 Decreasing Dupack Threshold . . . 134
A.4 Increasing RTO . . . 135
A.5 Decreasing RTO . . . 135
B Analytical Model: Efficacy of DBCEs 137 B.1 Model for Change in Connection Duration when congestion is detected . . . 137
B.1.1 Additive Decrease . . . 137
B.1.2 Multiplicative Decrease . . . 139
B.2 Model for Change in Connection Duration when loss is predicted correctly . . . 140
B.3 Best Case Change in Connection Duration . . . 141
LIST OF TABLES
1.1 Values of key parameters in different TCP Stacks. Timer granularity is the granularity of clock used in the OS to measure RTT and RTO. Initial RTO is the initial value of RTO used. minRT Ois the minimum value of the RTO permitted by the OS. a, b, m, k are the parameters of RTO equation used by the OS.D is the dupack threshold used by the OS. RTO equation is the outline of the equation used by the OS. . . 9
3.1 General Characteristics of Packet Traces. The trace name indicates the location, link speed, the year data was collected and the acronym used for the trace. The remaining columns describe the duration of the trace, average load on the link, and the number of connections, bytes, and packets. . . 59 3.2 Characteristic of Connections That Transmit More Than 10 Segments. Connections
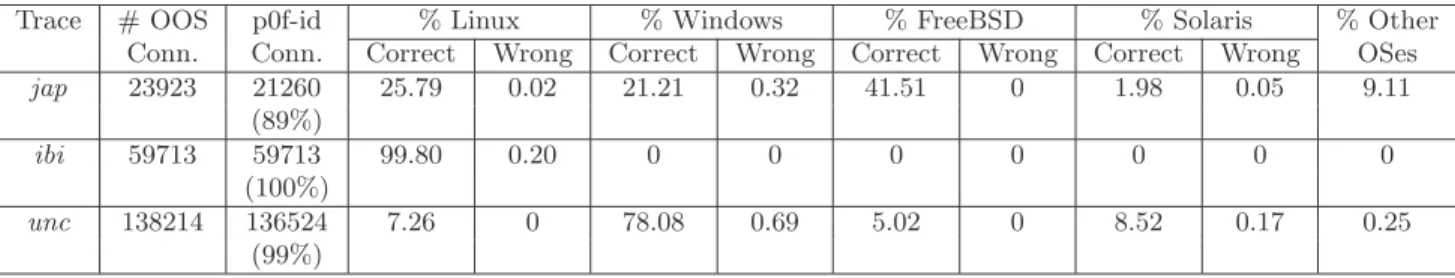
that transmit at least 10 data segments are described under “All Connections”. Out of these, the connections with traces that contain at least one OOS segment are described under “OOS Connection”. The final set of columns describe the characteristics of the connections for which our tool was able to unambiguously explain and classify all OOS segments. . . 60 3.3 Values of key parameters in different TCP Stacks . . . 62 3.4 Validation using p0f. The third column lists the number (and percent) of connections
for which p0f was able to identify the source OS. For each OS, we next list the percent of connections for which our estimation of sender OS was correct or wrong. The last column lists the percent of connections which did not belong to any of the OSes that we model. All percent values are with respect to the second column. . . 63 3.5 Classification of OOS segments byTCPdebug. These are from connections for which we
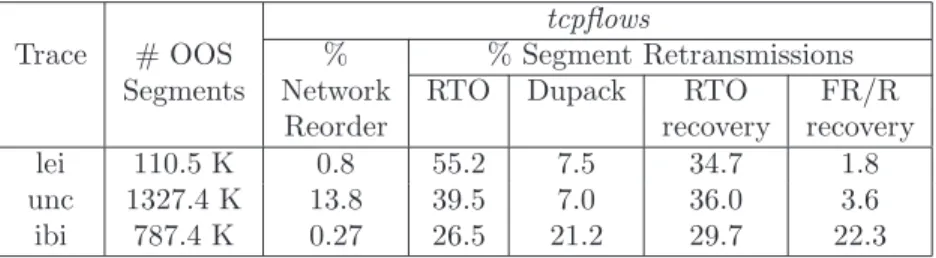
were able to unambiguously explain and classify all OOS segments. . . 67 3.6 Classification of OOS segments bytcpflows . These are from connections for which we
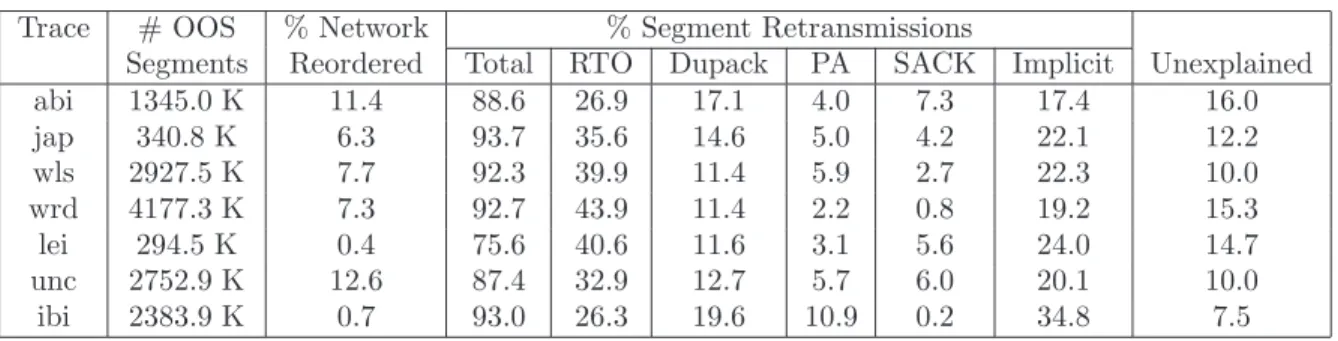
were able to unambiguously explain and classify all OOS segments. tcpflowsclassifies an OOS segment as one of: network reordering, retransmission triggered by RTO, duplicate ACKs, or during FR/R or RTO-recovery. . . 67 3.7 Classification of all OOS segments (including unexplained events) by our tool-set. These
are all connections irrespective of whether we were able to explain all events or not. . . 68 3.8 Needed and Unneeded Retransmissions (for connections with all OOS segments
unam-biguously explained). . . 68
4.1 General Characteristics of Packet Traces: We present the average TCP load, number of connections, number of bytes and number of packets in the traces. The name is brackets will be used to represent the traces in the rest of this chapter. . . 76 4.2 Characteristics of Connections That Transmit More Than 10 Segments. Connections
4.3 Characteristics of Connections Used in Our Analysis and the Distribution of OSes in Them: The first column titled “Explained Lossy Connections” describe characteristics of connections for which we were able to explain all the losses and identify the OS unambiguously. The second set of columns describe the distribution of these explained connections within the different OSes. For the connections characteristics, the numbers in brackets represent the percentage of total connections, bytes and packets represented by those columns. For the OS distribution the number in brackets describe the percentage of explained lossy connections for that OS. . . 78 4.4 Classification of TCP Retransmissions: We divide the observed losses in a trace into
needed and unneeded retransmissions and further classify these losses as triggered by RTO and FR/R. The figure in brackets represent the percentage of total losses repre-sented by that column. . . 81 4.5 Values of key parameters in different TCP Stacks. Timer granularity is the granularity
of clock used in the OS to measure RTT and RTO. Initial RTO is the initial value of RTO used. minRT Ois the minimum value of the RTO permitted by the OS. a, b, m, k are the parameters of RTO equation used by the OS.D is the dupack threshold used by the OS. RTO equation is the outline of the equation used by the OS. . . 81 4.6 Impact of the dupACK Threshold: First set of columns show the impact of changingD
from 3 to 2 for all OSes except Windows for which it shows the impact of changingD from 2 to 3. The second set of columns show the impact of changingD to 4. Figures in bracket represent the percentage of total losses represented by that column. . . 91
5.1 Estimator Descriptions: References in first column provide more details on the estimtors considered. . . 97 5.2 General Characteristics of Packet Traces: We present the average TCP load, number of
connections, number of bytes and number of packets in the traces. The name is brackets will be used to represent the traces in the rest of this chapter. . . 98 5.3 Statistics for Large Connections: We present the number of connections, bytes and
LIST OF FIGURES
2.1 Time Sequence Plots for TCP: these plots are used to present the exchange of data and
acks between the sender and the receiver . . . 16
2.2 Retransmission Timeout (RTO) based loss detection in TCP . . . 17
2.3 Duplicate acknowledgments based loss detection in TCP . . . 18
2.4 TCP Slow Start: The congestion window increases exponentially. . . 19
2.5 TCP Congestion Avoidance: The congestion window increases linearly. . . 20
2.6 TCP Partial Acks. . . 22
2.7 Uncongested Network . . . 23
2.8 Congested Network . . . 24
2.9 Network Performance as a function of load . . . 27
3.1 Implicit TCP Retransmission. Segment 1 is retransmitted due to a timeout. Segment 2 is a necessary implicit retransmission while segment 3 is an unnecessary implicit retrans-mission triggered simply due to TCP’s recovery mechanism. . . 51
3.2 Unneeded Retransmission. This visualization of a real connection from the unc trace shows how a single occurrence of network reordering results in some spurious duplicate ACKs, that ultimately trigger 64 subsequent phases of unnecessary retransmissions. . . 52
3.3 Classification Taxonomy. . . 58
3.4 Error in RTO estimation for different OSes . . . 64
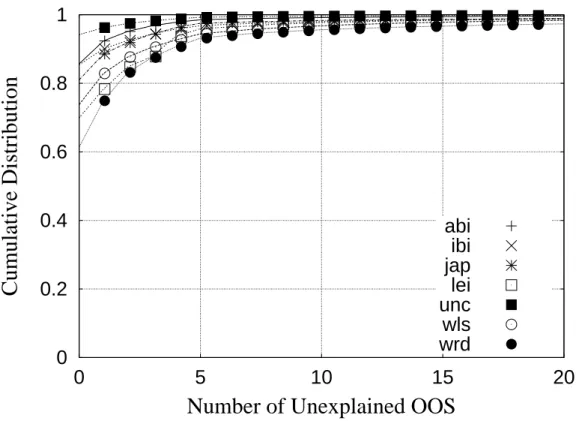
3.5 The distribution of the number of unexplained OOS segments in each OOS connection. 70 3.6 Resequencing delays for reordered segments . . . 72
4.1 Distribution of Bytes Transmitted in Each Connection . . . 76
4.2 Distribution of Detection duration for FR/R and RTO (Normalized with RTT) . . . 82
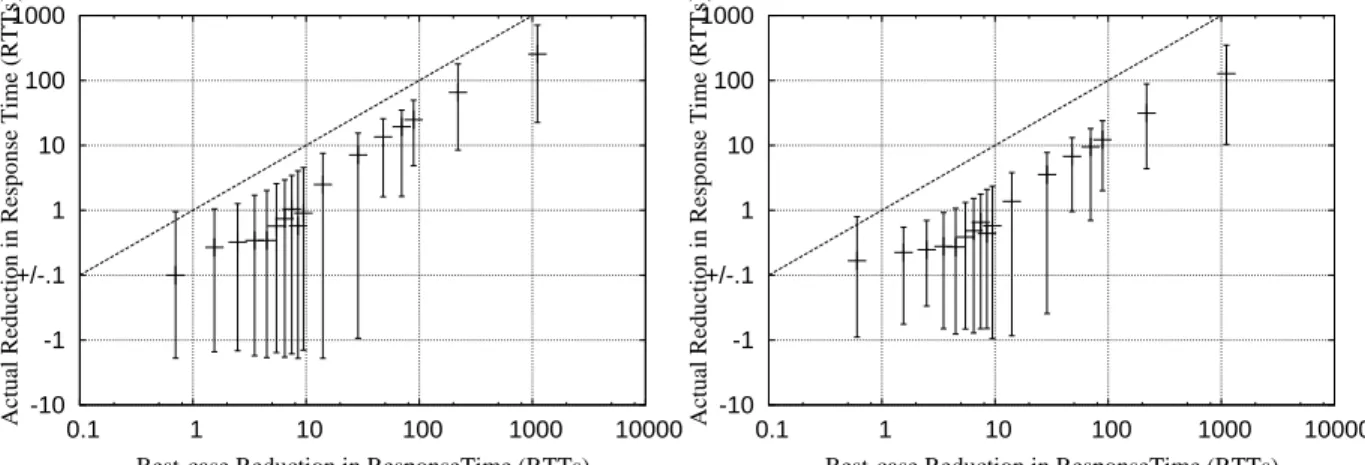
4.3 Distribution of Best-Case Reduction in Response Time . . . 84
4.4 Linux: Impact ofk= 2 on Connection Response Times . . . 86
4.5 Linux: Impact ofk= 3 on Connection Response Times . . . 86
4.6 Linux: Impact ofk= 6 on Connection Response Times . . . 86
4.7 Linux: Impact ofminRT O = 100ms, 400ms . . . 88
4.8 Linux: Impact ofa= 1/2 . . . 90
4.9 Linux: Impact ofD= 2 . . . 91
4.11 Smart Config: Actual Response Time vs. Upper Bound . . . 92
5.1 Distribution of Per-connection Loss Rate . . . 99
5.2 Loss Prediction Ability . . . 105
5.3 Congestion Phase Durations Before Loss . . . 106
5.4 False Positives Avoidance Ability . . . 107
5.5 Best-Case Savings in Connection Durations . . . 108
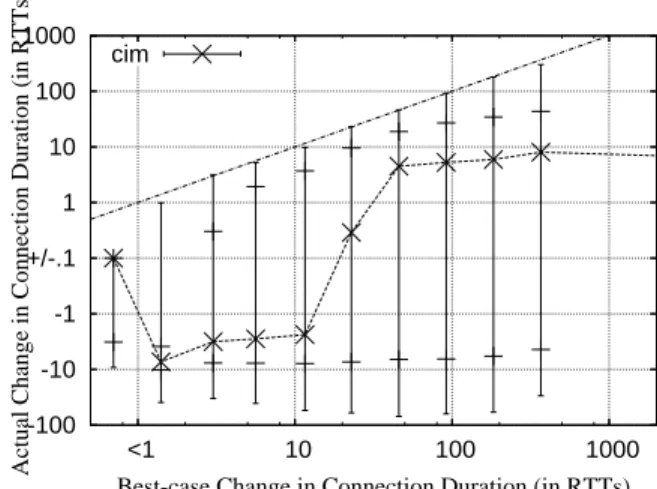
5.6 Impact of CIM on Connection Durations when an additive congestion avoidance approach is used . . . 109
5.7 Impact of VEGAS on Connection Durations when an additive congestion avoidance approach is used . . . 109
5.8 Impact of Tri-S on Connection Durations when an additive congestion avoidance ap-proach is used . . . 110
5.9 Impact of CIM on Connection Durations when an multiplicative congestion avoidance approach is used . . . 110
5.10 Impact of VEGAS on Connection Durations when an multiplicative congestion avoidance approach is used . . . 110
5.11 Impact of Tri-S on Connection Durations when an multiplicative congestion avoidance approach is used . . . 110
5.12 Distribution of Loss Rate Across Clusters . . . 115
5.13 Distribution of RTT Variability Across Clusters . . . 115
5.14 Distribution of Median Flight Size Across Clusters . . . 116
5.15 Distribution of Throughput Across Clusters . . . 116
5.16 Distribution of Correlation between Flight Size and RTT Across Clusters . . . 116
5.17 Distribution of Loss Distance Across Clusters . . . 116
5.18 VEGAS: Impact on Connection Duration (Add CA) on Cluster 1 . . . 117
5.19 VEGAS: Impact on Connection Duration (Add CA) on Cluster 2 . . . 117
5.20 VEGAS: Impact on Connection Duration (Add CA) on Cluster 3 . . . 117
5.21 VEGAS: Impact on Connection Duration (Add CA) on Cluster 4 . . . 117
5.22 CIM: Impact on Connection Duration (Add CA) on Cluster 1 . . . 118
5.23 CIM: Impact on Connection Duration (Add CA) on Cluster 2 . . . 118
5.24 CIM: Impact on Connection Duration (Add CA) on Cluster 3 . . . 118
5.25 CIM: Impact on Connection Duration (Add CA) on Cluster 4 . . . 118
5.27 Tri-S: Impact on Connection Duration (Add CA) on Cluster 2 . . . 118
5.28 Tri-S: Impact on Connection Duration (Add CA) on Cluster 3 . . . 119
5.29 Tri-S: Impact on Connection Duration (Add CA) on Cluster 4 . . . 119
A.1 Congestion window before and after a FR/R based spurious retransmission . . . 130
A.2 Congestion window before and after a RTO based spurious retransmission . . . 131
A.3 Congestion window for an RTO and FR/R event . . . 133
B.1 Congestion window before and after an Additive decrease . . . 138
LIST OF ABBREVIATIONS
ACK Positive acknowledgment TCP segment BFA Buffer Fill Avoidance
CARD Congestion Avoidance using Round-trip Delay CIM Congestion Indication Metric
CDF Cumulative Distribution Function DAG Data Acquisition and Generation
DAIMD Delay-based Additive Increase Multiplicative Decrease DBCA Delay Based Congestion Avoidance
DBCC Delay Based Congestion Control DBCE Delay Based Congestion Estimators
DECA Delay-based End-to-end Congestion Avoidance
FAST FAST AQM Scalable TCP
FIN TCP control flag indicating “no more data from sender” FR/R Fast Retransmit and Recovery
FSM Finite State Machine
GB Gigabyte
IP Internet Protocol
ISP Internet Service Provider
KB Kilobyte
kbps Kilobit per second
MB Megabyte
MSS Maximum Segment Size
Mbps Megabit per second
OOO Out of Order
OS Operating System
PA Partial Acknowledgment
Pkts Packets
RFC Request For Comments
RST TCP control flag indicating “connection reset”
RTO Retransmission TimeOut
SACK Selective ACKnowledgment SYN Synchronize TCP control segment
SYN-ACK Positive acknowledgement of SYN segment TCP Transport Control Protocol
Tri-S Slow Start and Search UDP User Datagram Protocol
CHAPTER 1
Introduction
The important thing in science is not so much to obtain new facts as to discover new ways of thinking about them.
—Sir William Bragg (1862–1942)
It requires a very unusual mind to undertake the analysis of the obvious.
—Alfred North Whitehead (1861–1947)
1.1
Thesis Goals
The end-to-end principle of network design argues for the implementation of most features required only by an end-to-end protocol at end-hosts and not in routers [SRC84]. Based on this argument, the Internet was designed with a network core primarily concerned with a best-effort transfer of packets between end-systems. Any application that requires additional features such as reliable delivery of packets needs to rely on an end-to-end protocol. Such a protocol has to deal with the unreliable nature of the underlying Internet infrastructure by detecting packet losses and recovering from these. Transport Control Protocol (TCP) is the most popular of such protocols. It accounts for more than 80% of the traffic on the Internet [tcpb, TMW97, CMT98]. Given its wide-spread usage, TCP performance arguably governs the performance of Internet transfers.
the window determines the maximum number of outstanding unacknowledged packets in the network. While TCP is waiting for an ack for a lost packet, it is unable to send out new data (because of the window limit), thereby stalling the data transfer. Also, when TCP detects a loss, it assumes that the loss is due to congestion on the network; in order to reduce the load on the network, it reduces its window size and further witnesses degradation in its throughput. A degradation in throughput can also be characterized as anincrease in the time taken to transfer all data, referred to as theresponse time. The above description argues that packet losses have the potential to significantly increase response time.
While the above argument is well established and it is generally believed that losses do impact TCP performance, the extent to which they do so in the real world is not well understood. The impact of losses on TCP’s performance can be understood by studying two different interactions between TCP and losses – (i) TCP’s efficiency in detecting packet losses when they occur and (ii) TCP’s efficiency in predicting and hence avoiding losses when possible. We look at each of these below.
• Ability of TCP to detect losses: Two performance-related goals guide the design of TCP’s de-tection mechanisms. First, TCP shouldaccuratelyidentify segment losses. In particular, if TCP erroneously infers that a segment was lost, it would unnecessarily invoke loss recovery which in-creases the connection duration. Second, TCP should quickly identify segment losses. A longer detection period would result in longer stalling periods for the connection while it waits for an ack. This would adversely impact the connection duration as well. Unfortunately, these two goals conflict with each other. A “quick” inference of segment loss would also be erroneous when segments (or their acks) are not lost but merely delayed or reordered in the network. To achieve high loss-estimation accuracy, therefore, TCP would necessarily have to wait longer for acks that may merely be delayed.
– Study the accuracy and timeliness of TCP loss detection/recovery in real world TCP
con-nections originating from prominent sender-side OSes, and
– Study the impact of changing parameter configurations on the overall durations of real world
connections in order to identify the best parameter settings.
• Ability of TCP to predict losses: In order to avoid the heavy penalty associated with packet losses, several studies have looked at alternate network signals, such as packet delays, to detect congestion [Jai89, WC91, WC92, BOP94, AR98, MNR03, WJLH06, YQC04, LSM+
07]. These schemes rely on Delay Based Congestion Estimators (DBCEs) that assume that during periods of congestion, the packets of a connection would experience higher queuing delays than normal at the congested link – this should translate to an increase in packet round-trip times (RTTs). So by sampling per-packet RTTs, and comparing them to a base RTT (measured in the absence of congestion), a DBCE infers the onset as well as alleviation of congestion. More relevantly, a DBCE expects to avoid most packet losses by doing so. The success of the DBCEs, however, depends on the basic premise that the DBCEs can accurately predict the occurrence of losses. Unfortunately, the validity or invalidity of this premise has not been demonstrated convincingly. Specifically, most DBCE evaluation assume that delay is “always” an indicator of congestion. However, this assumption may be too strong given that the end-to-end delay signal may be too noisy due to several network and connection characteristics such as queuing at multiple routers, ack compression [ZSC91], and insufficient sampling of network delay information. The extent of the reliability of the delay signal and its relationship with network and connection characteristics in the real Internet needs to be understood to correctly interpret this signal.
Our objective is to
– Systematically evaluate the ability of different Delay Based Congestion Estimators (DBCEs)
to accurately predict losses.
– Study the impact of connection characteristics on the performance of DBCEs
end-hosts differ in the configuration and variant of TCP used and a packet trace originating from a host does not directly indicate which one is being used.
Hence, it is our objective in this dissertation to first develop passive analysis techniques that can result in an in-depth analysis of TCP reliability mechanisms by studying Internet packet trace
1.1.1
Summary of Dissertation Objectives
• Study the accuracy and timeliness of TCP loss detection/recovery in real world TCP connections originating from prominent sender-side OSes, and
• Study the impact of changing parameter configurations on the overall durations of real world connections in order to identify the best parameter settings.
• Systematically evaluate the ability of different Delay Based Congestion Estimators (DBCEs) to accurately predict losses.
• Study the impact of connection characteristics on the performance of DBCEs
• Develop a passive analysis tool for accurate and in-depth analysis of real world TCP connections.
In the rest of the chapter, I will briefly describe our approach for developing a passive analysis tool. I will then formulate the problem of analyzing and improving TCP loss detection and prediction. I will conclude this chapter with my thesis statement, a summary of major contributions and an overview of the rest of the dissertation.
1.2
Passive Analysis of TCP Traces
1.2.1
Benefits of Passive Analysis
1.2.2
Challenges of Passive Analysis
Passive analysis present two significant challenges. First, with ever-increasing traffic volumes carried by Internet links, the collection, storage, and analysis of packet traces presents logistical as well as computational constraints. Passive analysis techniques, therefore, need to be designed to be able to operate with such constraints. The second challenge is that passive analysis does not allow any direct control over either the end-system mechanisms or the network and traffic conditions experienced by the traffic; one can simply observe what occurs. This makes it difficult to answer “what if” type of questions.
To see how these challenges impact our work, recall that the main goal of this dissertation is to study TCP’s efficacy in recovering from and in predicting packet losses. This goal requires that our passive analysis should be able to: (i) identify all occurrences of packet losses in a given TCP connection trace, (ii) study the efficiency of the corresponding TCP sender’s loss detection/recovery mechanisms in dealing with these losses, and (iii) study the ability of TCP to predict such losses. All three of these steps must address the first issue by making sure that the analysis is completed in a single-pass through a trace and does not require excessive memory or intermediate storage. The second and third steps also require that we be able to, respectively, modify loss detection/recovery mechanisms and introduce loss prediction mechanisms at the TCP sender corresponding to each trace, and then study the impact on connection performance. With passive analysis, we can do this only by relying on a “semi-experimental” approach, wherein we develop models to capture the above interaction.
We develop a passive analysis tool called TCPdebug that achieves the first of the above steps. Below we describe our methodology for developing TCPdebug.
1.2.3
Developing TCPdebug
Since TCP itself uses several detection/recovery mechanisms like – retransmission timeouts (RTO) [APS99] , Fast retransmit/recovery (FR/R) [Ste97], Partial Acks (PA), Selective Acks (SACK) – to detect losses, the simplest (and common) approach for inferring segment loss is to simply look for the reappearance of some segments in the TCP packet trace and assume that the original packet was indeed lost in the network [KSE+04]. However, this approach can lead to over-estimation of losses. TCP maintains
a timeout. In order to reliably infer packet losses from all segments retransmissions, it is important to track the explicit triggering of TCP’s loss detection mechanisms—namely, RTO, FR/R, PA, and SACK.
It turns out that even simply tracking the triggering of loss detection/recovery mechanisms in a TCP sender—as is done in [JID+
04]—is not sufficient for reliably inferring packet losses. This is because of two reasons related to TCP’s inability to accurately infer packet losses:
• Some losses do not trigger TCP’s loss detection phases: If multiple packets are lost together, the first packet is detecting using TCP’s detection mechanism while the subsequent packet retransmissions may be triggered in some versions of TCP using implicit signals like Partial ack (PA) [FHG04]. It is, thus, important to identify implicit retransmissions that are needed for recovering from packet losses. It should be noted that if the history about all previously transmitted data packets is maintained, the ACK stream can help to identify such retransmissions. • A TCP sender may incorrectly infer packet losses: TCP may retransmit a packet too early if its RTO computation is not conservative. Furthermore, some packet re-ordering events may result in the receipt of duplicate acks, triggering a loss detection/recovery phase in TCP. It is, therefore, important to identify explicitretransmissions that are not needed for recovering from packet losses.
The final significant issue is due to the diversity among real-world operating systems (OSes) in the implementation and configuration of TCP loss detection/recovery mechanisms. This diversity poses two types of challenges. First, the details of most of these implementations are either not well-documented or are hidden behind proprietary code. Second, given a TCP connection trace, it is not clear which sender-side implementation it corresponds to. Hence, it is important to extract details of TCP loss detection/recovery from prominent TCP implementations and to develop techniques for identifying the
sender-side OS for a given packet trace.
behavior. The extracted behavioral signatures can also help in identifying the sender-side OS for an arbitrary Internet trace. Thus, our basic approach for passive inference of TCP losses is as follows: (i) Use reverse-engineering to extract the implementation details of loss detection/recovery in four promi-nent TCP stacks (Windows XP, Linux 2.4.2, FreeBSD 4.10 (MacOS), and Solaris) by experimenting with these in a controlled lab setting, (ii) Replicate the loss detection/recovery mechanisms in four OS-specific analysis state machines—these state machines use the data and ACK streams, (iii)Augment these machines with extra logic and state about all previously-transmitted packets in order to classify retransmissions as needed or unneeded and to infer packet losses with accuracy greater than TCP, and (iv) Run each connection trace against all four machines and use the analysis results from the one that can explain and classify all of the observed out-of-sequence (OOS) segments.
1.3
TCP Loss Detection
UsingTCPdebug, our first objective is to analyze the efficiency of TCP loss detection mechanisms. Below, we review these mechanisms and formulate the problem of analyzing these.
Loss detection mechanisms: TCP senders assign sequence numbers to all data bytes transmitted and receivers use cumulative acknowledgments (ACKs) to confirm receiving these. Senders detect segment losses using two types of mechanisms that rely on the ACK stream: retransmission timeouts (RTOs) [APS99] andfast retransmit/recovery(FR/R) [Ste97]:
a, b, m, k, minRT O[PA00]—RTO-based loss detection can, therefore, be time-consuming. FR/R: FR/Rs are a faster means of detecting losses—if a segment is lost, segments with higher
sequence numbers trigger duplicate (cumulative) ACKs for its preceding segment. Hence, when a sender receives duplicate ACKs for a segment, it can conclude that the next higher segment was lost. However, reordering of segments by the network can also trigger the generation of duplicate ACKs. In order to avoid erroneously inferring loss in such cases, TCP senders usually wait for D >1 duplicate ACKs [Ste97] before concluding a segment loss.
TCP receivers may also use selective acknowledgments(SACKs) or Partial acks (PA) for informing the sender of missing segments—this helps quickly detect subsequent losses when multiple segments are lost.
When loss is detected, segments are immediately retransmitted. Loss recovery is also accompanied by a reduction in TCP sending rate—the reduction is quite significant for RTO-based loss detection. The invoking of loss detection/recovery can thus be quite costly in terms of connection duration1.
Factors affecting the loss detection efficacy: The exact cost of loss recovery depends on the choice of values for each of the 6 parameters associated with loss detection: D, a, b, m, k, minRT O. Two performance-impacting goals guide the optimal setting of these parameters:
• High accuracy of loss detection: First, a TCP sender should be accurate when it identifies segment losses. If TCP erroneously infers that a segment was lost, it would unnecessarily invoke loss recovery, reduce its sending rate and hence increase the connection’s duration.
Accuracy of FR/R-based loss detection can be improved by selecting a larger value of D, the duplicate ACK threshold—a largerD would help avoid spurious retransmissions when duplicate ACKs are generated not by segment losses, but by mere segment reordering in the network. Accuracy of RTO-based loss detection can be improved byselecting a larger value of RTO, which is determined by the parametersa, b, m, k, andminRT O—a larger RTO would help avoid spurious retransmissions when segments or their ACKs are not lost, but merely delayed in the network. • Timeliness of loss detection: Second, a TCP sender should quickly identify segment losses. The
Parameter Linux Windows FreeBSD Solaris
Timer granularity 10ms 100ms 10ms 10ms
Initial RTO (s) 3 3 3 3.375
minRT O (ms) 200 200 1200 400
a 0.25 0.25 0.25 0.25
b 0.125 0.125 0.125 0.125
m 1 1 1 1.25
k 4 4 4 4
D 3 2 3 3
RTO srtt + srtt + srtt+ 1.25*srtt +
vartt 4*rttvar 4*rttvar 4*rttvar
Table 1.1: Values of key parameters in different TCP Stacks. Timer granularity is the granularity of clock used in the OS to measure RTT and RTO. Initial RTO is the initial value of RTO used.
minRT O is the minimum value of the RTO permitted by the OS. a, b, m, k are the parameters of
RTO equation used by the OS. D is the dupack threshold used by the OS. RTO equation is the outline of the equation used by the OS.
reducing the connection duration. This is especially true for RTOs, which have long detection times—these can be reduced by selecting a smaller value of RTO.
The loss detection times for FR/R can also be reduced slightly by selecting a smaller value for D—in this case, the sender has to wait for a smaller number of duplicate ACKs before it can infer a loss. However, much more significantly, a smaller value of D enables more losses to be discovered using FR/R, rather than RTOs—this is especially true for small connections that do not transmit enough segments to generate the required number of duplicate ACKs. Given that RTO-based loss recovery is more costly than FR/R-based recovery, this further helps improve connection durations.
It is apparent from the above discussion that the goals of accuracy and timeliness of loss detection impose conflicting requirements on the values of the design parameters—accuracy requires the RTO and D to be large, while timeliness requires these to be small.
The proposed standards for TCP recommend values for each of these parameters [PA00, Ste97]— however, these recommendations are based on empirical evidence collected more than a decade ago. Furthermore, real world TCP implementations differ, sometimes significantly, in their default settings of these parameters (see Table 1.12
). This naturally raises two important questions regarding the ef-ficacy of TCP loss detection/recovery: Are the parameter settings in different TCP implementations working well in reducing connection durations? Are the decade-old recommended settings in the TCP
of key studies described below – however, most studies were conducted nearly a decade ago; conse-quently, these do not incorporate diversity in properties of real world TCP implementations, Internet paths, and application behavior. More importantly, no previous study has modeled the impact of TCP configuration on the overall connection durations of TCP connections.
In this dissertation we answer these questions using a two pronged approach. First, we study the current state of the TCP packet loss detection/recovery mechanisms in an OS sensitive manner. Second, we evaluate different parameter settings to identify the optimal setting to achieve best possible connection duration in real world connections.
1.4
TCP Loss Prediction and Avoidance
While the previous section discusses the possibility of detecting and recovering from losses efficiently, an alternate (and perhaps more desirable) approach would be to predict upcoming losses and react to avoid these from occuring. We next study ability of TCP to predict losses. Below, we discuss the advocated use of delay for predicting losses and formulate the problem of analyzing these predictors.
Ability of delay signals to predict losses: In order to avoid packet losses and the associated performance costs of TCP loss-recovery, severalDelay-based Congestion Estimators(DBCEs) have been proposed [Jai89, WC91, WC92, BOP94, AR98, MNR03, WJLH06, YQC04, LSM+
07]. These DBCEs rely on the assumption that during periods of congestion, packets within a connection will experience higher queuing delays at the congested link—this should translate to an increase in packet round-trip times (RTTs). By sampling per-packet RTTs, and comparing them to a base RTT value (measured in the absence of congestion), a DBCE infers the onset as well as alleviation of congestion. The hope is that DBCEs can detect the onset of congestion much earlier than the occurrence of packet loss and the corresponding congestion avoidance (CA) mechanisms can potentially avoid the loss. Existing DBCEs differ primarily in the RTT-derived metric and the base metric used for estimating congestion.
The performance of a DBCE is governed by how well it can predict congestion and help avoid packet loss. Specifically, two factors determine the overall efficacy of a DBCE:
the fraction of losses in a connection that can be predicted and avoided3
, the larger the likely reduction in connection duration.
• Ability to avoid false predictions: Note that an aggressive DBCE that signals congestion most of the time is likely to predict more losses. However, the corresponding CA mechanism would react to this signal and keep reducing the connection send rate—even when no loss is likely to happen—and degrade the connection duration. Thus, the lower the rate of false loss predictions made by a DBCE, the better the connection duration is likely to be.
Unfortunately, due to the inherent noise in TCP RTT estimates, the two factors mentioned above are often in conflict with each other. An aggressive DBCE is likely to predict more losses, but also have a high rate of false predictions. On the other hand, a conservative DBCE will seldom give false predictions, but would miss out on many losses. Consequently, it is natural to ask: how well do existing DBCEs perform along these two factors? And perhaps more importantly, what DBCEs perform the best in terms of achieving maximum reduction in connection duration?
Secondly, the loss prediction ability is also a characteristic of the connection and the network. A connection that consumes a significant portion of bandwidth on a congested link is likely to witness high correlation between the losses and end-to-end delays. On the other hand, connections that traverse a highly multiplexed path and occupy only a small fraction of the link bandwidth may witness low correlation. In our evaluation of DBCEs, therefore, we would also like to address the question,: what connection and network properties affect the performance of a DBCE in real-world TCP transfers?
While DBCEs have been evaluated in the past [JWL03, PJD04, BV03, MNR03, BV98a, BV98b], the issue of what DBCEs are likely to improve the overall timeliness performance of TCP connections has not been adequately addressed. To understand these issues we first conduct a comprehensive evaluation of several prominent DBCEs. Our evaluation explicitly models the impact of a DBCE on the duration of these connections. Next, we study the characteristics of these connections in order to analyze their influence on the efficacy of delay-based congestion estimation.
1.5
Thesis Statement
While it is generally accepted that TCP, the most popular transport protocol in use in the Internet, is adversely affected by the packet losses on the network, the actual impact of these losses on TCP performance in the real world is not well understood. Furthermore, the ways to mitigate this impact have not been systematically evaluated. In this dissertation, I carry out a systematic evaluation of the impact of packet losses on real world TCP connections and also evaluate two approaches to mitigate the impact of losses, namely (i) optimizing the configuration of current loss detection algorithms and (ii) evaluating the efficacy of delay signals in predicting losses. This dissertation develops a detailed OS-sensitive passive analysis tool to facilitate the above analysis.
The main theses of my dissertation are as follows
• Real world TCP connections can accurately be analyzed to study the impact of packet losses on TCP.
• We can improve upon the recommended and in use configurations of TCP loss detection param-eters to improve TCP performance.
• Aggressive DBCEs can help in predicting the packet losses for connections with high throughput but have limited use for other connections.
1.6
Contributions
The main contributions for this dissertation are as follows
integrated into a single, carefully validated tool. We have also been careful to cover many of the “corner cases” and boundary conditions that are missing in prior work, choosing to rely on explicit sender-state tracking rather than approximations or heuristics where possible.
• Using TCPdebug we analyzed a large number of diverse traces to provide a detailed view of current state of losses in the Internet. We find that while a large percentage of connections do not experience any loss at all. For connections that do experience losses, the main detection mechanism used to detect these losses is RTO and not FR/R. The main cause of prevalence of RTO is the small flight sizes of typical connections, which do not generate significant duplicate ACKs to trigger FR/R based loss detection. Finally, we find that a significant number (3.7-19%) of all retransmissions are unnecessary as the packets are not actually lost.
• We performed a detailed analysis of TCP loss detection using TCPdebug. Specifically, we study the impact on connection performance of the configuration of parameters associated with TCP loss detection. To facilitate this analysis, we develop models to capture the impact of change in each parameter setting on the total duration of a connection. Based on this analysis we conclude that:
– Most of current implementations of RTO estimators are conservative in incorporating vari-ability in TCP RTT. Reducing the influence of RTT varivari-ability can help significantly reduce the connection durations of TCP connections.
– Unlike in the past, timer granularity and the minimum RTO no longer significantly limit connection performance.
– Based on our analysis of a large number of connections, we found that the best-performing configuration of TCP loss detection can be obtained by lowering the value ofKfrom current default value of 4 to 2 and making the dupack threshold D adaptive according to the rule D=max{1, min{3, F−2}}where F is the current flight size of the connection.
– The Linux RTO estimator converges fast and is the most efficient. If properly configured, this estimator has the greatest potential for improving connection durations.
• We evaluated the ability of several prominent DBCEs to predict losses. We developed analytical models to passively predict the impact of these predictions/mis-predictions on the connection duration. We find that
– The estimator used by the prominent Vegas protocol is fairly conservative. It has almost no impact on the performance of TCP connections that do not transmit large flights of segments.
– Tri-S and DECA are two estimators which, in most cases, worsen connection performance.
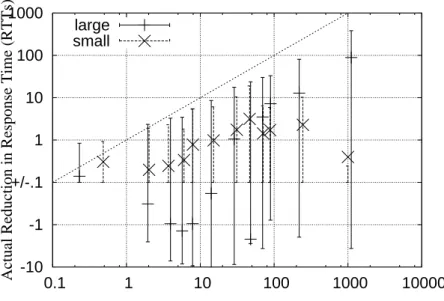
• Finally, we study the influence of connection characteristics on the performance of DBCEs. We find that connections with a high throughput and large flight sizes are likely to benefit the most from any DBCE . Connections which have very few packets in flight are least likely to see any improvement in their performance.
1.7
Overview
In Chapter 2, we first discuss the basic functioning of TCP, its congestion control algorithm and alternate congestion control algorithms. Next we present a survey of various passive and active analysis tools. Finally, we summarize research on TCP analysis as well as modeling of TCP performance.
Chapter 3 presents our toolTCPdebug. In this chapter we present the basic approach for the tool, its major challenges, and their solutions. Finally, we validate the accuracy of the tool and compare it with other prominent tools in this area.
Chapter 4 focuses on analyzing the efficacy of current TCP implementation’s loss detection mecha-nisms. We show results from systematic evaluation of the impact of design parameters associated with TCP loss detection/recovery mechanisms on the performance of real world TCP connections. This chapter concludes by suggesting changes to current TCP implementations and its potential impact on TCP performance.
Chapter 5 studies the ability of nine prominent DBCEs to predict or mis-predict losses. It quantifies the potential change in connection duration each of these DBCEs results in for a prediction or mis-prediction and uses it to evaluate the overall impact of each DBCE . We also study the impact of connection duration on the performance of these DBCEs .
CHAPTER 2
Background and Related Work
A scientific theory should be as simple as possible, but no simpler.
—Albert Einstein (1879–1955)
The outcome of any serious research can only be to make two questions grow where only one grew before.
—Thorstein Veblen (1857–1929)
TCP, being the most popular transport protocol, has received a lot of attention in the literature. In the first part of this chapter we will provide a brief background on TCP and its operation. In this part we discuss the mechanism used by most current implementation of TCP. With this background, in the second part of the chapter we highlight some of the past work related to this dissertation. This covers past work on
• TCP reliability and congestion control. We look at the literature which proposes and evaluated alternate approaches for implementing congestion control in TCP. We then discuss work related to enhancing and evaluating the accuracy of TCP’s loss detection mechanism which is the backbone of achieving reliability in TCP as well as look at how several other protocols achieve reliability. • TCP analysis tools and methodologies. Next, we present various tools and methodologies
de-veloped for understanding TCP’s behavior and performance and highlight their advantage and drawbacks.
Figure 2.1: Time Sequence Plots for TCP: these plots are used to present the exchange of data and acks between the sender and the receiver
2.1
Background
In this section, we will discuss the basic operation of TCP protocol as well as some of the popular modifications proposed or implemented for this protocol. TCP provides a connection oriented data transfer service to applications communicating over the Internet. The main reasons for TCPs popularity are that it provides two attractive services: reliability and congestion control. Reliability ensures that all data reaches the receiver while congestion control makes sure that a TCP connection does not overload the network. Below we discuss how TCP implements these services.
2.1.1
TCP Reliability
In order to provide reliability, TCP relies on the mechanism of assigning sequence number to all the data it sends out and requires the receiver to send acknowledgment for the data it receives. TCP sends out new packets on receiving the acknowledgment for packets it has send out. This interaction can be represented by a time sequence plot as shown in figure 2.1. The x-axis plots the time and the y-axis plots the sequence number of packets send by the sender or the acks received. The data packets are depicted by an arrow and the cumulative acknowledgment received so far is represented by a dotted line.
Figure 2.2: Retransmission Timeout (RTO) based loss detection in TCP
for detecting any packet loss and retransmitting the packets. TCP relies on implicit signals from the network or the receiver to make an educated guess about whether a packet is lost or not. It detects the first of a series of packet losses using one of the following mechanisms.
Retransmission Timeout
TCP starts a timer when it sends out a data packet and waits for an acknowledgment. The timer is referred to as the retransmission timer. If an acknowledgment arrives before the timer expires, TCP resets the timer and measures the time difference between the data packet send and its ack received as the Round Trip Time (RTT) for the connection (as shown in figure 2.1). However, if an acknowledgment is not returned within the timeout period, the sender times-out, assumes that the packet is lost in the network and retransmits it. Fundamental to this strategy is the act of setting the retransmission timeout (RTO). In order to adjust to the network delays over different types of network, the retransmission timeout is not set to a fixed value but is calculated as a function of the connections RTT. Also, as the RTT itself may vary during the duration of the connection, the retransmission timeout is recomputed with each measurement of the RTT.
Figure 2.3: Duplicate acknowledgments based loss detection in TCP
connection1
.
Duplicate Acks Based Detection
To reduce the amount of stalling TCP undergoes when it has to wait for a timeout, it relies on a second, much faster, detection mechanism whenever possible. A TCP receiver sends out implicit negative acknowledgment on receiving a higher sequence number packet than what it was expecting. For TCP these negative acks are simply inferred from the duplicate acks for the last in-sequence packet. Reception of the duplicate ack indicates to the sender that a packet may be lost or delayed as the only way a duplicate ack is generated is if the receiver is missing a packet. TCP waits for a few of these before concluding that the packet is indeed lost and resends2
. Figure 2.3, shows a dupack triggered loss detection. RTO based detection is very conservative and cause connection stalling for several RTTs, the dupack based detection is more aggressive (as it has more information to make an informed decision.) and leads to loss detection in slightly more than an RTT. As is indicated in the figure 2.3, the amount of stalling in this case is much less compared to the RTO based detection.
Next we discuss the congestion control algorithm used by TCP.
1Note that smaller connection duration is usually desirable as it means that all the data sent reaches the receiver earlier.
Figure 2.4: TCP Slow Start: The congestion window increases exponentially.
2.1.2
TCP Congestion Control
Early TCP implementations relied on a simple go-back-n mechanism without any congestion control. It had a notion of a fixed congestion window(cwnd) size and the whole window size worth of data is sent out without waiting for any acknowledgment. The sender waits for a predefined time (timeout interval) for an acknowledgment from the receiver and in absence of any ack, it resends all the packets again starting with the unacked packet.
The problem with this approach is that if TCP’s sending rate causes a router in the path to get overloaded and its queue to overflow causing packet losses, TCP would simply timeout and resend all the packets at the old rate, again overloading the network. To prevent this effect, TCP implements a congestion control approach where it is continuously trying to adjust its sending rate to match the available capacity on the network. The algorithm used by TCP consists of several distinct phases and the rate adjustment in these phases and transition to and from these phases is described below.
Slow Start
When a connection is established, it starts off in a slow start phase. The initial size of the congestion window is between one to four packets3. The connection sends out the “congestion window” worth of
Figure 2.5: TCP Congestion Avoidance: The congestion window increases linearly.
network queues overflows and leads to packet losses. This loss is detected using either the retransmission timeout (RTO) or the duplicate ack-based detection.
TCP considers the encountered loss as an indication of network congestion and to alleviate the congestion it reduces its sending rate. The amount by which it reduces its sending rate depends on the mechanism used to detect the loss. If the loss is detected using a retransmission timeout it reduces the sending rate down to one packet and then uses a combination of slow start and congestion avoidance described below to increase its congestion window again. On the other hand, if the loss is detected using duplicate acks it reduces the sending rate to half of its current rate and enters the fast retransmit and recovery phase as described below. This reduction in sending rate again impacts the connection’s duration. For retransmission timeout based detection the reduction is more drastic and hence may impact the connection more severely.
Congestion Avoidance
TCP uses a variable “ssthresh” to transition from an exponential increase to a linear increase. The slow start phase continues until it sees a loss or until the congestion window reaches the ssthresh limit. Once the congestion window crosses ssthresh, the connection enters the “congestion avoidance” phase. In congestion avoidance the sender increases its congestion window (cwnd) by 1/cwnd for every ack it receives. As shown in figure 2.5, this is equivalent to increasing the congestion window by 1 packet per RTT if every packet sent out is acked.
or duplicate acks. The ssthresh is set to maximum of 2 or half the number of packets in flight. As mentioned above when a loss is detected using RTO, the congestion window is reduced to 1, it then uses slow start to increase the window until it reaches ssthresh, and following that enters the congestion avoidance phase. The recovery scheme used after a dupack-based detection is described below.
Fast Retransmit and Recovery (FR/R)
When the sender receives a predefined number (recommended value is three) of duplicate acks, it concludes that the packet acked by the duplicate acks is lost and retransmits it. This is referred to as fast retransmit(FR). Following the loss detection, the ssthresh is updated and the congestion window is reduced to half the number of packets in flight. At this point the connection enters fast recovery instead of congestion avoidance.
In fast recovery, the sender keeps track of the number of duplicate acks it receives and since they are triggered by packets reaching the receiver, it inflates the congestion window and retransmits new packets to replace the ones which have left the network. This keeps the data flowing in the network. The sender comes out of fast recovery when it receives an ack for the segment which was retransmitted.
If multiple packets are lost from the same flight the losses following the first loss have to be indi-vidually detected using one of the two loss detection mechanism. This may increase the time it takes to detect the losses as well as reduce the sending rate multiple times. To avoid this, TCP relies on two mechanisms to detect multiple packet losses in the same flight. These mechanisms are detailed below.
Partial Acks
Figure 2.6: TCP Partial Acks.
Selective Ack (SACK)
Another way to deal with multiple losses is for the receiver to explicitly inform the sender about the packets it has received. This is exactly what selective acks do. TCP receiver uses SACK blocks, which are additional fields in an ack packet, to inform the sender what packets have reached it. After a dupack based loss detection, the sender retransmits all the packets indicated by the SACK block as missing at the receiver as long as the congestion window allows it.
We have so far covered the current popular implementations of TCP congestion control which are packet loss based. An alternate delay based scheme, which is slowly gaining popularity, is described below.
Delay Base Congestion Control for TCP We will now describe an alternate congestion control scheme which relies on packet delays. This scheme is popularly referred to as the Delay Based Con-gestion Control (DBCCs). In this section we will simply discuss the basic concept of this scheme and leave detailed discussion of the various Delay Based Congestion Estimators (DBCEs) proposed in the literature for the related work section.
Figure 2.7: Uncongested Network
and the ack to get back to the sender is simply the time it takes for these packets to propagate through the network. This results in the data packets experiencing the minimum RTT for the network. On the other hand if the network is congested, the network queues will be relatively full (as shown in figure 2.8), the data packets will spend some time queued behind other packets and hence the total time it takes for the data packet to reach the receiver and the ack to get back is more than the minimum RTT.
DBCEs exploit this very fact. It measures the RTT and whenever it finds that the current RTT is larger than the minimum RTT by a certain factor, it infers congestion. DBCEs are therefore likely to infer congestion before the queues in the network completely fill up. Thus, it can avoid losses from occurring. This ability to avoid losses can greatly improve the performance for a connection as now the connection neither stalls waiting for a loss detection, nor has to undergo the drastic reduction in sending rate following a loss.
Figure 2.8: Congested Network
2.2
Related Work
With the above background on TCP, we will now present some research related to this dissertation. The first step involved in improving any system is to understand it. Hence first we will look at the evolution of TCPs congestion control algorithms and work related to providing reliability with emphasis on the motivations behind the various design decisions. Next, we look at some of the tools used in the past for understanding TCP’s behavior. Than we look at some approaches to TCP analysis. This involves the various evaluations of TCP as well as work related to modeling the behavior of TCP. Both of these approaches help us better understand the performance of TCP.
2.2.1
Past Work on TCP Congestion Control and Reliability
Congestion Control
The current implementations of TCP use packet loss as an indicator of congestion. We will first briefly discuss these congestion control schemes and then look at other congestion control schemes based on delay, mathematical equations or sending rate.
Packet Loss Based Congestion Control
TCP was designed in the late seventies and early eighties as a reliable protocol. It achieved reliability by detecting packet losses and retransmitting the packets. It also provided flow control mechanism to prevent the sender from overrunning the receiver and sequencing of packets [CDS74, Pos81]. In October of 1986, the Internet observed a series of congestion events during which the performance of the Internet drastically declined [Jac95]. The cause was identified to be overflowing queues at the routers coupled with the use of continuous retransmissions by TCP to guarantee retransmission. In 1988 Jacobson proposed a series of algorithms based on the principle of “conservation of packets” to overcome these shortcomings [Jac95, APS99]. The proposed algorithms used packet drop as an indicator of congestion and employed exponential back-off mechanism to reduce its transmissions rate and thus mitigating the congestion. There were other proposed modifications like the use of slow start (for better estimation of available bandwidth at the start), better estimation of retransmission timeouts using variation in RTT, dynamic window sizing, etc. These modifications were deployed in a version of TCP that is popularly know as “TCP Tahoe”.
TCP performance.
TCP Reno works well in low loss conditions where only one packet is lost in the network at a time. However, if multiple packets are lost then TCP Reno is able to recover the loss quickly only for the first packet, the remaining packets still have to be recovered using the much more costly timeout mechanism. TCP New-Reno [FHG04] was proposed to overcome this drawback. When multiple packets are lost in the flight, a retransmission for the first lost packet triggers an ack indicating that the next packet expected is the second lost packet. This ack is called as a partial ack (PA) (as it does not ack all packets that where in flight when the loss occurred). In Reno a partial ack ends the fast recovery. New-Reno does not exit fast recovery on partial acks. It uses the partial ack as an indicator that the second packet (acked by the partial ack) was actually lost in the network and retransmits it. Thus when multiple packets are lost, New-Reno can recover without another fast-retransmit or timeout, retransmitting one lost packet per RTT.
All the above modifications used an “intelligent interpretation” of the ack stream to detect and recover from lost packets. While duplicate acks or Partial acks indicate that an intermediate packet is missing and a higher packet has reached the receiver, but it is not able to inform the sender which packets are exactly missing or have reached the receiver. To overcome this shortcoming TCP SACK [MMFR96, BAFW03] was proposed. The SACK option in a TCP header contains a number of sack blocks. Each sack block reports a non-continuous block of data received by the receiver. The first sack block includes the most recently received packet and the other block simply repeat the most recent sack blocks. The receiver can use the information supplied in the sack blocks to maintain a list of packets that have reached the receiver and the ones which are missing. Sack does not change the basic congestion control algorithm or TCP robustness to delayed/reordered packets by waiting for multiple duplicates acks before triggering fast retransmit. Its behavior is different only in presence of multiple losses in a flight. When multiple packets are lost and fast retransmit is triggered for the first packet, Sack TCP uses the information in the sack blocks to identify the other lost packets and retransmit them.
The above description captures the TCP variants used by most of current TCP implementations. New modifications [FMMP00, BA02, BRAB06, LK00, ZKFP03] to TCP’s congestion control have been proposed to overcome few specific problems with its performance. We will look at a few of these in Section 2.2.1.
Figure 2.9: Network Performance as a function of load
Delay Based Congestion Control
There are several proposed modifications to TCP which use increase in delay on a path as an indicator of congestion. These schemes are collectively referred to as Delay Based Congestion Avoidance (DBCA) techniques. The basic idea behind these schemes is described in Section 2.1.2. These schemes are based on the following principle. The increase in delay is due to queuing at the routers. The increase in queuing results from the load been greater than the network capacity. This is an indicator of congestion. These delay based techniques use the round trip time (RTT) as the delay estimate of a path instead of the one way delay, which is difficult to measure. Below we discuss a few prominent schemes proposed in this area followed by studies evaluating these schemes.
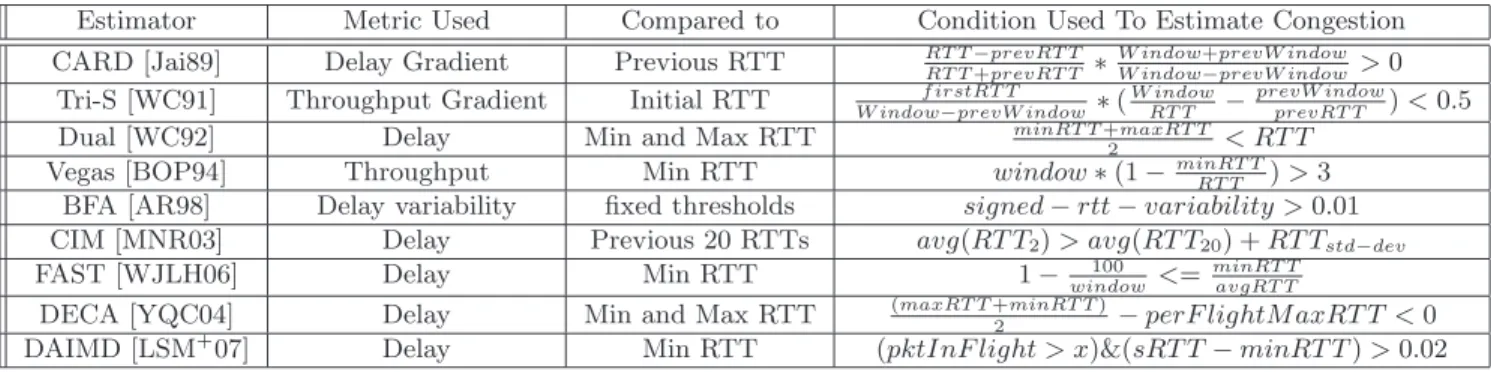
Proposed DBCEs (Delay Based Congestion Estimatators
CARD [Jai89] was proposed in 1989 and was the first of the DBCE schemes. It is based on the argument that when the network is lightly loaded, the connection throughput increases with an increase in sending rate. But as network load reaches saturation, connection throughput does not increase further and RTTs start to increase. This can be viewed as a power graph as shown in figure 2.94
. CARD uses the increase in delay associated with increased network load as an indicator of congestion. It measures a gradient of delay and based on whether the gradient is increasing on decreasing it reduces or increases
the congestion window.
TheTri-S scheme [WC91] is similar to this scheme but it uses a throughput gradient. It compares the current throughput gradient to the initial throughput gradient. Depending on whether the former is greater or small, Tri-S infers the absence or presence of congestion and decides on the change in congestion window.
While both CARD and Tri-S involve gradients, Dual [WC92] is based simply on comparing the maximum and minimum RTT.Dualis based on the assumption that the minimum RTT of a connection corresponds to the propagation delay along the network path, and the maximum RTT is the sum of this minimum RTT and the maximum queuing delay. When the current RTT exceeds the average of the min and max RTTs, Dual estimates congestion and its CA algorithm decreases the sending rate. Delay-based End-to-end Congestion Avoidance [YQC04] (DECA) also tried to maintain the RTT at the midpoint of the minimum and maximum RTT. However, instead of using the current RTT for comparison, it uses the maximum RTT observed in the last RTT interval.
While all the above schemes were promising, the idea of using delay as congestion indicator really came into the limelight following the introduction of TCP Vegas [BOP94]. TCP Vegas attempts to maintain enough data in the network such that it exceeds the delay-bandwidth product by a small amount. It compared the observed throughput in a flight of packet to the expected throughput, where the expected throughput is the throughput that would result in if all packets are acked within the minimum RTT. Its congestion-estimator relies on the fact that if the sending rate is much larger than that required to maintain only a few additional packets in the network, the connection RTT would increase (and its throughput would decrease). The decrease in connection’s throughput is an indicator of congestion. TCP FAST [WJLH06] is a variant of Vegas designed for high-speed networks. Its congestion estimator is similar to that of Vegas; although it uses increase in RTT as an indicator of congestion, its DBCE can be shown to be a simple derivative of the Vegas throughput-based DBCE.
Delay based Additive Increase Multiplicative Decrease [LSM+07] (DAIMD) is also based on
algorithm that uses a fixed threshold is theTCP Buffer Fill Avoidance[AR98] (BFA). BFA measures the RTT variability similar to TCP-Reno but maintains its sign (direction of change). If the variation is above 10ms, it predicts congestion. It predicts no-congestion when the variability falls below -10ms.
None of the above DBCEs use history of the RTT in its estimation. Next we look at two DBCEs which uses history of RTT for a connection to estimate the congestion. Sync-TCP [WJS05] is based on TCP Reno but uses one way delay to detect network congestion. It detects congestion and its severity as follows. Sync-TCP defines the difference between observed RTT and the minimum RTT as the queuing delay. It measures the trend in the queuing delay over a certain number of packets (usually 9) and if the trend is increasing it compares the measured queuing delay with the max queuing delay seen so far. Based on this comparison, the estimator predicts congestion severity. The Congestion Indication Metric (CIM) was proposed in [MNR03] as a DBCE metric. This metric compares the most recent RTT samples (typically 1-2 samples) to the average RTT of several immediately preceding samples (typically, 20). If the most recent sampled RTT is greater than the average RTT, it concludes congestion has occurred.
Apart from these DBCE, there are several other DBCEs that have been proposed for specific envi-ronments [SS06, PLK05, Qiu05], or that use delay in conjunction with packet loss signals [LBS06], or use a parameterized model in conjunction with a DBCE to predict losses [HR06, MOM02]. We have not considered these DBCEs as they are not generic enough.
Evaluation of DBCEs
We now look at research evaluating the efficiency of DBCEs. The efficacy of a DBCE depends on its ability to predict the onset of congestion (or predict an impending loss) accurately and in a timely manner. The first question to be asked is whether the DBCCs even have a hope of succeeding in the real network. We look at a few studies which argue that DBCCs will not be effective in the real network.
In [PJD04], the authors briefly discuss a set of conditions under which DBCC will fail. They argue that DBCC is bound to fail if: (i) the max queuing delay at the bottleneck link is too small compared to the connection RTT, or (ii) the RTT sampling rate is less than the required Nyquist rate, or (iii) there is high degree of aggregation along a path and a connection’s contribution to the total load is too small, or (iv) packet loss is not handled effectively. The paper, however, merely presents arguments and does not conduct a detailed investigation to validate the conclusions.
networks. It contends that the binary signal of loss/no-loss is too coarse to allow fine adjustment of send-rates, which is needed for stability at high speeds. A multi-bit signal can be obtained by using queuing delays as an additional indicator of network conditions. The authors, however, do not present any experimental results to illustrate/prove their point.
While both of the above studies present arguments against DBCE they do not evaluate DBCE in a real world experiment. Next, we look at some real world evaluations of DBCCs.
In [MNR03] the authors argue that if the increase in delay is due to the congestion in the queues, then a correlation should be present between observing higher delay for the packets and the probability of seeing a loss in the queue. They defines several metrics for quantifying correlation between packet losses and high RTTs. The authors conducted passive analysis of a large number of connections instantiated over 7 paths using the CIM DBCE defined in the paper. They find that using CIM as a congestion estimator can reduce connection loss rates. However, it also results in a large number of false positives resulting in a 37% reduction in the aggregate throughput. Based on this observation they conclude that DBCC is in general not a viable solution. This study is severely limited in its size. It also does not analyze the influence of connection characteristics on the performance of CIM.
In [BV03], the authors compare the correlation between the packets in flight and RTT unlike [MNR03], which compares the correlation between RTT and packet loss. The idea is that DBCC is likely to be effective only if its congestion avoidance can alleviate congestion by reducing the sending-rate (that is, the connection is self-congesting). This is not likely to happen if the correlation between sending rate (or packets in flight) and observed RTTs is low. The authors passively analyze 14,218 connections instantiated over 737 different paths. They found that, in general, the coefficient of correlation between RTT and packets in flight is weak [BV03]. However, this study does not evaluate the ability of DBCEs to predict loss in general.
Apart from these real network studies, there have been several studies using network simulations to evaluate DBCEs. In [BV98a, BV98b] the authors have used network simulations to evaluate the ability of Vegas, CARD, and Tri-S to predict loss. They found that all three methods are rarely better than a “random coin-tossing” estimator. However, the Vegas method was found to be slightly better than the other two methods. Unfortunately, their use of simulations prohibits evaluation under a wide range of connection characteristics, as well as prohibits sampling the wide variety of real world network conditions which may affect the performance of an estimator.